

Abstract
Premise of study:
Botanists have long been interested in the reasons for genetic variation among individuals, populations, and species of plants. The anthocyanin pathway is ideal for studying the evolution of such phenotypic variation.
Methods:
We used a combination of quantitative trait loci mapping and association studies to understand the genetic basis of variation in five anthocyanin phenotypes including calyx, corolla, and leaf coloration patterns that vary within and among populations of Mimulus guttatus. We then examined what genes might be responsible for this phenotypic variation and whether one of the traits, calyx spotting, is randomly distributed across the geographic range of the species.
Key results:
All five phenotypes in M. guttatus were primarily controlled by the same major locus (PLA1), which contains a tandem array of three R2R3-MYB genes known to be involved in the evolution of flower color in a related species of Mimulus. Calyx spotting was nonrandomly distributed across the range of M. guttatus and correlated with multiple climate variables.
Conclusions:
The results of this study suggest that variation in R2R3-MYB genes is the primary cause of potentially important anthocyanin phenotypic variation within and among populations of M. guttatus, a finding consistent with recent theoretical and empirical research on flower color evolution.
Keywords: evolution, geographic information system, inversion, metabolic control, Mimulus guttatus, monkeyflower, Phrymaceae, pigment, pleiotropy, quantitative trait loci
Botanists have long been interested in why plant species vary in morphological, physiological, and life-history traits (Turesson, 1922; Clausen et al., 1940; Stebbins, 1950; Grant, 1981; Briggs and Walters, 1997). With recent advances in molecular biology and statistical techniques, it is has now become feasible to determine the genetic mechanisms underlying this variation among plants (Lander and Botstein, 1989; Hancock et al., 2011). As a result of this recent progress, there is much interest in determining the extent to which the same or different loci are involved in phenotypic variation within and among populations, between species, and across environmental conditions (Feder and Mitchell-Olds, 2003; Hoekstra and Coyne, 2007; Mitchell-Olds et al., 2007; Stinchcombe and Hoekstra, 2008; Stern and Orgogozo, 2008; Anderson et al., 2011).
The anthocyanin biosynthetic pathway, which is responsible for red, blue, and purple pigmentation in plants, has become a model for understanding the evolution of phenotypic diversity (Rausher, 2008; Des Marais and Rausher, 2008; Martin et al., 2010; Toleno et al., 2010; Hopkins and Rausher, 2011). Production of anthocyanins involves a small set of structural pathway genes (chalcone synthase [CHS], chalcone isomerase [CHI], flavonoid-3-hydroxylase [F3H], flavonoid-3′-hydroxylase [F3′H], flavonoid-3′,5′-hydroxylase [F3′,5′H], dihydroflavonol-4-reductase [DFR], anthocyanidin synthase [ANS]) that metabolize anthocyanins from precursor molecules (Streisfeld and Rausher, 2011). Three types of transcription factors function as a complex to control and regulate the expression of the structural genes in the anthocyanin pathway. These regulatory genes are R2R3-MYBs (MYB), WD40-repeat (WDR) genes, and basic helix-loop-helix (bHLH) genes (Koes et al., 2005; Schwinn et al., 2006).
Most of the focus by evolutionary biologists on anthocyanins has been directed toward the evolution of flower color because of its role in attracting different types of pollinators (Whittall et al., 2006; Hoballah et al., 2007; Des Marais and Rausher, 2008; Rausher, 2008; Toleno et al., 2010). Recently, Streisfeld and Rausher (2011) found that across plant species, evolutionary changes in pigmentation intensity are preferentially mediated by the fixation of transcription factors over structural pathway genes and that MYB transcription factors are preferentially fixed over bHLH and WDR transcription factors. The fixation of protein coding changes in structural pathway genes are thought to be rare because they incur substantial deleterious pleiotropic effects by affecting anthocyanin production in all plant tissues. Streisfeld and Rausher also argued that MYBs are most likely to be involved in the evolution of pigmentation intensity because, unlike bHLH and WDR genes, R2R3-MYBs are very specific in only regulating anthocyanin production and are more tissue specific in their action (Quattrocchio et al., 2006; Schwinn et al., 2006; Gonzalez et al., 2008; Martin et al., 2010). Thus, mutations in R2R3-MYBs are most likely to be involved in the evolution of pigmentation intensity because they are the least likely of anthocyanin genes to cause widespread negative pleiotropic effects. While such evolutionary genetic patterns have come into focus for the evolution of floral anthocyanins, fewer studies have examined the genetic basis of natural variation in vegetative anthocyanin phenotypes (Yamazaki et al., 2003; Kobayashi et al., 2009). Anthocyanin production in vegetative tissue may be very important ecologically because anthocyanins and their precursors are thought to be involved in plant response to abiotic and biotic stresses such as drought, salt, cold, UV exposure, metal toxicity, and herbivores (reviewed in Chalker-Scott, 2002; Gould, 2004). Rarely has the genetic basis of both vegetative and floral anthocyanin polymorphism been examined in the same species (Albert et al., 2011).
Polymorphisms in anthocyanin pigmentation patterns have been well documented and shown to have simple genetic control in the Mimulus guttatus species complex (Ganders et al., 1980; Griffiths et al., 1982; Griffiths and Ganders, 1983) as well as in the closely related Chilean Mimulus luteus species complex (Cooley et al., 2008; Cooley and Willis, 2009). Recently, Cooley et al. (2011) showed that parallel gains of anthocyanin production in petal lobes of South American Mimulus species are caused by the evolution of R2R3-MYB transcription factors. Sequencing of the M. guttatus genome has revealed five paralogs of anthocyanin R2R3-MYBs. Three paralogs (MgMYB1, MgMYB2, MgMYB3) occur as a tandem array on chromosome 8 in the PLA1 locus, while the other two (MgMYB4, MgMYB5) are located in an unlinked tandem array on chromosome 12 in the PLA2 locus (Cooley et al., 2011). The PLA1 and PLA2 MYBs comprise two distinct phylogenetic clusters, with the PLA1 cluster most closely related to ROSEA1, ROSEA2, and VENOSA of Antirrhinum (Cooley et al., 2011). The MYB tandem array of PLA1 is involved in the evolution of petal lobe pigmentation in M. cupreus, while the tandem array of PLA2 is involved in parallel pigment evolution in M. luteus var. variegatus (Cooley et al., 2011). In M. guttatus, the chromosome 8 tandem array is located within a geographically widespread chromosomal inversion polymorphism that is known to pleiotropically control multiple adaptive traits that differentiate annual and perennial forms of that species (Lowry and Willis, 2010).
In this study, we focused on understanding the phenotypic variation in three vegetative and two floral anthocyanin polymorphisms that segregate within M. guttatus (Fig. 1f). Some of these phenotypes are polymorphic within populations, while others are fixed between populations. Phenotypes also range from environmentally inducible to constitutively expressed and thus represent a broad spectrum of interesting botanical variation. Overall, our study focused on answering three questions. (1) What portion of the anthocyanin phenotypes is controlled by the candidate PLA1 locus? (2) Are there any other candidate anthocyanin genes, besides MYBs, that could explain the control of anthocyanin pigmentation by PLA1? (3) Is variation in anthocyanin traits randomly distributed across the range of M. guttatus, or is it correlated with any particular environmental variables or ecoregions?
Fig. 1.

Anthocyanin phenotypes associated with the PLA1 locus in M. guttatus. (A) Adaxial leaf coloration indicated by arrow. (B) Abaxial leaf coloration (left), leaf blotching indicated by arrow (center), no coloration (right). Calyx (C) without and (D) with spotting. Corolla tube (E) without and (F) with banding (indicated by arrow).
MATERIALS AND METHODS
Study system
All members of the M. guttatus species complex have yellow flowers due to the expression of carotenoids, with slight variation in red anthocyanin spotting on the tongue of the corolla tube (Wu et al., 2008). However, vegetative anthocyanin polymorphisms are widespread within and among populations of M. guttatus (Ganders et al., 1980; Griffiths and Ganders, 1983). Previous controlled crosses have shown that leaf blotching polymorphisms (Fig. 1b) as well as spotting of floral calyxes (Fig. 1d) are caused by single Mendelian loci (Ganders et al., 1980; Griffiths et al., 1982). Additional polymorphisms, including anthocyanin production on the adaxial (Fig. 1a) and abaxial (Fig. 1b) sides of leaves, as well as at the proximal end of the corolla tube (Fig. 1f), are commonly observed in the field (Table 1).
Table 1.
The five anthocyanin polymorphisms examined in this study.
| Polymorphism | Environmentally dependent | Variation | Association | Cross | Allele causing phenotype |
|---|---|---|---|---|---|
|
| |||||
| Adaxial leaf color | Yes | Between population lines | QTL | IM × DUN | DUN |
| Abaxial leaf color | Yes | Between population lines | QTL | IM × DUN | IM |
| Abaxial leaf blotching | No | Within population | Marker | AWP self-fertilization | AWP |
| Calyx spotting | No | Among populations | Marker | LMC × SWB/LMC × IM | LMC |
| Corolla tube band | No | Between population lines | Marker | LMC × IM | IM |
Variation in leaf color pattern across environmental conditions
While conducting previous experiments (Lowry et al., 2009), we observed that plants differentially responded to environmental variation based on the population from which they were collected. Plants from a coastal perennial population (DUN; Oregon Sand Dunes) produced anthocyanins at the base of the adaxial (upper) side of their leaves under an 8-h day photoperiod, while plants from an inland annual montane population (IM; Oregon Cascade Mountains) did not. In contrast, under an 18-h day length, DUN plants produced no adaxial coloration, but the entire abaxial (lower) surface of IM plants was covered by anthocyanins. To evaluate the genetic basis of this genotype by environment interaction in anthocyanin phenotypic response, we mapped QTLs using recombinant inbred lines (RILs). The creation and genotyping of the RILs is described in detail elsewhere (Hall and Willis, 2006; Lowry et al., 2009). Briefly, RILs were created from a cross between an inbred line (IM62) derived from the IM population and an outbred individual from the DUN population. An F2 population of this cross was selfed for 6–8 generations to create the RILs. The RILs were then genotyped with a set of exon-primed intron-crossing (EPIC) markers (http://www.mimulusevolution.org) derived from expressed sequence tags (ESTs). A genetic map for 186 of the RILs was assembled with 189 markers leading to the recovery of 14 linkage groups that matched the known number of chromosomes.
To determine the genetic architecture of the leaf coloration patterns across environmental conditions, we grew RILs under two conditions: short and long day lengths. RILs were germinated in 2.5-in2 plastic pots filled with Fafard 4P soil. Replicates of each line were distributed between a growth chamber set for 8-h days and a room in the Duke University greenhouses set for 18-h days. For all experiments in this study, temperatures were set to 21°C for light periods and 16°C for dark periods at a constant 30% humidity. A total of 2–6 replicates of 164 RILs were grown under 8-h days, and 167 RILs were grown under 18-h days. Overall, only 158 RILs overlapped between experiments due to problems with germination and subsequent survival. Inbred lines from the parental populations of the RILs, DUN and IM, were also grown under both conditions (see Table 2 for the geographic locations of populations used in this study).
Table 2.
Locations of populations used in this study for genetic crosses and genetic analysis of anthocyanin polymorphisms.
| Pop ID | Location | Latitude (N) | Longitude (W) |
|---|---|---|---|
|
| |||
| AWP | Anacortes Park, Skagit Co., WA | 48°29′28″ | 122°41′36″ |
| IM | Iron Mountain, Linn Co., OR | 44°24′03″ | 122°08′57″ |
| DUN | Oregon Dunes, Lane Co., OR | 43°53′35″ | 124°08′16″ |
| LMC | Yorkville, Mendocino Co., CA | 38°51′50″ | 123°05′02″ |
| SWB | Irish Beach, Mendocino Co., CA | 39°02′09″ | 123°41′25″ |
At 4 weeks after germination, RILs were scored for the presence or absence of adaxial leaf color pattern under 8-h days and abaxial leaf coloration under 18-h days. Thus, each individual in the experiment received a score of 1 for presence and 0 for absence of the trait. Some RILs contained contradicting individual replicates, where some replicates of the RIL expressed the phenotype and other replicates did not. Such a pattern is likely due to residual heterozygosity within RILs or to incomplete penetrance of the trait. For these polymorphic RILs, the proportion of replicates expressing the polymorphism was used as the phenotypic score, with the total score per RIL ranging from 0 to 1. To map the location of the environmentally induced leaf color polymorphisms, we used composite interval mapping implemented with Haley-Knott regression using the CIM command in R/qtl (Broman et al., 2003), a module of the statistical software R (v. 2.12; www.r-project.org). All traits were analyzed with six covariate markers and a window size of 15 cM. For establishing alpha = 0.05 significant thresholds, the data were permuted 1000 times per each trait in each experiment. The data for these analyses can be found in Appendix S1 (see Supplemental Data with the online version of this article).
Within population variation in leaf blotching
Previously, Griffiths and Ganders (1983) documented natural variation in leaf blotching on the abaxial side of leaves in a population of M. guttatus growing in an exposed serpentine community at Anacortes Washington Park (AWP) along the Puget Sound of Washington state. To determine whether the segregating leaf blotching polymorphism is associated with the PLA1 locus, we conducted a single marker analysis association study with lines collected from the AWP population. This single-marker analysis is not whole genome QTL mapping. Instead, the goal is to use genotypes from markers in the vicinity of the PLA1 locus to ask whether PLA1 is associated with a particular trait of interest.
For the single-marker association analysis, seeds from 10 families collected from AWP were germinated and then screened for abaxial leaf blotching. Plants with blotched leaves were self-fertilized, and progeny were grown from each of these families under 16-h days in the Duke University greenhouses. We identified two families that contained plants with and without blotched leaves, as would be predicted if the parent was heterozygous at the color blotch locus. For one of these families, we phenotyped 66 plants for presence (1) and absence (0) of leaf blotching and collected tissue for DNA extractions. All DNA extractions in this study were conducted using a modified CTAB extraction protocol (Kelly and Willis, 1998). Each individual was then genotyped at locus MgSTS173, which is a polymorphic marker located on scaffold 11 of the M. guttatus genome v. 2.0 (Fig. 2). A likelihood-ratio χ2 test was conducted to determine whether there was an association of genotype at MgSTS173 with the binary leaf blotch polymorphism. MgSTS markers are the same EPIC markers used for the creation of the RIL map as described in the previous section.
Fig. 2.
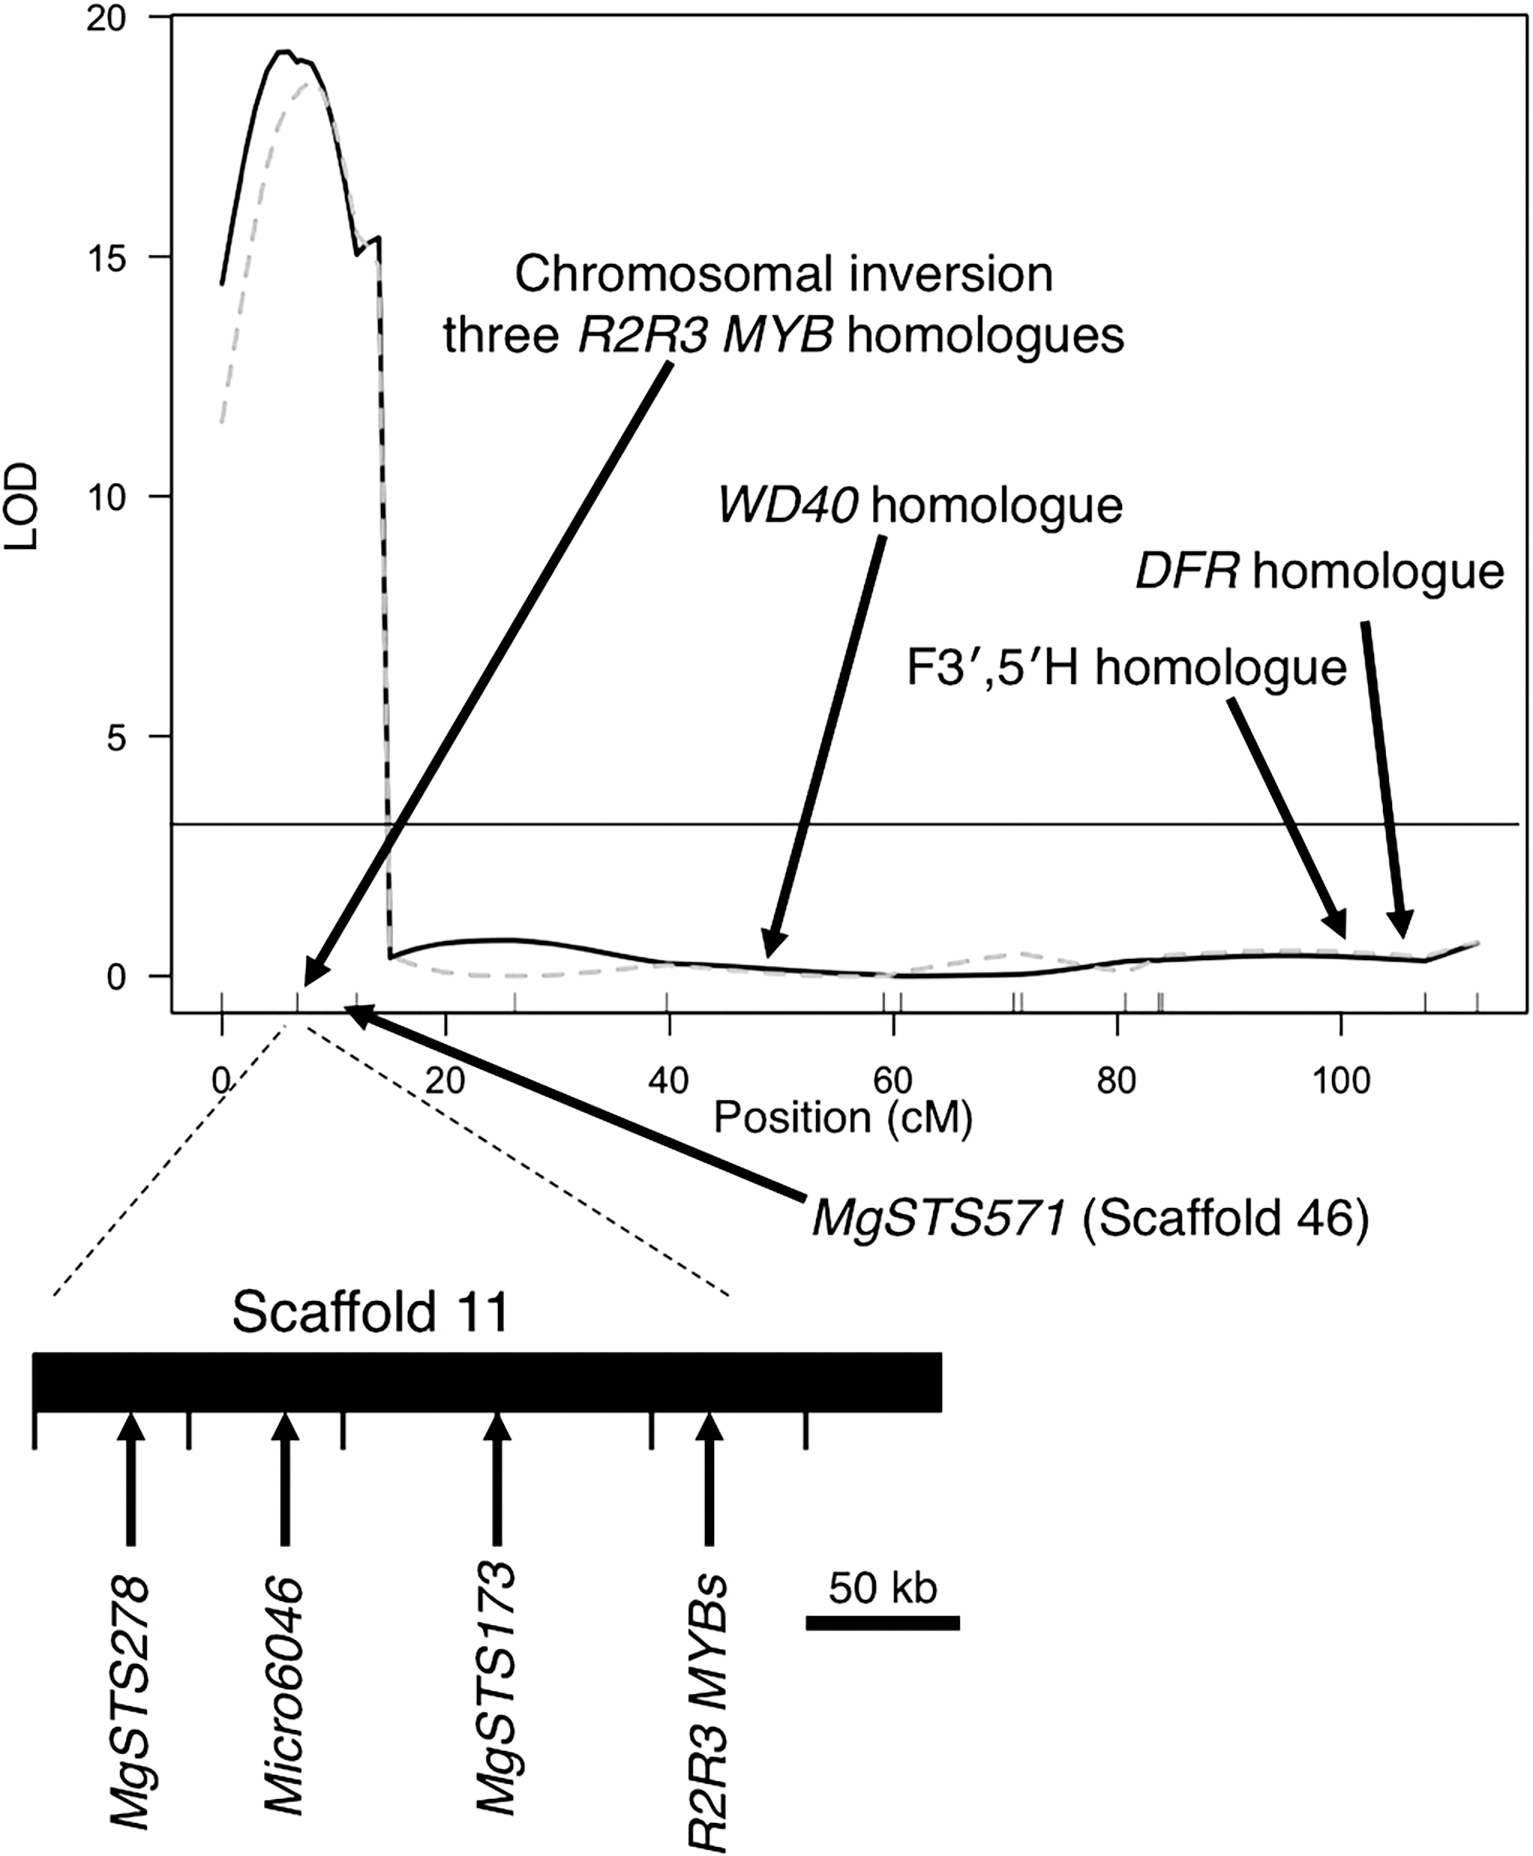
Quantitative trait locus map of chromosome 8 with LOD scores for adaxial leaf coloration in 8-h days (solid) and abaxial coloration in 18-h days (dashed) mapped in the DUN × IM recombinant inbred lines. Locations of anthocyanin candidate genes and the chromosomal inversion are marked on the map. Below the map is the location of markers and R2R3-MYB genes on scaffold 11 inside of the inversion in the orientation of an annual population. MgSTS571 is located on scaffold 46 outside of the inversion.
Among population variation in calyx spotting
To determine whether the calyx spot polymorphism (Fig. 1d) is associated with the PLA1 locus, we crossed an inbred line from an inland annual population (LMC) to an inbred line from a coastal perennial population (SWB). All plants from the LMC population are spotted, while all plants from the SWB population lack spots. A total of 153 F2 individuals of the LMC × SWB cross were grown in the Duke University greenhouse under 18-h days. The F2’s were scored for the presence (1) or absence (0) of calyx spots 10 d after flowering. The F2’s were then genotyped with Micro6046, which is a polymorphic microsatellite marker between LMC and SWB located on scaffold 11 (Fig. 2). Micro6046 should be completely genetically linked to the three MYB arrays because both are located within the chromosomal inversion and LMC and SWB have opposite orientation of the inversion (Lowry and Willis, 2010). We conducted single-marker association analysis between Micro6046 and the bionomial calyx spotting trait with a likelihood-ratio χ2 test.
To set a boundary on the genetic position for control of calyx spotting, we crossed LMC to IM (the RIL parent from inland habitat) and selfed an F1 hybrid to create the F2 generation. IM was used instead of SWB because it has the same orientation of the chromosomal inversion as LMC (Lowry et al., 2009; Lowry and Willis, 2010). We selfed the F1 to produce an F2 generation and grew these F2’s in the Duke University greenhouse under 18-h days. We then screened the F2’s for recombination events between the polymorphic markers MgSTS571 and MgSTS278, which flank the tandem R2R3-MYB locus (Fig. 2). To confirm that the calyx-spotting locus is between those two markers, we tested progeny by scoring calyx phenotypes in progeny families of recombinant individuals.
Red corolla banding polymorphism
Banding at the distal end of the corolla tube (Fig. 1f) is also a widely distributed polymorphism in M. guttatus. To determine whether there is an association of red corolla banding with PLA1 88 F2 plants were selected and scored for presence/absence of calyx spotting and corolla banding in the IM × LMC F2 mapping population. The IM parent (IM62) had red corolla banding, while the LMC parent did not. These F2’s were then genotyped at MgSTS278 and MgSTS571 and single-marker likelihood-ratio χ2 tests were conducted as described already.
Location of anthocyanin genes in Mimulus genome
To determine whether other candidate anthocyanin genes could underlie the pigmentation patterns controlled associated with the PLA1 locus, we conducted tBLASTx searches to identify the genomic location of homologues of known anthocyanin structural and regulatory genes. Searches were conducted with the Mimulus genome v2.0 (http://www.mimulusevolution.org) to identify the chromosome location of each gene.
Geographic distribution of calyx spotting
There has been extensive debate over the adaptive role of anthocyanin polymorphisms (Chalker-Scott, 2002; Gould, 2004; Umbach et al., 2009; Jaakola and Hohtola, 2010). If a particular trait is locally adaptive to particular environmental conditions its geographic distribution should be nonrandomly spread across the distribution of a species, such that its presence is correlated with a set of environmental variables. In this study, we focused on the geographic distribution of calyx spotting because it can be easily scored, and unlike many other anthocyanin polymorphisms, it is robust to environmental perturbation.
To determine the spatial distribution of calyx spotting, we grew (16-h days) and scored calyx spotting on one plant from multiple populations of the Duke University M. guttatus collections. Populations were collected from over the entirety of western North America from Mexico in the south to southeastern Alaska in the north and as far to the east as the front range of the Rocky Mountains in Colorado. Plants were scored for the presence or absence of calyx spots. Our samples grown in the growth chamber were heavily biased toward the Pacific States (California, Oregon, Washington) and British Columbia. To broaden sampling of the distribution of calyx spotting, we also examined the Mimulus collections at the California Academy of Science in San Francisco. To determine the location of populations from herbarium vouchers, as well as samples without GPS coordinates from Duke, we used key word searches and the link function with Google Maps (http://www.maps.google.com).
To test whether calyx spotting occurred spatially at random or whether its occurrence was spatially autocorrelated, we used a Moran’s I test. We then tested whether the spatial pattern in calyx spotting was associated with environmental variables. Ecoregion data were obtained from the Commission for Environmental Cooperation (Level I, CEC, 1997). We tested whether spatial patterning was independent of ecoregion, using a Fisher’s exact test, because occurrences were few in some ecoregions. We also tested whether calyx spotting was independent of whether plants were found within 100 km of the coast, using a χ2 test. Climate data were obtained from two global sources: WorldClim at 30″ (Hijmans et al., 2005) and Climate Research Unit (CRU) at 10′ resolutions. WorldClim data included mean monthly minimum, mean, and maximum temperatures as well as mean monthly precipitation. Furthermore, WorldClim contains derived variables of biological importance. The CRU data were used to estimate vapor pressure deficit (VPD). The VPD is the difference between water vapor partial pressure and maximum potential pressure at a given air temperature and reflects evaporative demand on plants (Johnson and Ferrell, 1983). We calculated the principal components (PC) of altitude and climate variables and took the first five axes, which cumulatively explained 95% of climate variation among plants. We tested whether PCs were significantly different between plants with vs. without calyx spotting, using nonparameteric Wilcoxon signed-rank tests. We also tested whether each of the 80 climate variables included were significantly different between plants with vs. without calyx spotting. All geographic information system (GIS) calculations were done with the program ArcGIS 10 (Esri, Redlands, California, USA).
RESULTS
Variation in leaf color pattern across environmental conditions
We determined the genetic architecture of leaf color polymorphism across different day length conditions using previously genotyped RILs. Under 18-h days, there were 52 RILs (31%) where all replicates produced red abaxial leaf coloration. For 62 (37%) RILs, none of replicates produced abaxial coloration. A total of 53 RILs (32%) were polymorphic and thus included a mix of replicates with and without abaxial coloration.
Under 8-h days, there were 37 (23%) RILs where all replicates produced adaxial leaf coloration. For 83 RILs (51%), none of the replicates produced adaxial coloration. For 44 of the RILs (27%), there was a mix of replicates with and without adaxial coloration. There was a strong negative relationship between abaxial leaf coloration under 18-h days vs. adaxial leaf coloration under 8-h days (R2 = 0.24, F1,157 = 49.87, P < 0.0001).
We mapped only one large significant QTL for leaf coloration in both 8- and 18-h days. The significance threshold for adaxial coloration in 8-h days was LOD = 4.09 and for abaxial coloration in 18-h days was LOD = 4.10. Both the abaxial and adaxial QTLs colocalized on linkage group eight with the peaks centered at the location of the previously identified chromosomal inversion (Fig. 2). We detected no other significant QTLs. Interestingly, leaf color in the two conditions was controlled by different alleles at the same locus. In the 8-h condition, adaxial leaf color was associated with the DUN allele, while abaxial leaf color was associated with the IM allele in the 18-h conditions (Fig. 2).
Within population variation in leaf blotching
The single marker analysis revealed a strong association between the leaf blotching polymorphism within the AWP population and the PLA1 locus. Leaf blotching was highly associated with genotype at marker MgSTS173 (χ2 = 27.08, df = 2, P < 0.0001; Table 3). Consistent with Griffiths et al. (1982), leaf blotching was dominant in its action, as 87.5% of heterozygotes at MgSTS173 had blotched leaves. While this was a strong association, it was not perfect because 9 of 66 (13.6%) individuals did not have phenotypes that matched the expectation of a single dominant Mendelian locus.
Table 3.
Single marker analysis to test the association of PLA1 and three anthocyanin polymorphisms with a likelihood-ratio χ2 test.
| Polymorphism | Cross | Marker | N | χ2 |
|---|---|---|---|---|
|
| ||||
| Abaxial leaf blotching | Within AWP | MgSTS173 | 66 | 27.08*** |
| Calyx spotting | LMC × SWB | Micro6046 | 107 | 78.22*** |
| Calyx spotting | LMC × IM | MgSTS278 | 88 | 47.18*** |
| Calyx spotting | LMC × IM | MgSTS571 | 88 | 53.58*** |
| Corolla tube band | LMC × IM | MgSTS278 | 88 | 80.78*** |
| Corolla tube band | LMC × IM | MgSTS571 | 88 | 47.01*** |
Notes:
P < 0.05
P < 0.01
P < 0.001
Among population variation in calyx spotting
Single-marker analysis established that calyx spotting in the LMC × SWB cross is also associated with PLA1. Overall, 107 (70%) of the F2’s had calyx spotting, while 46 (30%) had no spotting. There was a very strong association between calyx spotting and Micro6046 (χ2 = 78.22, df = 2, P < 0.0001, Table 3). These results are consistent with Griffiths and Ganders (1983) in that a single dominant locus controls the calyx spotting polymorphism. However, there was not a perfect association between this locus and color spotting in that 21 (13.7%) had genotypes that were discordant with their phenotype. Our progeny testing of the IM × LMC cross established that the calyx spotting locus maps between the markers MgSTS571 and MgSTS278.
Red corolla banding polymorphism
In the IM × LMC F2 mapping population, genetic analysis revealed that calyx spotting and red corolla banding are associated with alternative alleles linked to PLA1 (Table 3). Calyx spotting was under dominant control of the LMC allele (MgSTS278, χ2 = 47.18, df = 2, P < 0.0001), while red corolla banding is under dominant control of the IM allele (MgSTS278, χ2 = 80.78, df = 2, P < 0.0001). Only individuals heterozygous at PLA1 expressed both calyx spotting and red corolla banding phenotypes. Heterozygous individuals were defined as plants containing both LMC and IM alleles at MgSTS278 and/or MgSTS571.
Location of anthocyanin genes in Mimulus genome
Every homologue of anthocyanin structural genes are located on chromosomes other than 8, except for dihydroflavonol 4-reductase (DFR) and a homologue of F3′,5′H, which are both located at the opposite end of chromosome 8 from the three R2R3-MYB arrays (Fig. 2; Table 4). The homologue of DFR has been made into a marker that has been confirmed to segregate independently (100.77 cM) of the chromosomal inversion in the DUN × IM RIL mapping population (Lowry et al., 2009). It should be noted that we cannot rule out one homologue of the F3′H or F3′,5′H as being located on chromosome 8 because it blasts to a small sequence scaffold (1476), which has not yet been mapped to a chromosome.
Table 4.
Chromosomal location of non-MYB candidate anthocyanin genes in the genome of Mimulus guttatus based on tBLASTx searches.
| Gene | Chromosome | Location | E-value | Species |
|---|---|---|---|---|
|
| ||||
| DFR | 8 | 24776552 | 4.00E-113 | Arabidopsis thaliana |
| CHS | 7 | 4164533 | 0.00E+00 | Arabidopsis thaliana |
| CHI | 4 | 708243 | 3.00E-79 | Arabidopsis thaliana |
| CHI | 12 | 12768174 | 1.00E-71 | Arabidopsis thaliana |
| CHI | 10 | 2853951 | 3.00E-67 | Arabidopsis thaliana |
| ANS | 5 | 12488615 | 2.00E-170 | Arabidopsis thaliana |
| F3H | 14 | 25228267 | 5.00E-169 | Arabidopsis thaliana |
| F3H | 3 | 15914369 | 3.00E-165 | Arabidopsis thaliana |
| F3′H | 1476 a | 3330 | 2.00E-144 | Ipomoea purpurea |
| F3′H | 4 | 14367934 | 8.00E-172 | Ipomoea purpurea |
| F3′,5′H | 8 | 24118026 | 4.00E-98 | Vinca major |
| F3′,5′H | 1476 a | 3345 | 3.00E-93 | Vinca major |
| F3′,5′H | 4 | 14367943 | 5.00E-113 | Vinca major |
| WD40 | 8 | 15650422 | 0.00E+00 | Arabidopsis thaliana |
| WD40 | 13 | 20494216 | 0.00E+00 | Arabidopsis thaliana |
| WD40 | 6 | 670553 | 2.00E-120 | Arabidopsis thaliana |
| bHLH | 4 | 1299979 | 2.00E-55 | Mimulus aurantiacus |
| bHLH | 5 | 13522474 | 4.00E-31 | Mimulus aurantiacus |
Chromosome location of this homologue of F3′H or F3′,5′H is unknown because scaffold 1476 has yet to be mapped to a chromosome.
Other potential regulatory genes that interact with R2R3-MYB genes to control anthocyanin production are bHLH- and WD40-type genes. Homologues of anthocyanin bHLH genes were all located on chromosomes other than eight. One anthocyanin WD40 type was found on chromosome 8 (Fig. 2). This WD40 gene was located on scaffold 12 between the markers MgSTS288 and MgSTS381. Those markers are located at 33.01 cM and 52.42 cM, respectively, from the chromosomal inversion in the DUN × IM RIL mapping population (Lowry et al., 2009).
Geographic distribution of calyx spotting
Overall, we scored the presence or absence of calyx spotting in 155 accessions from the Duke University seed stock center and 200 vouchers from the California Academy herbarium collections. Calyx spotting is a widespread polymorphism found throughout much of the range of the M. guttatus species complex, occurring in 27% of the population accessions surveyed (Fig. 3). Spatial distribution of calyx spotting was significantly spatially autocorrelated (Moran’s I = 0.11, P < 10−12). Spotting was more common in plants from within 100 km of the coast (χ2 = 6.04, df = 1, P = 0.01). Spotting also occurred nonrandomly with respect to ecoregion (Fisher’s exact test, P < 10−4). Among the ecoregions with a large number of collections (>55), mediterranean California and the North American desert ecoregions differed most with respect to proportion of plants with spotting, 41% compared to 14%, respectively. Plants with vs. without spots had significantly different climates along the second (Wilcoxon test, W = 7378, P < 10−4) and third PC (Wilcoxon test, W = 13 025, P < 10−4; Fig. 4) but not for other PC (α = 0.05). Plants with spotting had higher values for the second PC, which was positively correlated to winter precipitation, wet precipitation extremes, and negatively correlated to annual temperature variability (explaining 26% of climate variation). Plants with spotting had lower values along the third PC, which was positively correlated to summer precipitation and negatively correlated to precipitation and temperature variability (explaining 7% of climate variation). Among individual climate variables, over half (41/80) were significantly different among plants with vs. without spotting. The two climate variables that differed most according to spotting were the variability (CV) of monthly precipitation (Wilcoxon test, W = 6751.5, P < 10−6; Fig. 3), which was greater among plants with spotting and negatively correlated to PC3, and temperature annual range (Wilcoxon test, W = 13133.5, P < 10−5), which was lower among plants with spotting and negatively correlated to PC2.
Fig. 3.
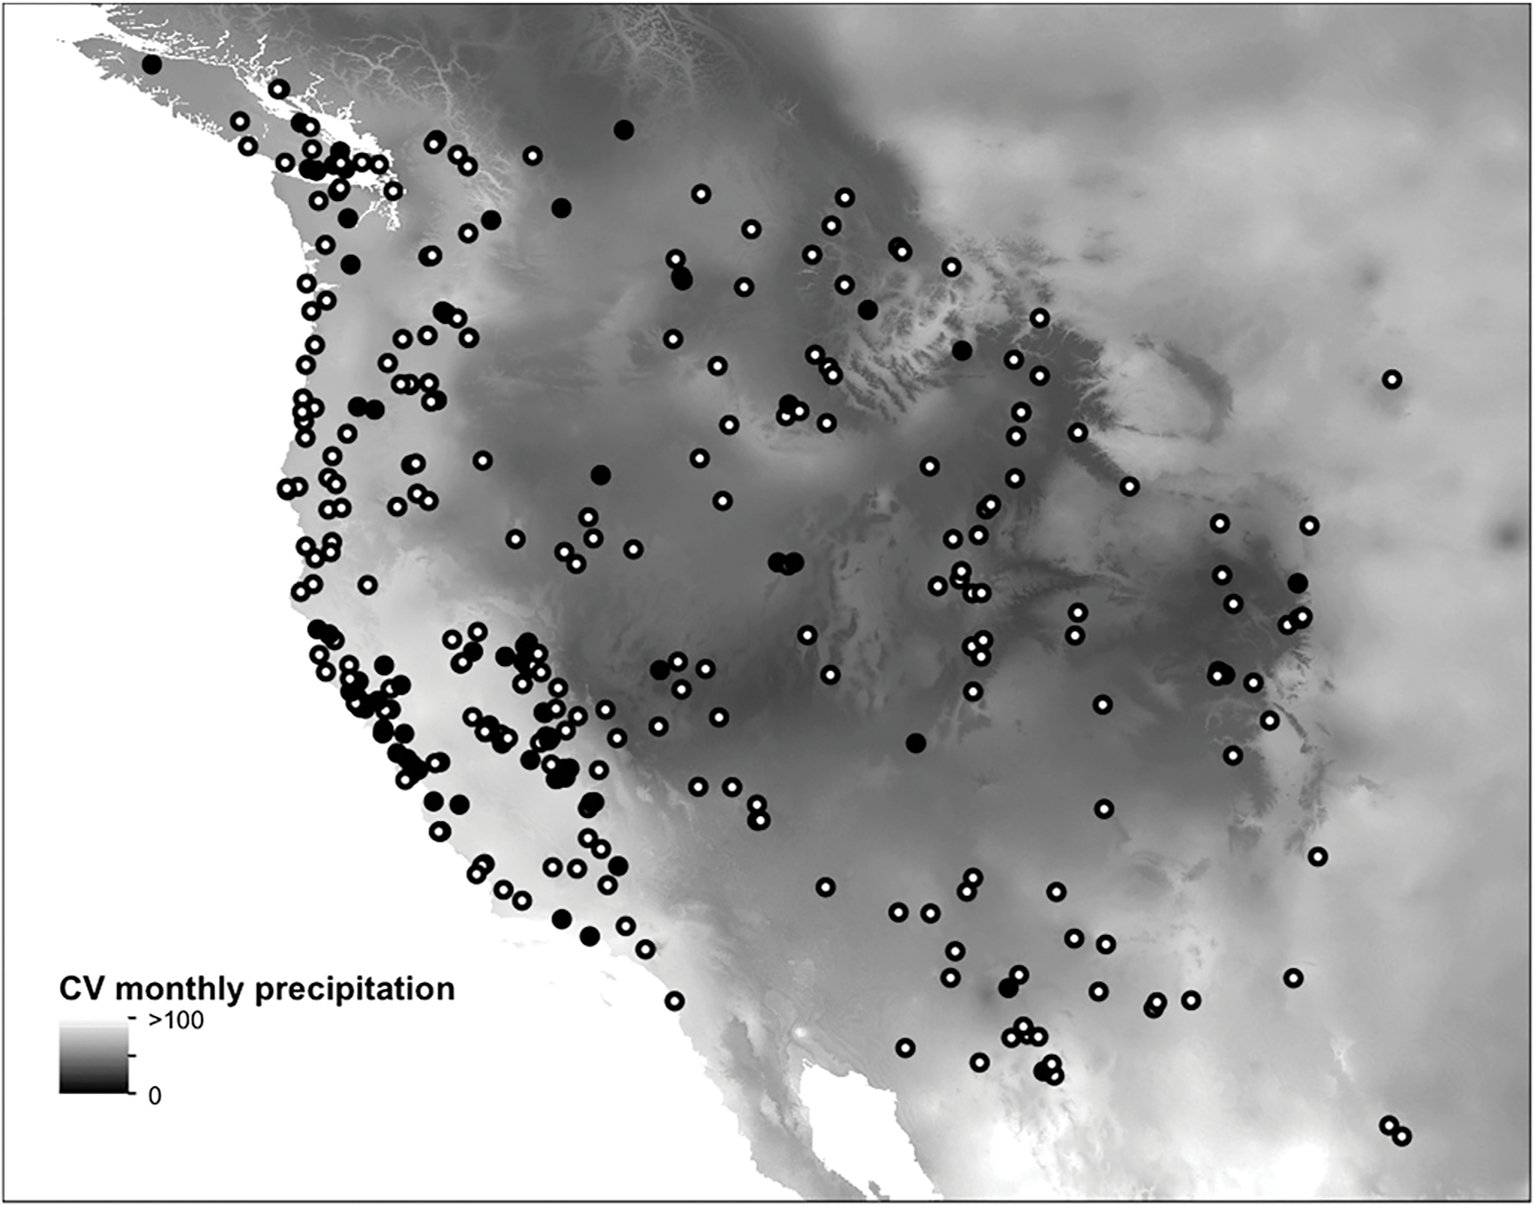
The distribution of calyx anthocyanin spotting across western North America compared to intra-annual variability (CV) of monthly precipitation, which was the climate variable most strongly differentiated among spotted (black circles) vs. nonspotted plants (white circles). Eight accessions from Canada and Alaska are not shown.
Fig. 4.

The distribution of climate conditions for spotted (shaded boxes) vs. nonspotted (white boxes) calyx plants. PC2 and PC3 were the only principal components of climate that differed significantly between spotted vs. nonspotted plants. The two climate variables with the strongest differentiation between spotted and nonspotted plants, variability (CV) in monthly precipitation and temperature annual range, are also shown.
DISCUSSION
Overall, this study has contributed to a more detailed understanding of causes and distribution of anthocyanin phenotypic variation in M. guttatus. In our study, unlike most other studies of anthocyanins, we examined the genetic basis of both floral and vegetative variation (but see Albert et al., 2011). All three vegetative anthocyanin polymorphisms and two floral polymorphisms are controlled primarily by the same major locus, PLA1, and in all cases the presence of the anthocyanin phenotype is dominant. This variation is distributed within and among populations, and for at least two phenotypes, PLA1 mediates genotype × environment interactions for anthocyanin production. The cluster of three R2R3-MYB genes in the PLA1 region is likely to be involved in the evolution of natural variation in these traits, which is consistent with prevailing theory on the evolution of the anthocyanin production pathway. Finally, calyx spotting was correlated with multiple climate variables, thus generating hypotheses for future inquiry to determine the evolutionary causes of maintenance of this widespread polymorphism.
The genetic architecture of anthocyanin polymorphisms
While our study provides strong evidence for a major role of the PLA1 locus in the evolution of the anthocyanin polymorphisms, there was not always a perfect association of markers and traits in our study. Possible reasons for this imperfect association include effects of modifier loci, incomplete penetrance, residual heterozygosity (in the case of the RILs), genotyping error, phenotyping error, and/or recombination between the causative gene and the polymorphic marker. Regardless, a gene or genes in the region of PLA1 controls a major component of variation in all five of the M. guttatus traits as well as petal lobe pigmentation in M. cupreus (Cooley et al., 2011).
But why does a single locus control variation in so many traits? Probably the best explanation is that the simple genetic architecture of the anthocyanin traits contrast with the complex inheritance of most naturally varying traits in Mimulus (Fishman et al., 2002; Hall et al., 2006; Lowry et al., 2009). This genetic architecture is likely a result of the very simple metabolic pathway that underlies anthocyanin production (Rausher, 2008). With so few genes involved in anthocyanin production, the genome-wide mutational target size to change anthocyanin traits is relatively small compared with other traits. The target size may be further limited if mutations cause deleterious pleiotropy (Brakefield, 2006; Kalisz and Kramer, 2008), as appears to be the case for many of the genes in the anthocyanin pathway (Coberly and Rausher, 2008; Streisfeld and Rausher, 2011). Of the three types of anthocyanin regulatory genes (WD40, bHLH, MYB), mutations in R2R3-MYB genes are expected to incur the least pleiotropic effects and thus are predicted to be involved in tissue-specific phenotypic evolution more often (Schwinn et al., 2006; Espley et al., 2007; Stracke et al., 2007; Gonzalez et al., 2008; Streisfeld and Rausher, 2011).
Candidate anthocyanin genes
Functional mutations within the coding region of the six structural genes in the anthocyanin pathway are typically highly pleiotropic and lead to plant-wide effects on anthocyanin production (Zufall and Rausher, 2004; Streisfeld and Rausher, 2009; Martin et al., 2010). The traits examined in this study were all restricted to specific regions of plant structures and thus do not fit the predictions of coding mutations in a structural gene. Such specific distributions of pigmentation could be the result of cis-regulatory mutations in structural genes that lead to expression in particular plant modules (Wray, 2007; Kalisz and Kramer, 2008; Stern and Orgogozo, 2008). Alternatively, the specific pattern of expression could be due to mutations in regulatory genes that control the anthocyanin pathway (Hoekstra and Coyne, 2007; Rausher, 2008).
From our scan of the Mimulus guttatus genome, we can rule out most candidate anthocyanin genes as being involved in control of the five phenotypes examined in this study simply because they are located on other chromosomes. The WD40 transcription factor on the middle of chromosome 8 can also be ruled out for the calyx spot phenotype because it is outside of the flanking markers. This gene also maps far from the QTL peak for adaxial and abaxial phenotypes (Fig. 2). The three tandemly arrayed R2R3-MYB genes located within the chromosomal inversion are thus the strongest candidates for controlling the anthocyanin phenotypes. R2R3-MYB transcription factors are known to be involved in natural variation in a wide array of plant anthocyanin traits across many species (Kobayashi et al., 2002; Schwinn et al., 2006; Espley et al., 2007; Rausher, 2008; Albert et al., 2011; Hopkins and Rausher, 2011) and are preferentially involved in the evolution of the intensity of floral anthocyanin pigmentation (Streisfeld and Rausher, 2011). Future functional analysis should be conducted to determine whether these R2R3-MYB transcription factors or some other genes are responsible for natural variation in the five anthocyanin polymorphisms.
Demonstration that the R2R3-MYB genes are involved in the evolution of the five anthocyanin phenotypes would be particularly interesting as these genes are located within a geographically widespread adaptive chromosomal inversion (Lowry and Willis, 2010). Few genes have been identified within chromosomal inversions that are involved in the evolution of adaptive phenotypes (Hoffmann and Rieseberg, 2008), even though such identification would be very important for distinguishing between different theoretical models for the evolution of inversions (Kirkpatrick, 2010).
The function of anthocyanin traits and geographic distribution of variation
Ascribing ecological function to anthocyanin traits is a difficult endeavor and the role of vegetative anthocyanins has been contentious in the literature (Chalker-Scott, 2002; Gould, 2004). Vegetative anthocyanin traits are thought to be involved in the tolerance of a suite of plant stresses (Chalker-Scott, 2002; Gould, 2004; Umbach et al., 2009; Jaakola and Hohtola, 2010). Many of these traits are quickly inducible, which has been suggested as a mechanism of coping with fluctuating environmental conditions without incurring a constitutive physiological cost (Chalker-Scott, 2002). Even for flower color, where pollinator preferences are usually thought to drive pigmentation evolution, other environmental factors may often be the ultimate cause of trait evolution (Strauss and Whittall, 2006; Rausher, 2008). For example, flower color differences in Linanthus parryae appear to be the result of local adaptation to differing soil substrates (Schemske and Bierzychudek, 2001, 2007).
Griffiths and Ganders (1983) documented that various anthocyanin leaf coloration polymorphisms are distributed widely within and among populations of M. guttatus, but they did not find any geographic pattern of the distribution of these phenotypes that might suggest an adaptive role. In this study, we found that calyx spotting has a nonrandom distribution, with the highest densities of spotting found in regions with the most monthly variability in annual rainfall (Fig. 3). Accordingly, calyx spotting was most common in the mediterranean regions of California. In the field, we have most commonly observed calyx spotting in populations that dry out quickly due to the onset of summer drought in California (D. B. Lowry, personal observation). Whether the climate correlations are indicative of an adaptive role for calyx spotting, such as drought tolerance, cannot be determined with the data from this study. However, knowledge of the simple genetic architecture underlying this trait will help to determine whether it is adaptive. An alternative to an adaptive role for calyx spotting is that its nonrandom distribution is due solely to genetic drift processes, such as stochasticity during a demographic expansion (e.g., Klopfstein et al., 2006). Further, calyx spotting might have no fitness effects, but its distribution could be driven by linkage to an adaptive locus, such as the known adaptive chromosomal inversion within which the PLA1 is contained (Lowry and Willis 2010). To resolve these alternative hypotheses, future studies should aim to determine whether the anthocyanin traits examined in M. guttatus have adaptive ecophysiological functions.
Supplementary Material
Acknowledgments
The authors thank the many members of the Willis and Juenger laboratories and L. Bukovnik, B. Calhoun, A. Cooley, R. Haley, R. Hopkins, T. Juenger, E. Lacey, D. Des Marais, J. Mays, W. Morris, M. Noor, M. Rausher, M. Streisfeld, D. Trock, G. Wray, K. Wright, Z. Zhu, and two anonymous reviewers. The authors also thank the good folks at the California Academy of the Sciences, the Duke University greenhouses, and Anacortes Washington Park. Funding was provided by the National Science Foundation, through a FIBR Grant (EF-0328636), an Environmental Genomics Grant (EF-0723814), and a Doctoral Dissertation Improvement Grant (DEB-0710094). A National Institutes of Health Graduate Student Fellowship and a Duke University Travel Grant also provided funding.
LITERATURE CITED
- ALBERT NW, LEWIS DH, ZHANG H, SCHWINN KE, JAMESON PE, AND DAVIES KM. 2011. Members of an R2R3-MYB transcription factor family in Petunia are developmentally and environmentally regulated to control complex floral and vegetative pigmentation patterning. Plant Journal 65: 771–784. [DOI] [PubMed] [Google Scholar]
- ANDERSON JT, WILLIS JH, AND MITCHELL-OLDS T. 2011. Evolutionary genetics of plant adaptation. Trends in Genetics 27: 258–266. [DOI] [PMC free article] [PubMed] [Google Scholar]
- BRAKEFIELD PM 2006. Evo-devo and constraints on selection. Trends in Ecology & Evolution 21: 362–368. [DOI] [PubMed] [Google Scholar]
- BRIGGS D, AND WALTERS SM. 1997. Plant variation and evolution, 3rd ed. Cambridge University Press, Cambridge, UK. [Google Scholar]
- BROMAN KW, WU H, SEN S, AND CHURCHILL GA. 2003. R/qtl: QTL mapping in experimental crosses. Bioinformatics 19: 889–890. [DOI] [PubMed] [Google Scholar]
- CEC [COMMISSION FOR ENVIRONMENTAL COOPERATION]. 1997. Ecological regions of North America. CEC, Montreal, Quebec, Canada. [Google Scholar]
- CHALKER-SCOTT L 2002. Do anthocyanins function as osmoregulators in leaf tissues? Advances in Botanical Research 37: 103–127. [Google Scholar]
- CLAUSEN J, KECK DD, AND HIESEY WH. 1940. Experimental studies on the nature of species. I. Effects of varied environments on western North American plants. Carnegie Institution of Washington, Washington D.C., USA. [Google Scholar]
- COBERLY LC, AND RAUSHER MD. 2008. Pleiotropic effects of an allele producing white flowers in Ipomoea purpurea. Evolution 62: 1076–1085. [DOI] [PubMed] [Google Scholar]
- COOLEY AM, CARVALLO G, AND WILLIS JH. 2008. Is floral diversification associated with pollinator divergence? Flower shape, flower colour and pollinator preference in Chilean Mimulus. Annals of Botany 101: 641–650. [DOI] [PMC free article] [PubMed] [Google Scholar]
- COOLEY AM, MODLISZEWSKI JL, ROMMEL ML, AND WILLIS JH. 2011. Gene duplication in Mimulus underlies parallel floral evolution via independent trans-regulatory changes. Current Biology 21: 700–704. [DOI] [PubMed] [Google Scholar]
- COOLEY AM, AND WILLIS JH. 2009. Genetic divergence causes parallel evolution of flower color in Chilean Mimulus. The New Phytologist 183: 729–739. [DOI] [PubMed] [Google Scholar]
- DES MARAIS DL, AND RAUSHER MD. 2008. Escape from adaptive conflict after duplication in an anthocyanin pathway gene. Nature 454: 762–765. [DOI] [PubMed] [Google Scholar]
- ESPLEY RV, HELLENS RP, PUTTERILL J, STEVENSON DE, KUTTY-AMMA S, AND ALLAN AC. 2007. Red colouration in apple fruit is due to the activity of the MYB transcription factor, MdMYB10. Plant Journal 49: 414–427. [DOI] [PMC free article] [PubMed] [Google Scholar]
- FEDER ME, AND MITCHELL-OLDS T. 2003. Evolutionary and ecological functional genomics. Nature Reviews Genetics 4: 651–657. [DOI] [PubMed] [Google Scholar]
- FISHMAN L, KELLY AJ, AND WILLIS JH. 2002. Minor quantitative trait loci underlie floral traits associated with mating system divergence in Mimulus. Evolution 56: 2138–2155. [DOI] [PubMed] [Google Scholar]
- GANDERS FR, GRIFFITHS AJF, AND CAREY K. 1980. Natural selection for spotted leaves: parallel morph ratio variation in three species of annual plants. Canadian Journal of Botany 58: 689–693. [Google Scholar]
- GONZALEZ A, ZHAO M, LEAVITT JM, AND Lloyd AM. 2008. Regulation of the anthocyanin biosynthetic pathway by the TTG1/bHLH/Myb transcriptional complex in Arabidopsis seedlings. Plant Journal 53: 814–827. [DOI] [PubMed] [Google Scholar]
- GOULD KS 2004. Nature’s Swiss army knife: The diverse protective roles of anthocyanins in leaves. Journal of Biomedicine & Biotechnology 5: 314–320. [DOI] [PMC free article] [PubMed] [Google Scholar]
- GRANT V 1981. Plant speciation, 2nd ed. Columbia University Press, New York, New York, USA. [Google Scholar]
- GRIFFITHS AJF, CAREY K, AND GANDERS FR. 1982. Anthocyanin polymorphisms in Mimulus guttatus. Canadian Journal of Botany 60: 1625–1628. [Google Scholar]
- GRIFFITHS AJF, AND GANDERS FR. 1983. Wildflower genetics: A field guide for British Columbia and the Pacific. Flight Press, Vancouver, British Columbia, Canada. [Google Scholar]
- HALL MC, BASTEN CJ, AND WILLIS JH. 2006. Pleiotropic quantitative trait loci contribute to population divergence in traits associated with life-history variation in Mimulus guttatus. Genetics 172: 1829–1844. [DOI] [PMC free article] [PubMed] [Google Scholar]
- HALL MC, AND WILLIS JH. 2006. Divergent selection on flowering time contributes to local adaptation in Mimulus guttatus populations. Evolution 60: 2466–2477. [PubMed] [Google Scholar]
- HANCOCK AM, BRACHI B, FAURE N, HOURTON MW, JARYMOWYCZ LB, SPERONE FG, TOOMAJIAN C, ROUX F, AND BERGELSON J. 2011. Adaptation to climate across the Arabidopsis thaliana genome. Science 334: 83–86. [DOI] [PubMed] [Google Scholar]
- HIJMANS RJ, CAMERON SE, PARRA JL, JONES PG, AND JARVIS A. 2005. Very high resolution interpolated climate surfaces for global land areas. International Journal of Climatology 25: 1965–1978. [Google Scholar]
- HOBALLAH ME, GUBITZ T, STUURMAN J, BROGER L, BARONE M, MANDEL M, DELL’OLIVO A, et al. 2007. Single gene-mediated shift in pollinator attraction in Petunia. Plant Cell 19: 779–790. [DOI] [PMC free article] [PubMed] [Google Scholar]
- HOEKSTRA HE, AND COYNE JA. 2007. The locus of evolution: Evo devo and the genetics of adaptation. Evolution 61: 995–1016. [DOI] [PubMed] [Google Scholar]
- HOFFMANN AA, AND RIESEBERG LH. 2008. Revisiting the impact of inversions in evolution: From population genetic markers to drivers of adaptive shifts and speciation? Annual Review of Ecology Evolution and Systematics 39: 21–42. [DOI] [PMC free article] [PubMed] [Google Scholar]
- HOPKINS R, AND RAUSHER MD. 2011. Identification of two genes causing reinforcement in the Texas wildflower Phlox drummondii. Nature 469: 411–414. [DOI] [PubMed] [Google Scholar]
- JAAKOLA L, AND HOHTOLA A. 2010. Effect of latitude on flavonoid biosynthesis in plants. Plant, Cell & Environment 33: 1239–1247. [DOI] [PubMed] [Google Scholar]
- JOHNSON JD, AND FERRELL WK. 1983. Stomatal response to vapour pressure deficit and the effect of plant water stress. Plant, Cell & Environment 6: 451–456. [Google Scholar]
- KALISZ S, AND KRAMER EM. 2008. Variation and constraint in plant evolution and development. Heredity 100: 171–177. [DOI] [PubMed] [Google Scholar]
- KELLY AJ, AND WILLIS JH. 1998. Polymorphic microsatellite loci in Mimulus guttatus and related species. Molecular Ecology Notes 7: 769–774. [Google Scholar]
- KIRKPATRICK M 2010. How and why chromosome inversions evolve. PLoS Biology 8: e1000501. [DOI] [PMC free article] [PubMed] [Google Scholar]
- KLOPFSTEIN S, CURRAT M, AND EXCOFFIER L. 2006. The fate of mutations surfing on the wave of a range expansion. Molecular Biology and Evolution 23: 482–490. [DOI] [PubMed] [Google Scholar]
- KOBAYASHI H, SUZUKI S, TANZAWA F, AND TAKAYANAGI T. 2009. Low expression of flavonoid 3′,5′ hydroxylase (F3′,5′H) associated with cyanidin-based anthocyanins in grape leaf. American Journal of Enology and Viticulture 60: 362–367. [Google Scholar]
- KOES R, VERWEIJ W, AND QUATTROCCHIO F. 2005. Flavonoids: A colorful model for the regulation and evolution of biochemical pathways. Trends in Plant Science 10: 236–242. [DOI] [PubMed] [Google Scholar]
- LANDER ES, AND BOTSTEIN D. 1989. Mapping Mendelian factors underlying quantitative traits using RFLP linkage maps. Genetics 121: 185–199. [DOI] [PMC free article] [PubMed] [Google Scholar]
- LOWRY DB, HALL MC, SALT DE, AND WILLIS JH. 2009. Genetic and physiological basis of adaptive salt tolerance divergence between coastal and inland Mimulus guttatus. New Phytologist 183: 776–788. [DOI] [PubMed] [Google Scholar]
- LOWRY DB, AND WILLIS JH. 2010. A widespread chromosomal inversion polymorphism contributes to a major life-history transition, local adaptation, and reproductive isolation. PLoS Biology 8: e1000500. [DOI] [PMC free article] [PubMed] [Google Scholar]
- MARTIN C, ELLIS N, AND ROOK F. 2010. Do transcription factors play special roles in adaptive variation? Plant Physiology 154: 506–511. [DOI] [PMC free article] [PubMed] [Google Scholar]
- MITCHELL-OLDS T, WILLIS JH, AND GOLDSTEIN DB. 2007. Which evolutionary processes influence natural genetic variation for phenotypic traits? Nature Reviews Genetics 8: 845–856. [DOI] [PubMed] [Google Scholar]
- QUATTROCCHIO F, VERWEIJ W, KROON A, SPELT C, MOL J, AND KOES R. 2006. PH4 of Petunia is an R2R3-MYB protein that activates vacuolar acidification through interactions with basic-helix-loop-helix transcription factors of the anthocyanin pathway. Plant Cell 18: 1274–1291. [DOI] [PMC free article] [PubMed] [Google Scholar]
- RAUSHER MD 2008. Evolutionary transitions in floral color. International Journal of Plant Sciences 169: 7–21. [Google Scholar]
- SCHEMSKE DW, AND BIERZYCHUDEK P. 2001. Evolution of flower color in the desert annual Linanthus parryae: Wright revisited. Evolution 55: 1269–1282. [DOI] [PubMed] [Google Scholar]
- SCHEMSKE DW, AND BIERZYCHUDEK P. 2007. Spatial differentiation for flower color in the desert annual Linanthus parryae: Was Wright right? Evolution 61: 2528–2543. [DOI] [PubMed] [Google Scholar]
- SCHWINN K, VENAIL J, SHANG YJ, MACKAY S, ALM V, BUTELLI E, OYAMA R, et al. 2006. A small family of MYB-regulatory genes controls floral pigmentation intensity and patterning in the genus Antirrhinum. The Plant Cell 18: 831–851. [DOI] [PMC free article] [PubMed] [Google Scholar]
- STEBBINS GL 1950. Variation and evolution in plants. Columbia University Press, New York, NY, USA. [Google Scholar]
- STERN DL, AND ORGOGOZO V. 2008. The loci of evolution: How predictable is genetic evolution? Evolution 62: 2155–2177. [DOI] [PMC free article] [PubMed] [Google Scholar]
- STINCHCOMBE JR, AND HOEKSTRA HE. 2008. Combining population genomics and quantitative genetics: finding the genes underlying ecologically important traits. Heredity 100: 158–170. [DOI] [PubMed] [Google Scholar]
- STRACKE R, ISHIHARA H, BARSCH GHA, MEHRTENS F, NIEHAUS K, AND WEISSHAAR B. 2007. Differential regulation of closely related R2R3-MYB transcription factors controls flavonol accumulation in different parts of the Arabidopsis thaliana seedling. The Plant Journal 50: 660–677. [DOI] [PMC free article] [PubMed] [Google Scholar]
- STRAUSS SY, AND WHITTALL JB. 2006. Non-pollinator agents of selection on floral traits. In Harder LD and Barrett SCH [eds.], Ecology and evolution of flowers, 120–138. Oxford University Press, Oxford, UK. [Google Scholar]
- STREISFELD MA, AND RAUSHER MD. 2009. Genetic changes contributing to the parallel evolution of red floral pigmentation among Ipomoea species. New Phytologist 183: 751–763. [DOI] [PubMed] [Google Scholar]
- STREISFELD MA, AND RAUSHER MD. 2011. Population genetics, pleiotropy, and the preferential fixation of mutations during adaptive evolution. Evolution 65: 629–642. [DOI] [PubMed] [Google Scholar]
- TOLENO DM, DURBIN ML, LUNDY KE, AND CLEGG MT. 2010. Extensive evolutionary rate variation in floral color determining genes in the genus Ipomoea. Plant Species Biology 25: 30–42. [Google Scholar]
- TURESSON G 1922. The genotypic response of the plant species to habitat. Hereditas 3: 211–350. [Google Scholar]
- UMBACH AL, LACEY EP, AND RICHTER SJ. 2009. Temperature-sensitive alternative oxidase protein content and its relationship to floral reflectance in natural Plantago lanceolata populations. New Phytologist 181: 662–671. [DOI] [PubMed] [Google Scholar]
- WHITTALL JB, VOELCKEL C, KLIEBENSTEIN DJ, AND HODGES SA. 2006. Convergence, constraint and the role of gene expression during adaptive radiation: floral anthocyanins in Aquilegia. Molecular Ecology 15: 4645–4657. [DOI] [PubMed] [Google Scholar]
- WRAY GA 2007. The evolutionary significance of cis-regulatory mutations. Nature Reviews Genetics 8: 206–216. [DOI] [PubMed] [Google Scholar]
- WU CA, LOWRY DB, COOLEY AM, WRIGHT KM, LEE YW, AND WILLIS JH. 2008. Mimulus is an emerging model system for the integration of ecological and genomic studies. Heredity 100: 220–230. [DOI] [PubMed] [Google Scholar]
- YAMAZAKI M, YUKIKO M, SPRINGOB K, AND SAITO K. 2003. Regulatory mechanisms for anthocyanin biosynthesis in chemotypes of Perilla frutescens var. crispa. Biochemical Engineering Journal 14: 191–197. [Google Scholar]
- ZUFALL RA, AND RAUSHER MD. 2004. Genetic changes associated with floral adaptation restrict future evolutionary potential. Nature 428: 847–850. [DOI] [PubMed] [Google Scholar]
Associated Data
This section collects any data citations, data availability statements, or supplementary materials included in this article.