

Abstract
GM3 synthase (GM3S) deficiency is a rare neurodevelopmental disorder caused by an inability to synthesize gangliosides, for which there is currently no treatment. Gangliosides are brain-enriched, plasma membrane glycosphingolipids with poorly understood biological functions related to cell adhesion, growth, and receptor-mediated signal transduction. Here, we investigated the effects of GM3S deficiency on metabolism and mitochondrial function in a mouse model. By indirect calorimetry, GM3S knockout mice exhibited increased whole-body respiration and an increased reliance upon carbohydrate as an energy source. 18F-FDG PET confirmed higher brain glucose uptake in knockout mice, and GM3S deficient N41 neuronal cells showed higher glucose utilization in vitro. Brain mitochondria from knockout mice respired at a higher rate on Complex I substrates including pyruvate. This appeared to be due to higher expression of pyruvate dehydrogenase (PDH) and lower phosphorylation of PDH, which would favor pyruvate entry into the mitochondrial TCA cycle. Finally, it was observed that blocking glucose metabolism with the glycolysis inhibitor 2-deoxyglucose reduced seizure intensity in GM3S knockout mice following administration of kainate. In conclusion, GM3S deficiency may be associated with a hypermetabolic phenotype that could promote seizure activity.
Keywords: Ganglioside, GM3, glucose metabolism, mitochondria, seizure
1. Introduction
Gangliosides are a poorly understood class of sialic acid-containing glycosphingolipids enriched in the mammalian nervous system. Gangliosides decorate the cell membrane where they are thought to be involved in diverse processes including cell differentiation, cell signaling, and stabilizing axon-myelin interactions [1]. While genetic deficiencies in enzymes that catabolize gangliosides have been recognized for many decades (i.e, Tay-Sachs, Sandhoff’s disease), disorders of ganglioside biosynthesis have only recently been described [2]. The first such disorder was GM3 synthase (GM3S) deficiency, caused by a truncating mutation in the St3Gal5 gene (c.862C>T) observed among the Old Order Amish [3]. Since then, GM3S deficiency has been identified in non-Amish populations as well [4–7].
Patients with GM3S deficiency present normally at birth but begin to show neurological decline within the first 6-12 months of life [8]. The disorder is characterized by global developmental delay, somatic growth failure, microcephaly, profound intellectual disability, recurrent seizures, and cortical blindness [9]. Median survival is 23.5 years of age. Neuroradiologic findings in patients are subtle, which, together with the lack of symptoms at birth, implicates gangliosides as being critical for postnatal development rather than prenatal development. It is also possible that maternally transferred gangliosides support development in utero. At present, there is no treatment for GM3S deficiency. Symptoms, particularly seizure activity, are often unmanageable. Knowledge gaps regarding the molecular pathogenesis of the disorder has limited the development of therapies.
GM3S deficiency shares many clinical features with Leigh Syndrome, a neurometabolic disorder caused by mutations in mitochondrial respiratory chain components. Intriguingly, patient fibroblasts from two GM3S patients were shown to have impaired mitochondrial respiration [4]. Further, gangliosides have been implicated as regulators of mitochondrial function [10, 11]. Hypothesizing that mitochondrial dysfunction may play a role in the pathogenesis of ganglioside synthesis disorders, we interrogated metabolic and mitochondrial functions in both cellular and animal models of GM3S deficiency. Opposite to expectation, we observed enhanced metabolic activity in GM3S knockout cells and mice, specifically related to glucose metabolism. Suppression of glucose hypermetabolism may represent a future treatment strategy for managing symptoms in GM3S-deficient patients.
2. Materials and Methods
2.1. Animals
All animal protocols were approved by the University of Pittsburgh Institutional Animal Care and Use Committee (IACUC), and the experiments were conducted in accordance with the guidelines and regulations set forth in the Animal Welfare Act (AWA) and PHS Policy on Humane Care and Use of Laboratory Animals. Global St3Gal5 (Gm3 synthase) knockout mice and wild-type controls on a C57BL/6 strain background were generated through heterozygous breeding and were 4-6 months of age at the time of experimentation. Experiments used either male or female mice as indicated in figure legends. In all cases, wild-type controls were age and sex-matched. Standard rodent diet was used throughout the studies. Euthanasia was conducted using inhaled CO2 gas according to IACUC recommendations.
2.2. Thin-layer chromatography
Isolation of brain gangliosides and resolution by thin-layer chromatography (TLC) was done essentially as described by Porter et al [12]. Briefly, whole mouse brain was homogenized and gangliosides were extracted using chloroform-methanol extraction. Following solid-phase extraction on a Sep-Pak tC18 column, the gangliosides were dried to completion and reconstituted in a small volume of methanol. Then, separation of ganglioside species was achieved by TLC with 60:35:8 chloroform: methanol: 0.25% KCl as the eluent. After drying the TLC plate, the gangliosides were visualized with resorcinol.
2.3. Mouse metabolic phenotyping
Body weight was recorded just prior to evaluation of whole-body respiration by indirect calorimetry in the Comprehensive Lab Animal Monitoring System (CLAMS; Columbus Instruments, Columbus OH). Mice were acclimated to the CLAMS caging system for 24 hr and data was recorded for the subsequent 72 hr. Gas exchange data (VO2, VCO2) were normalized to body weight. The respiratory exchange ratio (RER) was calculated as the ratio of VCO2/VO2. Energy expenditure, in calories per hour, was calculated by the CLAMS Oxymax software. Fasting blood glucose and lactate values were obtained with handheld meters after a 16 hr fast. Finally, locomotor activity and rearing behavior were measured in an infrared open field actimeter (Panlab, Holliston, MA) early in the light cycle. Mice were placed into one corner of the 45 cm X 45 cm apparatus and monitored for 5 minutes using the ActiTrack software.
2.4. 18F-FDG positron emission tomography (PET)
Mice were subjected in vivo micro-PET/CT imaging at the University of Pittsburgh Rangos Research Center Animal Imaging Core. Mice were fasted for either 3 or 14 hours prior to imaging. Clinical grade 18F-fluorodeoxyglucose (18F-FDG, 0.2 mCi from SOFIE, Dulles, VA) was administered via tail vein 60 minutes prior to micro-PET/CT imaging. Induction of anesthesia was achieved by administration of 3% isoflurane. Depth of anesthesia was monitored by toe reflex (extension of limbs, spine positioning) and respiration rate. Once the plane of anesthesia was established, anesthesia was maintained with 1.5 % isoflurane via a nose cone and the mouse was transferred to the designated animal bed for imaging. 3D micro-PET imaging was carried out with a Siemens Inveon Multi-modality micro-CT-SPECT-PET system (Siemens Medical Solutions USA, Knoxville, TN) with the energy window of 350 – 650 KeV. A computed tomography (CT) scan was acquired at the same time for anatomical localization with the following parameters: half rotation, 220 projections, 2X2 binning, effective pixel size of 22.48 mm, transaxial field of view (FOV) 23.02 mm with 2048 pixels, axial FOV 40.29 mm with 3584 pixels, 80 kv of voltage, a current of 500 mA, and an exposure time of 1275 ms. The 3D micro-CT images were reconstructed using Feldkamp reconstruction algorithm and were calibrated to read out in Hounsfield Units (HU), with dd water set to 0 and air set to −1000 HU. The 3D micro-PET/CT image stacks were co-registered and analyzed using the Siemens Inveon Research Workplace (IRW). Mean and maximum standardized uptake values (SUV) were quantified for cortex and the sub-cortical area.
2.5. Seahorse extracellular flux analysis
The mouse neuronal cell line N41, engineered by CRISPR to be deficient in GM3 synthase, was grown and maintained as previously described [13]. GM3S−/− and wild-type cells were counted and seeded at 10,000 cells per well onto a 96-well Seahorse plate. The cells were grown on this plate for two days, then assayed with the Seahorse Extracellular Flux Analyzer to obtain values for basal oxygen consumption rate (OCR) and glycolysis (extracellular acidification rate, or ECAR). OCR and ECAR values were normalized to protein concentration.
2.6. Oroboros high-resolution respirometry
Freshly isolated whole mouse brain was minced and homogenized in ice-cold buffer (0.2 M mannitol, 50 mM sucrose, 10 mM KCl, 1 mM EDTA, 2.5 mM bovine serum albumin, 10 mM Hepes, pH 7.4) and cleared by centrifugation at 600 ×g. The supernatant was subsequently centrifuged at 10,000 x g to pellet mitochondria, which were then dispersed in MiR05 mitochondrial respiration buffer and evaluated immediately in an Oroboros Oxygraph-2 K. Substrate additions were cytochrome C (10 μM) and malate (2 mM) followed by 5 mM ADP to stimulate state 3 respiration. Next, 5 mM pyruvate and 10 mM glutamate were added to drive Complex I and 10 mM succinate to drive combined activity of Complex I + II. Maximum respiration was stimulated with the uncoupler carbonyl cyanide m-chlorophenylhydrazone (1 μM), and finally, the Complex I inhibitor rotenone was applied to enable determination of isolated maximal complex II respiration. Oxygen consumption rates were normalized to protein content.
2.7. Immunoblotting
Western blotting was performed after electrophoresis on Criterion SDS polyacrylamide gels (BioRad, Hercules, CA) and transfer to nitrocellulose membranes. Antibodies used, as well as their product numbers and working dilutions, were: 1) anti-glucose transporter-3 (GLUT3), Abcam ab191071, 1:2000; 2) anti-hexokinase (HK), Proteintech 19662-1-AP, 1:2000; 3) anti-pyruvate kinase M1 (PKM1), Proteintech 15821-1-AP, 1:2000; 4) anti-pyruvate dehydrogenase (PDH), Cell Signaling 3205, 1:2000; 5) anti-phospho-PDH E1α (pPDH), Cell Signaling 31866, 1:1000; 6) anti-succinate dehydrogenase subunit B (SDHB), Abcam ab154974, 1:10000; and anti-translocase of inner mitochondrial membrane 23 (TIM23), BD Biochemicals 11223, 1:1000. After incubation with HRP-conjugated secondary antibodies (1:5000), blots were visualized with chemiluminescence, scanned, and subjected to densitometric analysis using ImageJ software. Equal loading was demonstrated by ponceau-S staining of the membranes post-transfer.
2.8. Kainate-induced seizures
Seizure induction followed the protocol of Tang et al, who previously showed that GM3S−/− mice are hypersensitive to kainate-induced seizures [14], except that half of the GM3S−/− mice were injected i.p. with 500 mg/kg 2-deoxyglucose (2DG) 30 minutes prior to the kainate administration, and half received only saline vehicle. Kainate was dissolved into saline and injected i.p. at 10 mg/kg. Seizure scoring was performed beginning at time 0 and recorded every 5 min for 60 min, with the score representing the most severe stage noted during the previous 5-minute block of time. The 6-point severity scale was as follows: 0, no response; 1, immobilization, staring; 2, subtle, repetitive head bobbing; 3, exaggerated head bobbing, whole body twitching or “wet dog shakes”; 4, rigidity of forelimbs, rearing; 5, falling over, tonic-clonic seizure, rushing/jumping/flipping wildly; 6, death. After the 60-minute scoring period the animals were euthanized.
3. Results
3.1. Effects of GM3 synthase deficiency on whole-body metabolism
All gangliosides are synthesized from the common precursor lactosylceramide and can be grouped into three series, dubbed o-series, a-series, and b-series gangliosides (Fig 1). The a-series and b-series, which comprise >90% of gangliosides in the brain [1], are all synthesized from GM3, a simple ganglioside formed by GM3 synthase from lactosylceramide. In GM3 synthase knockout mice (GM3S−/−), no a-series or b-series gangliosides were detected in the brain (Fig 1). Rather, deletion of GM3 synthase favors synthesis of o-series gangliosides from accumulating lactosylceramide, and a marked upregulation of o-series gangliosides was seen in GM3S−/− mouse brain, as has been reported previously [15].
Fig 1. Effect of GM3 synthase deficiency on brain gangliosides.

GM3 synthase, encoded by the St3gal5 gene, converts lactosylceramide (LacCer) into GM3, the precursor for all downstream a-series and b-series gangliosides. The four species in green box represent >95% of cell-surface gangliosides in the brain. Inset: thin-layer chromatography of total brain gangliosides. Wild-type (WT) brain has abundant GM1, GD1a, GD1b, and GT1b (note: gangliosides in the sample migrate slightly faster than the standards due to small differences in solvent). GM3 synthase knockout (KO) brain has 3 bands that do not correspond to the standards (marked with asterisks). These represent alternative o-series gangliosides.
GM3S−/− mice have increased insulin sensitivity and demonstrate resistance to high-fat diet-induced obesity [16]. Here, we observed that male GM3S−/− mice consuming regular chow have significantly reduced body weight at age 4-6 months compared to wild-type littermate controls (Fig 2a). Next, indirect calorimetry was used to further investigate whole-body energy metabolism. Male GM3S−/− and wild-type littermate controls were individually monitored for 72 hours. Overall, GM3S−/− mice displayed significantly greater rates of both oxygen utilization and CO2 production, both during the day and night, despite consuming the same amount of chow as wild-type control mice (Fig 2b–f). The ratio of CO2 production to O2 utilization, known as the respiratory exchange ratio (RER), is an indicator of the animals’ preferred energy substrate. RER values can range from 0.7 to 1.0, with lower values indicative of a reliance on fatty acids for energy and higher values indicating a reliance upon glucose for energy. Mice typically utilize glucose during the night, when they are most actively feeding, and rely more upon fatty acids during the day, and thus the RER oscillates in day/night cycles. GM3S−/− mice exhibited a phase-shift in RER, with RER peaking in the final hours of the light periods rather than during the night (Fig 2g). When the average values for day and night 12-hr blocks were calculated, it was seen that the mean RER did not change between day and night for the GM3S−/− mice while it significantly increased as expected in wild-type controls (Fig 2h). The RER data suggest a constant reliance on glucose as the preferred energy source in GM3S−/− mice, during both day and night. The reliance of GM3S−/− mice on glucose for energy was further evidenced by reduced blood glucose values following an overnight fast and a non-significant trend toward higher blood lactate values (Fig 2i, j). The higher glucose oxidation during the day was not caused by higher levels of activity, as GM3S−/− and wild-type mice displayed similar overall activity levels when monitored in an open-field apparatus (Fig 2k). There were also no differences in total distance traveled in the actimeter, the amount of time spent resting, mean speed of travel, or rearing behavior (data not shown).
Fig 2. Effects of GM3 synthase deficiency on whole-body metabolism.

A cohort of N=6 male wild-type (WT) and GM3S−/− (KO) mice ages 4-6 months were weighed (a) and then monitored by indirect calorimetry (b-h) for 3 days. KO mice displayed lower body weights and greater rates of whole-body respiration, despite consuming the same amount of chow daily. Calculated RER values (g,h) indicated a greater reliance upon glucose in the light period. Following re-acclimation to their home cages, the same animals were subjected to an overnight fast. Blood glucose (i) and lactate (j) were measured with handheld meters early in the light cycle. Total physical activity was measured in an open-field actimeter for 5 minutes (k) during the light cycle. All bar graphs depict means and standard deviations. *P<0.01, **P<0.001.
3.2. Altered brain glucose metabolism in GM3S−/− mice
GM3S−/− mice are known to have greater muscle glucose uptake [16] but to our knowledge brain has not been studied. 18F-FDG PET imaging was used to measure total glucose uptake in the brain of GM3S−/− and wild-type littermates. Uptake was measured under conditions of both a short-term (3 hr) and long-term (14 hr) fast. After the short fast but not the long fast, GM3S−/− mice displayed significantly greater brain glucose uptake than wild-type mice (Fig 3a–c). In wild-type mice, the longer fasting period significantly increased glucose uptake, while in GM3S−/− mice the rate of glucose uptake was unaffected by the length of fasting. Neuronal metabolism was further studied using the murine neuronal cell line N41, in which CRISPR was used to knock out GM3 synthase. Seahorse extracellular flux analysis demonstrated that knockout cells had an overall higher rate of metabolism in high-glucose media, as evidenced by a non-significant trend toward a higher oxygen consumption rate (OCR) and a significant increase in extracellular acidification rates (ECAR), an indicator of glycolysis (Fig 3d). The OCR: ECAR ratio was not different between wild-type and knockout cells (Fig 3e), suggesting that that the knockout cells have a greater overall glucose flux rather than a differential reliance on either mitochondrial oxidative phosphorylation or glycolysis per se.
Fig 3. Altered brain glucose metabolism in GM3S−/− mice.

A cohort of N=3 female wild-type (WT) and GM3S−/− (KO) mice ages 4-6 months were subjected to 18F-FDG PET after a 14 hr fast, recovered for two weeks, and re-imaged after a 3 hr fast. Panels a,b are representative images from 3 hr fast. Arrows indicate brain regions with intense 18F-FDG signal accumulation. c) Images were used to calculate standard uptake values (SUV) for each mouse. d,e) Wild-type and GM3S−/− neuronal cells (N41 cell line) were analyzed for basal rates of oxygen consumption (OCR) and extracellular acidification (ECAR) as indicators of mitochondrial oxidative phosphorylation and glycolysis, respectively. Four separate experiments were run and combined by setting WT values = 1.0. OCR/ECAR ratios (e) were also calculated across the four experiments and combined. All bar graphs depict means and standard deviations. *P<0.01, **P<0.001.
3.3. Increased mitochondrial Complex-I driven respiration in GM3S−/− brain
To determine whether mitochondrial function was altered in GM3S−/− mice, mitochondrial respiration was measured in freshly prepared GMS3−/− and wild-type mouse brain homogenates using Oroboros high-resolution respirometry. Four pairs of knockout vs wild-type male and four pairs of knockout vs wild-type female brain homogenates were evaluated. In all cases, ADP-stimulated state 3 mitochondrial respiration was higher in GM3SKO−/− brain homogenates. A representative trace is shown in Fig 4a, and aggregated data in Fig 4b. Basal state 4 respiration was not different across genotypes. Complex I respiration, defined as the rate of steady-state respiration on malate, pyruvate, and glutamate, was significantly elevated in GM3S−/− brain homogenates, as was the rate of combined Complex I and Complex II respiration following the addition of succinate. Rotenone was added to inhibit Complex I, allowing isolated determination of Complex II-driven respiration. Complex II respiration did not differ between GM3S−/− and wild-type brain, indicating that the gain-of-function was specific to Complex I.
Fig 4. Increased mitochondrial Complex-I driven respiration in GM3S−/− brain.
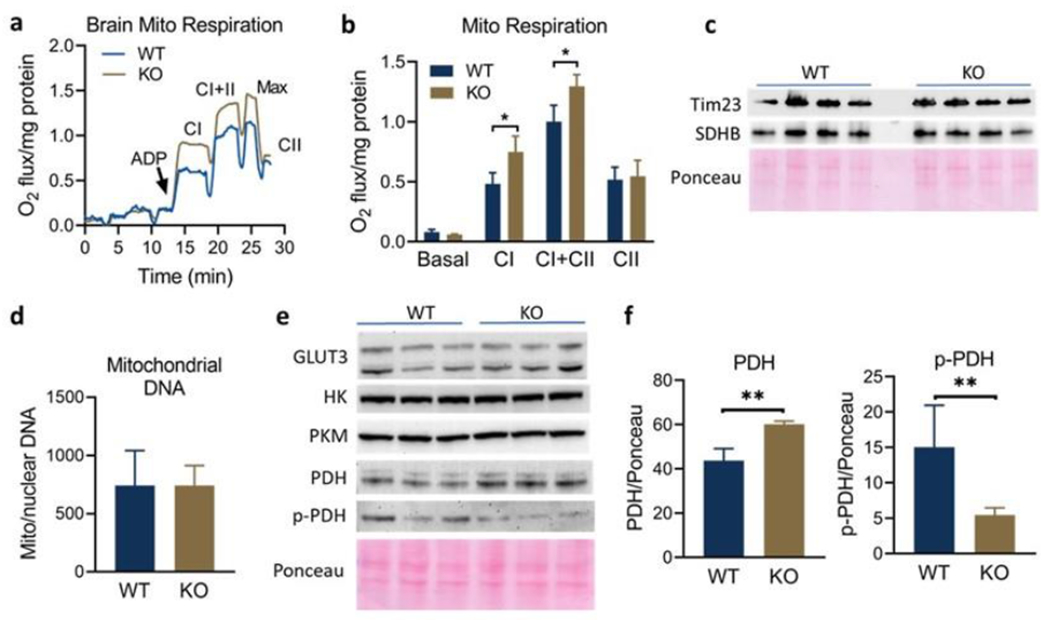
A cohort of N=4 female wild-type (WT) and GM3S−/− (KO) mice ages 4-6 months were used for brain Oroboros high-resolution respirometry. N=4 males were also measured, with similar results (not shown). a) Representative oxygen consumption trace from one WT versus one KO brain. CI, complex I=respiration on malate, pyruvate, and glutamate; CII, complex II=respiration on succinate. Maximal respiration was induced with the uncoupler CCCP and complex II was isolated using the complex I inhibitor rotenone. b) O2 flux data from N=4 mice were combined. c) Tim23 and succinate dehydrogenase-b (SDHB) were used as protein markers of the mitochondrial membrane and matrix, respectively. No differences were noted. d) qPCR was used to measure the ratio of mtDNA to nuclear DNA in N=4 mouse brains. e) Immunoblotting was used to measure brain levels of key glucose metabolism enzymes glucose transporter-3 (GLUT3), hexokinase (HK), pyruvate kinase-M (PKM), pyruvate dehydrogenase (PDH), and phospho-PDH (pPDH). By densitometry, KO brain exhibited significantly more total PDH with less phosphorylation (f), suggestive of increased PDH activity. All bar graphs depict means and standard deviations. *P<0.05, **P<0.01.
Next, the mechanism of mitochondrial gain-of-function was interrogated. Immunoblotting was performed for mitochondrial marker proteins Tim23 and succinate dehydrogenase subunit B (SDHB). Additionally, the ratio of mitochondrial to nuclear DNA was measured as an indicator of mitochondrial number. There were no differences between GM3S−/− brain and wild-type brain in any of these parameters, indicating that the increase in Complex I activity is not due to increased mitochondrial number (Fig 4c,d). We then evaluated the abundance of key proteins involved in the generation and metabolism of pyruvate, which is the major driver of Complex I respiration in the brain. The total levels of glucose transporter-3 (Glut3), the major glucose transporter in neurons, was not different across genotypes, nor were the levels of the glycolysis enzymes hexokinase and pyruvate kinase (Fig 4e). GM3S−/− brain did, however, express more pyruvate dehydrogenase (PDH), the enzyme that converts pyruvate to acetyl-CoA for entry into the TCA cycle (Fig 4e,f). The activity of PDH is regulated by phosphorylation, with higher activity in the dephosphorylated state. In GM3S−/− brain, PDH exhibited significantly less phosphorylation, suggestive of increased activity. Together, these data point to increased flux through PDH as the cause of the observed increase in mitochondrial respiration in GM3S−/− mouse brain.
3.4. Inhibiting glycolysis reduces seizure severity in GM3S−/− mice
GM3S−/− mice were previously shown to be hyper-sensitive to seizures induced by chemoconvulsant drugs including kainate [14]. We confirmed this hyper-sensitivity in both male and female GM3S−/− mice (not shown). Increased neuronal excitability is associated with increased energy demands, and other seizure animal models have shown improvement with the glycolytic inhibitor 2-deoxyglucose (2DG) [17]. We therefore tested whether a 2DG blockade of glucose metabolism might alter the response to kainate in GM3S−/− mice. GM3S−/− male mice ages 4-6 months received a 500 mg/kg bolus of 2DG or vehicle. Kainate was given 30 min later and seizure scores were monitored for the next 60 minutes. 2DG significantly reduced seizure scores in GM3S−/− mice (Fig 5).
Fig 5. Inhibiting glycolysis reduces seizure severity in GM3S−/− mice.

A cohort of N=6 male wild-type (WT) and GM3S−/− (KO) mice ages 4-6 months were given either 500 mg/kg 2DG or vehicle 30 min prior to seizure induction with 10 mg/kg kainate. a) Seizure scores were followed for 60 min. b) The area-under-the curve (AUC) from panel (a). Shown are means and standard deviations. *P<0.05, **P<0.01.
4. Discussion
The studies reported here implicate accelerated consumption of glucose by the brain as a feature of GM3S deficiency. Immunoblotting experiments suggest enhanced PDH function in GM3S−/− brain, which would increase delivery of glycolytically-derived pyruvate into the mitochondria. This manifests as increased mitochondrial respiration ex vivo when excess pyruvate is added to GM3S−/− brain mitochondria (Fig 4). While we did not observe any sign of respiratory chain impairment like that observed in patient fibroblasts [4], it remains possible that mitochondrial dysfunction may occur in non-nervous system tissues. Many tissues such as kidney, pancreas, liver, and adipose tissue have been observed to primarily express GM3 as the dominant ganglioside species [1], whereas in the brain downstream a-series and b-series gangliosides such as GM1 and GD1a comprise most of the ganglioside pool. Further studies must evaluate the role of individual ganglioside species on metabolism and mitochondrial function on a tissue-by-tissue basis.
A positive correlation between brain glucose utilization and neuronal activity has been known for decades [18–20]. It is generally accepted that higher rates of neuronal firing require more energy, and thus more glucose utilization. Patients with epilepsy show reduced brain glucose utilization between seizures and increased utilization during seizure activity. This knowledge led to the use of ketogenic diets to manage intractable epilepsy. Under severe ketosis, glucose utilization by the brain is suppressed in favor of ketone utilization. More recently, it has been shown that directly blocking glucose utilization with inhibitors like 2DG improves seizure symptoms in a variety of animal models [17, 21–23]. Here, we add GM3S deficiency to the list of models which demonstrate suppressed seizure activity when glucose utilization is restricted. The glycolysis inhibitor 2DG is currently in clinical trials for cancer and is expected to enter trials for seizure disorders. Thus, there may soon be an approved metabolic therapy to limit seizure activity in GM3S deficient patients.
In terms of molecular pathogenesis of GM3S deficiency, the studies described here raise some important questions for future investigation. The fact that GM3S−/− neuronal cells grown in vitro exhibit hypermetabolism, coupled with the hypermetabolism observed in GM3S−/− brain under basal non-seizure conditions, suggests that increased glucose consumption is an intrinsic property of GM3S−/− neurons. Such a metabolic phenotype may be related to the known role of GM3 and other downstream gangliosides in regulating cell signaling via direct interaction with numerous cell surface receptor tyrosine kinases (RTKs) [24–26]. For example, GM3 interacts with and negatively regulates the insulin receptor (IR) [27]. Accordingly, GM3S−/− mice show enhanced insulin sensitivity due to more active IR signaling [16]. Whether this altered IR signaling occurs in GM3S−/− brain remains unknown. An intriguing possibility is that brain hypermetabolism could be a causative mechanism for seizure activity in GM3S deficiency, i.e., altered IR signaling might constitutively increase glucose supply, driving neuronal hyperactivity, which then over time leads to overt seizures. In support of this, an oversupply of glucose (hyperglycemia) is well known to lower the threshold for seizures [28, 29]. In short, further experimentation is needed to temporally evaluate the link between ganglioside depletion, glucose metabolism, and seizure activity, ideally using a conditional, inducible knockout model rather than the global model used in the present studies. Tissue-specific interrogation of GM3S deficiency would also shed light on whether the changes in whole-body respiration and RER, observed here with indirect calorimetry, are caused solely by alterations in the brain or also involve other organ systems such as liver or muscle.
Acknowledgements
This work was supported by NIH R21 HD097403 (ESG), R01 DK090242 (ESG), R01 HD103602 (ESG), and the Children’s Hospital of Pittsburgh Research Advisory Council (AVS).
References
- 1.Schnaar RL, The Biology of Gangliosides. Adv Carbohydr Chem Biochem, 2019. 76: p. 113–148. [DOI] [PubMed] [Google Scholar]
- 2.Li TA and Schnaar RL, Congenital Disorders of Ganglioside Biosynthesis. Prog Mol Biol Transl Sci, 2018. 156: p. 63–82. [DOI] [PubMed] [Google Scholar]
- 3.Simpson MA, et al. , Infantile-onset symptomatic epilepsy syndrome caused by a homozygous loss-of-function mutation of GM3 synthase. Nat Genet, 2004. 36(11): p. 1225–9. [DOI] [PubMed] [Google Scholar]
- 4.Fragaki K, et al. , Refractory epilepsy and mitochondrial dysfunction due to GM3 synthase deficiency. Eur J Hum Genet, 2013. 21(5): p. 528–34. [DOI] [PMC free article] [PubMed] [Google Scholar]
- 5.Lee JS, et al. , GM3 synthase deficiency due to ST3GAL5 variants in two Korean female siblings: Masquerading as Rett syndrome-like phenotype. Am J Med Genet A, 2016. 170(8): p. 2200–5. [DOI] [PubMed] [Google Scholar]
- 6.Heide S, et al. , GM3 synthase deficiency in non-Amish patients. Genet Med, 2022. 24(2): p. 492–498. [DOI] [PubMed] [Google Scholar]
- 7.Boccuto L, et al. , A mutation in a ganglioside biosynthetic enzyme, ST3GAL5, results in salt & pepper syndrome, a neurocutaneous disorder with altered glycolipid and glycoprotein glycosylation. Hum Mol Genet, 2014. 23(2): p. 418–33. [DOI] [PMC free article] [PubMed] [Google Scholar]
- 8.Wang H, et al. , Early growth and development impairments in patients with ganglioside GM3 synthase deficiency. Clin Genet, 2016. 89(5): p. 625–9. [DOI] [PubMed] [Google Scholar]
- 9.Bowser LE, et al. , Recessive GM3 synthase deficiency: Natural history, biochemistry, and therapeutic frontier. Mol Genet Metab, 2019. 126(4): p. 475–488. [DOI] [PubMed] [Google Scholar]
- 10.Tang FL, et al. , Ganglioside GD3 regulates dendritic growth in newborn neurons in adult mouse hippocampus via modulation of mitochondrial dynamics. J Neurochem, 2021. 156(6): p. 819–833. [DOI] [PMC free article] [PubMed] [Google Scholar]
- 11.Fazzari M, et al. , The oligosaccharide portion of ganglioside GM1 regulates mitochondrial function in neuroblastoma cells. Glycoconj J, 2020. 37(3): p. 293–306. [DOI] [PubMed] [Google Scholar]
- 12.Porter MJ, Zhang GL, and Schnaar RL, Ganglioside Extraction, Purification and Profiling. J Vis Exp, 2021(169). [DOI] [PMC free article] [PubMed] [Google Scholar]
- 13.Inamori KI, et al. , Deficient ganglioside synthesis restores responsiveness to leptin and melanocortin signaling in obese KKAy mice. J Lipid Res, 2018. 59(8): p. 1472–1481. [DOI] [PMC free article] [PubMed] [Google Scholar]
- 14.Tang FL, et al. , Enhanced Susceptibility to Chemoconvulsant-Induced Seizures in Ganglioside GM3 Synthase Knockout Mice. ASN Neuro, 2020. 12: p. 1759091420938175. [DOI] [PMC free article] [PubMed] [Google Scholar]
- 15.Yoshikawa M, et al. , Mice lacking ganglioside GM3 synthase exhibit complete hearing loss due to selective degeneration of the organ of Corti. Proc Natl Acad Sci U S A, 2009. 106(23): p. 9483–8. [DOI] [PMC free article] [PubMed] [Google Scholar]
- 16.Yamashita T, et al. , Enhanced insulin sensitivity in mice lacking ganglioside GM3. Proc Natl Acad Sci U S A, 2003. 100(6): p. 3445–9. [DOI] [PMC free article] [PubMed] [Google Scholar]
- 17.Stafstrom CE, et al. , Anticonvulsant and antiepileptic actions of 2-deoxy-D-glucose in epilepsy models. Ann Neurol, 2009. 65(4): p. 435–47. [DOI] [PMC free article] [PubMed] [Google Scholar]
- 18.Sarikaya I, PET studies in epilepsy. Am J Nucl Med Mol Imaging, 2015. 5(5): p. 416–30. [PMC free article] [PubMed] [Google Scholar]
- 19.Engel J Jr., Kuhl DE, and Phelps ME, Patterns of human local cerebral glucose metabolism during epileptic seizures. Science, 1982. 218(4567): p. 64–6. [DOI] [PubMed] [Google Scholar]
- 20.Sokoloff L, Localization of functional activity in the central nervous system by measurement of glucose utilization with radioactive deoxyglucose. J Cereb Blood Flow Metab, 1981. 1(1): p. 7–36. [DOI] [PubMed] [Google Scholar]
- 21.Janicot R, Stafstrom CE, and Shao LR, 2-Deoxyglucose terminates pilocarpine-induced status epilepticus in neonatal rats. Epilepsia, 2020. 61(7): p. 1528–1537. [DOI] [PubMed] [Google Scholar]
- 22.Leiter I, et al. , Attenuation of epileptogenesis by 2-deoxy-d-glucose is accompanied by increased cerebral glucose supply, microglial activation and reduced astrocytosis. Neurobiol Dis, 2019. 130: p. 104510. [DOI] [PubMed] [Google Scholar]
- 23.Pan YZ, Sutula TP, and Rutecki PA, 2-Deoxy-d-glucose reduces epileptiform activity by presynaptic mechanisms. J Neurophysiol, 2019. 121(4): p. 1092–1101. [DOI] [PubMed] [Google Scholar]
- 24.Julien S, et al. , How Do Gangliosides Regulate RTKs Signaling? Cells, 2013. 2(4): p. 751–67. [DOI] [PMC free article] [PubMed] [Google Scholar]
- 25.Li Y, et al. , Ganglioside GM3 promotes HGF-stimulated motility of murine hepatoma cell through enhanced phosphorylation of cMet at specific tyrosine sites and PI3K/Akt-mediated migration signaling. Mol Cell Biochem, 2013. 382(1–2): p. 83–92. [DOI] [PubMed] [Google Scholar]
- 26.Kawashima N, et al. , Tyrosine kinase activity of epidermal growth factor receptor is regulated by GM3 binding through carbohydrate to carbohydrate interactions. J Biol Chem, 2009. 284(10): p. 6147–55. [DOI] [PubMed] [Google Scholar]
- 27.Inokuchi JI, et al. , Biology of GM3 Ganglioside. Prog Mol Biol Transl Sci, 2018. 156: p. 151–195. [DOI] [PubMed] [Google Scholar]
- 28.Peddawad D, Epileptic manifestations, pathophysiology, and imaging characteristics of non-ketotic hyperglycaemia: a review of the literature and a report of two cases with irreversible cortical vision loss. J Int Med Res, 2022. 50(3): p. 3000605221081429. [DOI] [PMC free article] [PubMed] [Google Scholar]
- 29.Hiremath SB, et al. , Hyperglycemia-induced seizures - Understanding the clinico- radiological association. Indian J Radiol Imaging, 2019. 29(4): p. 343–349. [DOI] [PMC free article] [PubMed] [Google Scholar]