

ABSTRACT
Despite the well-described discrepancy between ATG (macroautophagy/autophagy-related) genes in the regulation of hematopoiesis, varying essentiality of core ATG proteins in vertebrate definitive hematopoiesis remains largely unclear. Here, we employed zebrafish (Danio rerio) to compare the functions of six core atg genes, including atg13, becn1 (beclin1), atg9a, atg2a, atg5, and atg3, in vertebrate definitive hematopoiesis via clustered regularly interspaced short palindromic repeats (CRISPR)-Cas9 ribonucleoprotein and morpholino targeting. Zebrafish with various atg mutations showed autophagic deficiency and presented partially consistent hematopoietic abnormalities during early development. All six atg mutations led to a declined number of spi1b+ (Spi-1 proto-oncogene b) myeloid progenitor cells. However, only becn1 mutation resulted in the expansion of myb+ (v-myb avian myeloblastosis viral oncogene homolog) hematopoietic stem and progenitor cells (HSPCs) and transiently increased coro1a+ (coronin, actin binding protein, 1A) leukocytes, whereas atg3 mutation decreased the number of HSPCs and leukocytes. Proteomic analysis of caudal hematopoietic tissue identified sin3aa (SIN3 transcription regulator family member Aa) as a potential modulator of atg13- and becn1-regulated definitive hematopoiesis. Disruption of sin3aa rescued the expansion of HSPCs and leukocytes in becn1 mutants and exacerbated the decrease of HSPCs in atg13 mutants. Double mutations were also performed to examine alternative functions of various atg genes in definitive hematopoiesis. Notably, becn1 mutation failed to induce HSPCs expansion with one of the other five atg mutations. These findings demonstrated the distinct roles of atg genes and their interplays in zebrafish definitive hematopoiesis, thereby suggesting that the vertebrate definitive hematopoiesis is regulated in an atg gene-dependent manner.
Abbreviations: AGM: aorta-gonad-mesonephros; AO: acridine orange; atg: autophagy related; becn1: beclin 1, autophagy related; CHT: caudal hematopoietic tissue; CKO: conditional knockout; coro1a: coronin, actin binding protein, 1A; CQ: chloroquine; CRISPR: clustered regularly interspaced short palindromic repeats; dpf: days post fertilization; FACS: fluorescence-activated cell sorting; hbae1.1: hemoglobin, alpha embryonic 1.1; HSCs: hematopoietic stem cells; HSPCs: hematopoietic stem and progenitor cells; KD: knockdown; KO: knockout; map1lc3/lc3: microtubule-associated protein 1 light chain 3; MO: morpholino; mpeg1.1: macrophage expressed 1, tandem duplicate 1; mpx: myeloid-specific peroxidase; myb: v-myb avian myeloblastosis viral oncogene homolog; PE: phosphatidylethanolamine; p-H3: phospho-H3 histone; PtdIns3K: class 3 phosphatidylinositol 3-kinase; rag1: recombination activating 1; rb1cc1/fip200: RB1-inducible coiled-coil 1; RFLP: restriction fragment length polymorphism; RNP: ribonucleoprotein; sin3aa: SIN3 transcription regulator family member Aa; spi1b: Spi-1 proto-oncogene b; ulk: unc-51 like autophagy activating kinase; vtg1: vitellogenin 1; WISH: whole-mount in situ hybridization.
KEYWORDS: Autophagy-related genes, CRISPR-Cas9 ribonucleoprotein, definitive hematopoiesis, hematopoietic stem and progenitor cells, zebrafish
Introduction
Macroautophagy (hereinafter autophagy) serves as the scavenger of the cells by removal of harmful components via the lysosomal degradation, which, as an essential but complex process, is tightly regulated by a category of genes, namely ATG (autophagy-related) genes [1]. Approximately 20 core ATG proteins that orchestrate the critical steps of canonical autophagy were classified into six functional groups/machineries, including the ULK1 (unc-51 like autophagy activating kinase 1) complex (initiation), the class 3 phosphatidylinositol 3-kinase (PtdIns3K) complex (phagophore membrane nucleation), ATG9A-containing vesicles (providing membrane), ATG2A complex (membrane expansion), ATG12 conjugation system (membrane expansion and linking MAP1LC3/LC3 [microtubule associated protein 1 light chain 3] with phosphatidylethanolamine [PE]), and LC3–PE conjugation system (membrane expansion and target recognition), which are highly conserved across the eukaryotes [2]. Loss of core Atg genes commonly results in neonatal lethality in mice, while the exact cause of death remains elusive [3]. Despite the well-known essentiality of core Atg genes in mice, a recent clinical study reported the identification of twelve patients from five families who survived with severely impaired autophagy due to the loss of ATG7, one of the most well-studied core ATG genes [4]. This was ascribed to the non-canonical or alternative autophagy that undergoes in the absence of some core ATG genes because the autophagosomes could still be formed [4,5]. Many autophagic pathways independent of core Atg genes, such as those that bypass Ulk1, Becn1, Atg5 or Atg7, as well as the autophagy-independent functions of core Atg genes have also been identified in mice over the past decade [6,7]. Nevertheless, the majority of previous studies still focused on canonical autophagy, and the distinctive effects of various core ATG genes are largely neglected.
Previous studies have shown the resemblance and discrepancy between core Atg genes in the regulation of mouse hematopoiesis, which is a vital biological process of blood cellular component formation, although very few of them included more than one Atg gene [8]. In definitive hematopoiesis, atg5, atg7, or rb1cc1/fip200 (RB1-inducible coiled-coil 1) conditional knockout (CKO) in hematopoietic cells declined the number of hematopoietic stem cells (HSCs) [9–11], whereas becn1 or atg12 CKO failed to alter the total number of HSCs [12,13]. Moreover, atg5 or atg7 CKO reduced the number of multi-lineage progenitor cells [9,10]; in contrast, their number increased and remained unchanged in atg12 and becn1 CKO, respectively [12,13]. Among atg5, becn1, atg7, atg12, and rb1cc1 CKOs, myeloproliferation was only observed in atg7, atg12 or rb1cc1 CKO mice, while anemia was found in atg5, atg7, or rb1cc1 CKO mice [9–13]. These differential hematopoietic abnormalities found in CKO of the core Atg genes demonstrated the Atg genes-dependency of hematopoiesis, while more studies on other core Atg genes are needed. In addition to the differences between Atg genes, contradictory results in the regulation of hematopoiesis were also observed in CKOs of core Atg genes, including Atg5 and Atg7 [9,13,14]. Besides, Atg7 was found to be indispensable for adult but not for neonatal HSCs in mice [14], which suggested the important “timing” of various core Atg genes in the regulation of hematopoiesis. However, whether this “timing” also occurs in other core Atg genes or not remains unexplored.
Over the past decades, zebrafish (Danio rerio), a tropical freshwater fish, has emerged as a vital genetic model in the research field of hematopoiesis as well as autophagy due to its genetic tractability, small and transparent body, in vitro embryogenesis, and, more importantly, evolutionarily conversed genes orthologous to around 70% of the human genes [15–17]. With advanced gene editing tools, such as morpholino (MO) [18], transcription activator-like effector nucleases (TALEN) [19], and clustered regularly interspaced short palindromic repeats (CRISPR)-Cas9 [20], zebrafish embryos have gradually become a more efficient, convenient, and feasible model than mice in genetic screening in vivo, particularly in the studies of hematopoiesis. Nevertheless, the roles of core atg genes in zebrafish hematopoiesis remain largely unknown. Here, we reported for the first time, the differential effects of atg mutations via CRISPR-Cas9 ribonucleoprotein (RNP) or MO targeting on zebrafish definitive hematopoiesis, although their mutations all disturbed the autophagy process, which highlighted the essentiality of various atg gene-dependent effects rather than the uniformed canonical autophagy-dependent effect on vertebrate definitive hematopoiesis.
Results
Core atg gene targeting by CRISPR-Cas9 ribonucleoprotein
Core ATG genes that are required for the autophagy process have been classified into six evolutionarily conserved functional groups, also known as “core autophagy machineries” [2]. In this study, core atg genes were selected from the six core machineries of autophagy for CRISPR-Cas9 RNP targeting, including atg13 (ULK1 complex), becn1 (PtdIns3K complex), atg9a (ATG9A-containing vesicles), atg2a (ATG2A complex), atg5 (ATG12 conjugation system), and atg3 (LC3–PE conjugation system) (Figure 1A–B). Phylogenetic analysis revealed that these atg genes were conserved between zebrafish and humans with high similarities (Figure S1A–D). Single guide RNA (sgRNA) was designed for each atg gene targeting early exon to model null-like mutation in zebrafish embryos (Figure 1C). Very high mutagenesis efficiencies (>95%) were obtained in all somatic atg mutants as shown by restriction fragment length polymorphism (RFLP) assay (Figure 1D) and Sanger sequencing (Figure S1E), which can result in null-like loss of Atg protein (Figure S2A). In addition, stable production of null-like zebrafish mutants can be achieved by the skilled operator (Figure S2B). While most of the mutant embryos (>75%) displayed normal development and morphology in embryonic stages (Figure 1E), a small proportion of them were deformed in all the atg mutants (Figure S2C). Most of these mutants can only survive up to around 2 weeks post-fertilization, except atg9a and atg2a mutants who can survive to adulthood. In addition, MOs targeting six atg genes were used in parallel (Figure 1F), which also resulted in normal development and morphology in the majority of zebrafish mutants (Figure 1G) and similar deformed phenotypes (Figure S2D).
Figure 1.

Core atg genes targeting by CRISPR-Cas9 ribonucleoprotein and morpholino. (A) schematic diagram showing the involvement of autophagy machineries in the autophagy pathway. PAS, pre-autophagosomal structure. (B) schematic diagram showing the CRISPR-Cas9 ribonucleoprotein (RNP) targeting and core atg (autophagy-related) genes selected from autophagy machineries. (C) target sequences and sgRNA design for various atg genes in zebrafish. (D) restriction fragment length polymorphism (RFLP) assay and mutation efficiency of various atg genes-targeting sgRNAs. (E) representative morphology of 2 days post-fertilization (dpf) zebrafish embryos with atg mutations. Scale bar: 0.5 mm. (F) target sequences and morpholino (MO) design for various atg genes in zebrafish. (G) representative morphology of 2 dpf zebrafish embryos injected with MO targeting atg genes. Scale bar: 0.5 mm.
Autophagy deficiency in core atg mutant zebrafish embryos
We next examined autophagy levels after atg genes targeting in Tg(GFP-Lc3) zebrafish line. The number of Lc3+ autophagy puncta (autophagosome) in the muscle was significantly lowered in atg13, becn1, atg9a, atg5, and atg3 mutants but not in atg2a mutants (Figure 2A–C). The inconsistent autophagic activation or basal level was not only detected among different atg mutations but also among various organs and tissues (Figure S2G). Intriguingly, none of the atg mutations can completely block autophagy, which suggests the presence of individual atg gene-independent alternative autophagy. A consistent autophagic defect was also observed in different tissues of zebrafish embryos with MO-dependent atg gene knockdown (KD) (Figure 2D–F). In addition, autophagy flux was measured upon chloroquine (CQ) treatment or using Tg(GFP-Lc3:RFP-Lc3ΔG) zebrafish line. An elevated number of puncta was observed in the control (CTRL), becn1, atg9a, and atg5 mutants after CQ treatment, while it remained unchanged in atg13, atg2a, and atg3 mutants (Figure 2A–C). Similarly, an increased ratio of GFP-Lc3:RFP-Lc3ΔG was observed in both CRISPR-Cas9 RNP- and MO-based atg13 and atg2a mutant zebrafish embryos (Figure 2G–K), suggesting impaired autophagic flux in atg13 and atg2a mutants. Consistent with the observed autophagic changes in muscle cells, the western blot of whole embryos showed a similar reduction in the Lc3-II levels in various atg mutants other than atg13, which also indicated the tissue-specific autophagic changes (Figure S2E,F). More importantly, a more sensitive Cyto-ID autophagy staining [21] was performed in the sorted coro1a+ (coronin, actin binding protein, 1A) hematopoietic cells via fluorescence-activated cell sorting (FACS) since very few Lc3+ puncta can be detected in the coro1a+ cells of Tg(GFP-Lc3;coro1a:DsRed) zebrafish line (Figure S2H) and Cyto-ID autophagy dye failed to penetrate the live zebrafish embryo. Importantly, Cyto-ID+ autophagic vacuoles declined in almost all atg mutants similar to the decreased number of puncta in the muscle (Figure 3A–C), demonstrating that atg mutations resulted in autophagy deficiency in the hematopoietic cells.
Figure 2.

Autophagic deficiency in zebrafish embryos with core atg mutations. (A-B) autophagosomes or Lc3+ puncta in the muscle of various atg mutant Tg(GFP-Lc3) zebrafish embryos with (+) and without (−) chloroquine (CQ) treatment at 2 dpf. Scale bar: 50 μm. (C-D) autophagosomes or Lc3+ puncta in the muscle and skin cells of MO-based atg mutant Tg(GFP-Lc3) zebrafish embryos at 2 dpf. Scale bar: 50 μm. (E) statistical analysis of A-B, *, p < 0.05, **, p < 0.01 compared with control (CTRL), one-way analysis of variance (ANOVA) with post-hoc Tukey HSD test. (F) statistical analysis of C-D, **, p < 0.01 compared with CTRL, one-way ANOVA with post-hoc Tukey HSD test. (G-H) autophagic flux measured by using 2 dpf Tg(GFP-Lc3:RFP-Lc3ΔG) zebrafish embryos under CRISPR-Cas9 RNP- or MO-based atg mutations. Scale bar: 0.5 mm. *, p < 0.05, **, p < 0.01 compared with CTRL, one-way ANOVA with post-hoc Tukey HSD test.
Figure 3.
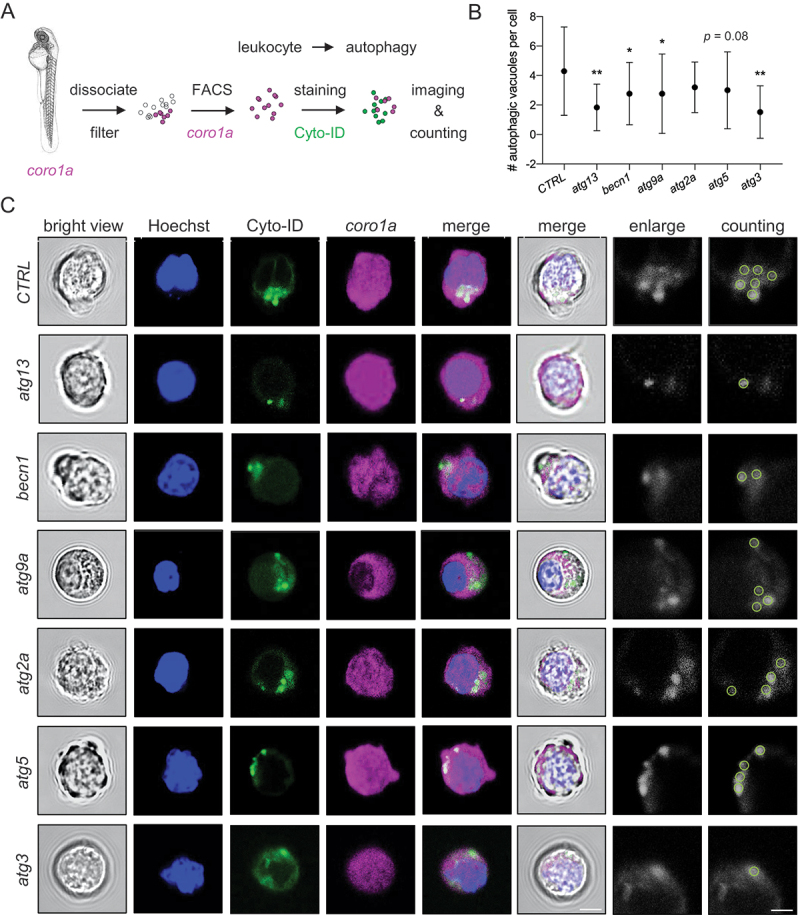
Attenuation of autophagic vacuoles in leukocytes with core atg mutations. (A) experimental setup for Cyto-ID+ autophagic vacuole measurement in coro1a+ leukocytes sorted from 2 dpf zebrafish embryos through fluorescence-activated cell sorting (FACS). (B-C) representative images and quantification of Cyto-ID+ autophagic vacuoles in coro1a+ leukocytes sorted from zebrafish embryos with various atg mutations. *, p < 0.05, **, p < 0.01 compared with CTRL, one-way ANOVA with post-hoc Tukey HSD test. Scale bar: 5 μm.
Distinct effects of atg mutations on zebrafish definitive hematopoiesis
We then examined the effects of atg mutations on definitive hematopoiesis by whole-mount in situ hybridization (WISH). Although all the atg mutations resulted in autophagy deficiency, only becn1 mutation caused myb+ (v-myb avian myeloblastosis viral oncogene homolog) hematopoietic stem and progenitor cells (HSPCs) expansion in aorta-gonad-mesonephros (AGM) and caudal hematopoietic tissue (CHT) in zebrafish embryos at 30 and 48 h post-fertilization (hpf), respectively (Figure 4A–F). In contrast, atg13 and atg3 mutations decreased the number of myb+ HSPCs in the CHT at 48 hpf, albeit modestly (<30%), and atg9a, atg2a, and atg5 mutations showed no effects on the number of HSPCs (Figure 4D–F). Alterations in the number of lcp1+ (lymphocyte cytosolic protein 1) leukocytes were consistent with the change of HSPCs in becn1, atg9a, atg2a, atg5 (p = 0.08), and atg3 mutant zebrafish embryos, while an opposite change of leukocytes to HSPCs was found in atg13 mutants (Figure 4J–L). Conversely, spi1b+ (Spi-1 proto-oncogene b) myeloid progenitor cells consistently declined in all the atg mutants (Figure 4G–I), and no significant difference was observed in the hbae1.1+ (hemoglobin, alpha embryonic 1.1) erythrocytes (Figure 4M–O) and rag1+ (recombination activating 1) lymphocytes in CHT at 48 hpf and thymus at 96 hpf, respectively (Figure S2I,J). Further, time-dependent effects of atg mutations on definitive hematopoiesis were assessed in CRISPR-Cas9 RNP- or MO-based atg mutant Tg(myb:GFP), Tg(spi1b:GFP), Tg(coro1a:DsRed), Tg(mpx [myeloid-specific peroxidase]:GFP), and Tg(mpeg1.1 [macrophage expressed 1, tandem duplicate 1]:GFP) (Figure 5A and Figure S3A,B). In consistent with WISH results, becn1 mutation increased while atg3 mutation decreased the number of myb+ HSPCs and coro1a+ leukocytes in zebrafish embryos from 2 to 4 days post-fertilization(dpf) (Figure 5B–G). Besides, a lower number of spi1b+ myeloid progenitor cells was found in all the atg mutations from 2 to 4 dpf (Figure 5D–E). However, increased myb+ HSPCs and coro1a+ leukocytes in atg13 mutants and increased coro1a+ leukocytes in becn1 mutants are transient (Figure 5B–G). Notably, a lowering effect of atg9a, atg2a, and atg5 mutations on the number of myb+ HSPCs was observed in late stages, whereas atg3 mutation decreased the HSPCs from 2 to 4 dpf (Figure 5B,C). Regarding different myeloid lineages, the change of mpx+ neutrophils in atg mutant zebrafish is consistent with coro1a+ leukocytes (Figure S4A–C and S5A,B). However, the number of mpeg1.1+ macrophages was lowered in atg13, becn1, atg5, and atg3 mutants (Figure S4D,E and S5A,B).
Figure 4.

Distinct effects of core atg mutations on zebrafish definitive hematopoiesis. (A-C) whole-mount in situ hybridization (WISH) results of myb+ HSPCs in aorta-gonad-mesonephros (AGM) of 30 h post-fertilization (hpf) zebrafish embryos. **, p < 0.01 compared with CTRL, chi-squared test. H, high group; M, medium group. (D-F) WISH results of myb+ HSPCs in caudal hematopoietic tissue (CHT) of 48 hpf zebrafish embryos. **, p < 0.01 compared with CTRL, one-way ANOVA with post-hoc Tukey HSD test. (G-I) WISH results of spi1b+ myeloid progenitor cells in CHT of 36 hpf zebrafish embryos. *, p < 0.05, **, p < 0.01 compared with CTRL, one-way ANOVA with post-hoc Tukey HSD test. (J-L) WISH results of lcp1+ leukocytes in CHT of 48 hpf zebrafish embryos. **, p < 0.01 compared with CTRL, one-way ANOVA with post-hoc Tukey HSD test. (M-O) WISH results of hbae1.1+ erythrocytes in the CHT of 48 hpf zebrafish embryos. No significant difference was found between CTRL and atg mutations, chi-squared test. All the CHT results in WISH pictures were straightened using ImageJ.
Figure 5.

Time-dependent effects of core atg mutations on zebrafish definitive hematopoiesis. (A) experimental setup for the time-dependent effect of CRISPR-Cas9 RNP- or MO-based atg mutations on definitive hematopoiesis from 2 to 4 dpf. (B-D) effects of CRISPR-Cas9 RNP-based atg mutations on myb+ HSPCs, spi1b+ myeloid progenitor cells, and coro1a+ leukocytes from 2 to 4 dpf. *, p < 0.05, **, p < 0.01 compared with CTRL, one-way ANOVA with post-hoc Tukey HSD test. (E-G) effects of MO-based atg mutations on myb+ HSPCs, spi1b+ myeloid progenitor cells, and coro1a+ leukocytes from 2 to 4 dpf. *, p < 0.05, **, p < 0.01 compared with CTRL, one-way ANOVA with post-hoc Tukey HSD test.
Proteomic analysis of caudal hematopoietic tissue with atg mutations
To elucidate the differential effects of atg mutation on definitive hematopoiesis, mass spectrometry-based proteomic analysis was performed by using the CHT region of zebrafish embryos to identify the proteomic differences underlying these inconsistent hematopoietic phenotypes (Figure 6A,B). Strikingly, significantly changed proteins identified in mass spectrometry (p < 0.05, fold change > 1.50 or < 0.66) varied between atg mutations, in which atg2a mutation has the lowest number of altered proteins compared with other atg genes (Figure 6C). We further examined the similarity of proteomic profiles between different atg mutants and found a relatively high number of consistent proteins when comparing atg5 with atg13 or atg3 (Figure 6D). Biological processes enrichment suggested that proteins are primarily involved in nutrition or energy-related processes, such as transport process, metabolic processes, and biogenesis (Figure 6E and Table S2). Of these processes, atg3 and becn1 mutations had the highest number of altered proteins in transport and metabolic processes, respectively. More specifically, we identified Sin3aa (SIN3 transcription regulator family member Aa), a crucial epigenetic modifier inconsistently expressed among six atg mutations, in which its levels significantly decreased in atg13 but increased in becn1 mutants compared to CTRL (Figure 6B,F). Conversely, the protein level of Vtg1 (Vitellogenin 1), an estrogen responder, elevated in all atg mutants (Figure 6G). In addition to the distinct proteomic profile, cell death and proliferation were also assessed by using Acridine Orange (AO) and p-H3 (phospho-histone H3) staining, respectively (Figure 6H,I). The number of AO+ and coro1a+ apoptotic leukocytes increased in atg13, becn1, and atg5 mutants, while it remained unchanged in the other atg mutants. Besides, p-H3+ cells undergoing mitosis in the CHT also increased in becn1 but decreased in atg5 mutants.
Figure 6.

Mass spectrometry-based proteomic and cellular variabilities among atg mutations. (A) experimental setup for mass spectrometry-based proteomic analysis of the CHT region of zebrafish embryos with various atg mutations. (B) volcanic map of atg mutations comparing with CTRL. Red dot, Sin3aa (SIN3 transcription regulator family member a) protein. (C-D) comparison of the number (#) of significantly changed proteins, including both increased and decreased proteins, and the number of consistent proteins among atg mutations. (E) biological process enrichment of significantly altered proteins in various atg mutants. (F-G) protein levels of Sin3aa and Vtg1 (Vitellogenin 1) among atg mutations. **, p < 0.01 compared with CTRL, analyzed by progenesis QI software. (H) the number of apoptotic coro1a+ leukocytes in the CHT was measured by using acridine orange (AO) live staining. *, p < 0.05, **, p < 0.01 compared with CTRL, one-way ANOVA with post-hoc Tukey HSD test. (H) the number of cells undergoing mitosis in the CHT measured by using p-H3 (phospho-histone H3) immunostaining. *, p < 0.05, **, p < 0.01 compared with CTRL, one-way ANOVA with post-hoc Tukey HSD test.
Involvement of sin3aa in core atg genes-dependent regulation of HSPCs
We next explored whether Sin3aa contributed to the discrepancy in definitive hematopoiesis among atg mutations, especially the difference in HSPCs between atg13 and becn1 mutants. CRISPR-Cas9 RNP was designed to target sin3aa in zebrafish embryos (Figure 7A), which led to a high mutagenesis efficacy but showed no effects on the development and morphology of zebrafish embryos in early stages (Figure 7B,C and Figure S4F). Besides, sin3aa mutation alone showed no effects on the definitive hematopoiesis, including myb+ HSPCs, spi1b+ myeloid progenitor cells, coro1a+ leukocytes, mpx+ neutrophils, and mpeg1.1+ macrophages, in zebrafish embryos from 2 to 4 dpf (Figure S4G). Notably, co-mutation of sin3aa and becn1 rescued myb+ HSPCs expansion and transiently increased coro1a+ leukocytes and mpx+ neutrophils in CHT from 2 dpf to 4 dpf, while it did not alter the number of spi1b+ myeloid progenitor cells and mpeg1.1+ macrophages in becn1 mutants (Figure 7D–H and Figure S6A). In contrast, sin3aa co-mutation exacerbated the lowered number of myb+ HSPCs in atg13 mutants, which remained significantly lower than controls at 3 and 4 dpf, and decreased the transiently increased coro1a+ leukocytes and mpx+ neutrophils (Figure 7D–G). Similarly, sin3aa co-mutation did not affect spi1b+ myeloid progenitor cells and mpeg1.1+ macrophages in atg13 mutants (Figure 7E,H).
Figure 7.

sin3aa contributes to HSPCs regulation by becn1 and atg13 in zebrafish embryos. (A) experimental setup for the time-dependent hematopoietic responses to co-mutation of sin3aa with various atg genes. (B-C) representative morphology of 2 dpf zebrafish embryos with sin3aa mutation and sequencing results of the representative mutation. Scale bar: 0.5 mm. (D-H) time-dependent effects of co-mutation of sin3aa with various atg genes on myb+ HSPCs, spi1b+ myeloid progenitor cells, coro1a+ leukocytes, mpx+ neutrophils, and mpeg1.1+ macrophages from 2 to 4 dpf. *, p < 0.05, **, p < 0.01 compared with CTRL, one-way ANOVA with post-hoc Tukey HSD test.
Effect of double atg mutations on definitive hematopoiesis and autophagy
To further delineate the interplays among atg mutations in definitive hematopoiesis, we double-mutated every two core atg genes in zebrafish embryos (Figure 8A). High mutagenic efficiencies similar to single CRISPR-Cas9 RNP injection were obtained (Figure S7A). Unlike single atg mutation, double mutation resulted in a higher death and deform rate in zebrafish embryos (Figure S7B). Since atg genes had been found to be activated rhythmically in a clock-dependent manner, featuring the dynamic mRNA levels of atg genes during the early days after birth [22], we also tracked the effect of atg double mutations on definitive hematopoiesis including myb+ HSPCs and coro1a+ leukocytes from 2 to 4 dpf to examine their potential time-dependent effects. Notably, myb+ HSPCs and transient coro1a+ leukocyte expansion in becn1 mutation can only be found in double mutation with atg5, while the other atg mutations alleviated the becn1 mutation-dependent phenotypes (Figure 8B,C and Figure S8A,B). Conversely, a declined number of myb+ HSPCs in atg3 mutation was largely independent of the other atg mutations, while the decreased number of coro1a+ leukocytes returned to normal levels after co-mutations with other atg mutations (Figure 8B,C). More interestingly, a lower number of myb+ HSPCs was found in atg13 mutation when double-mutating with any other atg genes except for becn1 (Figure 8B,C). These synergistic effects of atg double mutations in definitive hematopoiesis could be potentially attributed to autophagic alterations and their mutual regulations. The formation of Lc3+ puncta was robustly blocked in most of the double atg mutations in addition to the double-mutation of atg2a with becn1, atg9a, or atg3 (Figure 8D and Figure S7C). We also evaluated the mRNA levels of six atg genes under one of the atg mutations, revealing that a single atg mutation lowered the mRNA levels of at least some of the other atg genes (Figure S7D). Altogether, these results indicate that interplays among core atg genes orchestrate the regulation of definitive hematopoiesis in zebrafish embryos.
Figure 8.

Time-dependent effects of core atg genes double mutations on zebrafish definitive hematopoiesis. (A) experimental setup for the time-dependent responses of myb+ HSPCs and coro1a+ leukocytes to double mutations of every two atg genes. (B) time-dependent effect of core atg double mutations on myb+ HSPCs during the period from 2 to 4 dpf. *, p < 0.05, **, p < 0.01 compared with CTRL, one-way ANOVA with post-hoc Tukey HSD test. (C) time-dependent effect of core atg double mutations on coro1a+ leukocytes during the period from 2 to 4 dpf. *, p < 0.05, **, p < 0.01 compared with CTRL, one-way ANOVA with post-hoc Tukey HSD test. (D) effect of core atg double mutations on Lc3+ puncta in 2 dpf zebrafish embryos. A, atg; B, becn1. Scale bar: 50 μm.
Discussion
Defective canonical autophagy has long been involved in the hematopoietic disturbances observed in core Atg gene-deficient mice [23]. The evidence emerging in the past decade, however, reported the distinct effects of various core Atg genes ablation on definitive hematopoiesis [9–13]. It suggested canonical autophagy-independent roles of various core ATG genes, largely comprising core ATG genes-dependent non-canonical autophagy and non-autophagy functions, in the hematopoietic system, although their roles have been rarely compared. In this context, we hypothesized that the core ATG gene has both shared and distinctive functions in definitive hematopoiesis when compared with other core ATG genes. Thus, we selected six core atg genes from different core autophagy machineries, including atg13 (ULK1 complex), becn1 (PtdIns3K complex), atg9a (ATG9A-containing vesicles), atg2a (ATG2A complex), atg5 (ATG12 conjugation system), and atg3 (LC3–PE conjugation system) [2], and examined their functions in zebrafish definitive hematopoiesis using CRISPR-Cas9 RNP and MO targeting. We first observed the autophagy deficiency in the body and hematopoietic cells of various atg mutant zebrafish embryos. However, core atg mutations showed distinct effects on the definitive hematopoiesis in zebrafish embryos, with some of the effects being time- or cell type-dependent. Further, the mechanisms underlying the discrepancy among various atg mutations in definitive hematopoiesis were determined by using proteomic analysis and double mutations. These findings suggested the distinctive roles of core atg genes and their interplays in zebrafish definitive hematopoiesis.
Approximately 20 core ATG genes that are fundamental to canonical autophagy have been functionally categorized into six core autophagy machineries [2]. Since canonical autophagy is essential for development, mutations of core atg genes corresponding to various core autophagy machineries except for atg9a and atg2a in the present study resulted in larval lethality in accordance with a previous report [24]. This suggests the consistency of the role of atg/Atg genes in the early development between zebrafish and mice [3]. As core ATG genes that primarily facilitate the formation of autophagosome in autophagy process, the level of autophagocomes in response to atg13, becn1, and atg5 knockout (KO) or KD has been previously studied in zebrafish, whereas studies on atg9a, atg2a, and atg3 mutations are not yet reported. Of these, MO-based KD of atg13 and atg5 decreased the level of autophagosomes, characterized by declined levels of Lc3-II protein and Lc3+ puncta in zebrafish [25,26]. In the present study, similar reductions in autophagosome numbers were also observed after CRISPR-Cas9 RNP or MO-based atg13 or atg5 targeting. Conversely, contradictory results were observed in becn1 mutations, in which MO-based KD of exon two or four of becn1 targeting in this and previous studies attenuated the level of autophagosomes, while exon seven of becn1 targeting increased the level of autophagosomes in another study [26–28]. These results suggested a mutation type-dependent effect of becn1 mutation on autophagosome formation, and targeting early exons of becn1 may be required for the inhibition of autophagosome formation. More importantly, to our knowledge, this is the first study that described the functions of atg9a, atg2a, and atg3 mutations in the autophagy of zebrafish embryos. Since ATG9A and ATG3 are responsible for autophagosome formation and LC3 lipidation, respectively [29,30], a decreased level of autophagosome was observed in zebrafish embryos with atg9a and atg3 mutations. In addition, disruption of ATG2A is associated with impaired autophagic flux and accumulation of immature autophagosomal membranes in mammalian cells [31], which was reproduced in atg2a-mutant zebrafish embryos. By using CQ treatment and Tg(GFP-Lc3:RFP-Lc3ΔG) zebrafish line, we also found atg13 and atg3 mutations affected the autophagic flux in zebrafish embryos, probably through distinct mechanisms by inhibiting the autophagosome formation or LC3 lipidation [30,32]. Altogether, the function of various atg genes in the canonical autophagy process conservatively between zebrafish and mammalians, and CRISPR-Cas9 RNP targeting resulted in a similar loss of function as homozygous mutation and MO-based KD in zebrafish embryos.
Despite the autophagy deficiency in zebrafish embryos with various atg mutations, our work showed that the hematopoietic abnormities varied between atg mutations. Of these, becn1, atg13, and atg3 mutations showed considerable but different effects on zebrafish definitive hematopoiesis. This observation implied that regulator effects of various core atg genes are, at least partially, canonical autophagy-independent as observed in previous mice studies [9–13]. However, little is known about the specific core Atg genes-dependent hematopoietic effects in mice since none of previous studies included comparisons among several Atg genes, and very few core Atg genes have been studied in mice. The present study determined that becn1 mutation induced HSPCs expansion and transiently increased leukocytes and neutrophils in zebrafish during embryonic development. Although the up-regulator effects of becn1 KD on HSPCs have been reported in zebrafish embryos with KRI1 homolog mutation [33], our work for the first time identified the sole role of becn1 mutation in HSPCs expansion during normal hematopoiesis, which can be ascribed to the altered regulator proteins of HSPCs [34] or disturbances among autophagy, apoptosis, and differentiation [35]. The ortholog of Sin3a, an epigenetic modifier essential to HSCs maintenance and hematopoiesis in mice [36], was found to be up-regulated following becn1 mutation. Further co-mutation results also confirmed that becn1 mutation-based HSPCs regulation is sin3aa-dependent. Conversely, the level of HSPCs, including long term-HSC and HSC-containing lineage−/Spinocerebellar ataxia type 1+/KIT proto-oncogene, receptor tyrosine kinase+ (LSK) cells, elevated in the spleen while they declined in bone marrow in adult mice with becn1 CKO in hematopoietic cells [12]. Thus, Becn1/becn1 behaves heterogeneously in the regulation of HSPCs between zebrafish and mice. It could be explained by that mouse HSCs reside in both spleen and bone marrow, whereas the HSPCs largely resided in the CHT of zebrafish larvae. Besides, this discrepancy could also be attributed to the unaltered autophagy and autophagic flux in HSPCs of mice with becn1 CKO [12]. Strikingly, myeloid cell-specific becn1 CKO increased the neutrophil and leukocytes but not the macrophages in mice, which was consistent with our findings in zebrafish embryos [37]. Also, a similar expansion of hematopoietic lineages was reported in a fruit fly (Drosophila melanogaster) model with atg6/becn1 KO [38]. These findings indicated that the expansion of neutrophils and leukocytes in zebrafish with becn1 mutation may be due to the loss of becn1 in myeloid progenitor cells without affecting the HSCs since HSCs minimally contribute to zebrafish definitive hematopoiesis in the early stage [39].
Conversely, atg13 mutation showed the opposite effect to becn1 mutation in HSPCs, in which it lowered the level of HSPCs in zebrafish embryos in a sin3aa-dependent manner. Although no study has explored the roles of atg13 mutation in definitive hematopoiesis, our findings provide preliminary but important evidence that core atg genes could play opposite roles in definitive hematopoiesis by modulating the same regulator. In addition, atg3 mutation showed down-regulator effects on HSPCs, myeloid progenitor cells, and leukocytes, including both neutrophils and macrophages in zebrafish embryos, which is in accordance with hematopoietic defects observed in atg7 CKO mice probably due to the involvement of both Atg7 and Atg3 in Lc3–PE conjugation system [10]. However, evidence on hematopoietic responses to ATG3 mutation in mammalians has not yet been reported. Unlike becn1 and atg13, the level of sin3aa remained unchanged in atg3 mutant zebrafish embryos, suggesting the existence of another mechanisms underlying core atg gene-regulated definitive hematopoiesis in zebrafish, which required further investigations. In summary, mutation of ATG genes that belong to the same autophagy machinery may share the feature of hematopoietic abnormalities and core ATG genes could play different even opposite roles in vertebrate definitive hematopoiesis.
In addition to the distinct effects of various core atg genes on HSPCs, leukocytes, neutrophils, and macrophages, myeloid progenitor cells showed similar responses to all the atg mutations, which may be regulated through the canonical autophagy pathway. We also identified vtg1, an estrogen responder that was up-regulated in all the atg mutations, suggesting a potential alteration in estrogen under atg mutations. A previous study has revealed that estrogen impaired the HSPCs production by interfering with the hemogenic endothelial niche [40]. Thus, the consistent responses of myeloid progenitor cells in zebrafish with various atg mutations may be due to the interactions between canonical autophagy-regulated estrogen and the niche of hematopoietic cells in zebrafish embryos, though further studies are needed. Conversely, the responses of myeloid progenitor cells in mice differed between Atg genes CKO [9–13], which is potentially due to developmental stage differences [14]. More importantly, we also confirmed the interplays between core atg genes. Hematopoietic defects in atg3 mutants are largely independent of other core atg genes, whereas HSPCs expansion in becn1 mutant zebrafish embryos largely depends on the presence of other core atg genes. It suggests that atg3 itself may be essential to definitive hematopoiesis, while becn1-independent non-canonical autophagy likely contributes to HSPCs expansion. Our findings further highlight the need to study multiple ATG genes and their interplays simultaneously. However, only one study on definitive hematopoiesis was documented in mice with double atg gene KOs, which revealed an indispensable Ulk1-mediated Atg5-independent autophagy in the regulation of erythropoiesis [41]. The interactions between other ATG genes in other lineage hematopoiesis remain concealed. Zebrafish provide an alternative platform to study non-canonical autophagy and non-autophagy functions of various core ATG genes in vivo. Despite our work providing a more comprehensive picture of various core ATG genes in the regulation of vertebrate definitive hematopoiesis than previous studies, the limitations of this study cannot be neglected: 1) the effects of atg mutations are limited to zebrafish definitive hematopoiesis in the embryonic stage; 2) cell-autonomous and non-cell-autonomous effects of atg genes cannot be distinguished, and 3) more ATG genes and their combinations are needed, which ultimately calls for the use of inducible hematopoietic cell-specific multiplex atg genes KO and more advanced proteomic analysis in future studies.
Materials and methods
Zebrafish strains and husbandry
Transgenic and wild-type zebrafish were maintained in 14:10 h light:dark cycle and fed brine shrimp twice daily. Tg(GFP-Lc3) [42], Tg(myb:GFP) (zf289Tg), Tg(coro1a:DsRed) [43], Tg(spi1b:GFP) (zdf11Tg), Tg(mpx:mCherry) [44], Tg(mpeg1.1:Dendra2) [45], and Tg(GFP-Lc3:RFP-Lc3ΔG) [46] zebrafish lines were used in this study. Zebrafish embryos were raised at 28.5°C and staged by dpf and morphological criteria as previously described [47]. All animal experiments were performed in accordance with protocols approved by Animal Subjects Ethics Sub-Committee (ASESC) of The Hong Kong Polytechnic University.
CRISPR-Cas9 ribonucleoprotein and morpholino targeting
Target sites and sgRNA of zebrafish atg genes (atg13, becn1, atg9a, atg2a, atg5, and atg3) or sin3aa were identified and designed using Alt-R® CRISPR-Cas9 guide RNA design tool (Integrated DNA Technologies) or CRISPRscan [48]. Target sites were chosen that the one with 1) good on-target score, 2) acceptable off-target score, and 3) a restriction enzyme site around the protospacer adjacent motif (PAM) sequence. Target sequence and restriction enzyme site of atg genes-targeting sgRNA used in this study were listed in Figure 1C and Figure S1E. Given the target sequences of sgRNA, CRISPR-Cas9 RNPs were generated and delivered to zebrafish embryos as previously described [20]. Briefly, synthetic Alt-R® CRISPR-Cas9 sgRNA (Integrated DNA Technologies) was folded at 95°C for 5 min and then cooled down to the room temperature. Alt-R® S.p. Cas9 Nuclease V3 (Integrated DNA Technologies 1,081,059) diluted in Cas9 working buffer (20 mM HEPES, 150 mM KCl, pH 7.5) and subsequently was assembled with folded sgRNA in 37°C for 10 min. Around 2 nl CRISPR-Cas9 RNP was delivered into the cell of zebrafish embryos at the one-cell stage through microinjection. For co-injection, two CRISPR-Cas9 RNPs were formed individually and then mixed before micro-injection. Around 4 nl CRISPR-Cas9 RNPs were injected into the cell of zebrafish embryos. Almost no toxic effect of these CRISPR-Cas9 RNPs was observed in zebrafish embryos after microinjection. On the other hand, MOs targeting atg13, becn1, and atg5 were pre-designed [26,49,50], while atg9a, atg2a, and atg3 were designed by Gene Tools, LLC (Figure 1F). All MOs were purchased from Gene Tools, LLC and confirmed by using Tg(GFP-LC3) zebrafish line as previously described [25]. Diluted atg genes-targeting MO was micro-injected into zebrafish embryos at the one-cell stage and standard control MO was injected as CTRL [51].
Restriction fragment length polymorphism assay
Mutagenesis and mutagenic efficiency were detected by using RFLP assay as previously described [19]. Briefly, a 300 to 600 bp PCR fragment covering the designed sgRNA target site was amplified for each atg gene using corresponding primers listed in Table S1. Next, the restriction enzyme (listed in Figure S1E, New England Biolabs) was then used to cleave the PCR fragment, in which the uncleaved band suggested a destroyed restriction enzyme site by CRISPR-Cas9 RNP-induced mutations, while the cleaved band contained original sequence. Mutagenic efficiency was calculated by dividing the intensity of the uncleaved band by the intensity of the total band measured by ImageJ (NIH). To further confirm the mutations, uncleaved band was sub-cloned into pGEM®-T Easy Vector (Promega Corporation, A1360) and the insertions and deletions (indels) were identified by Sanger sequencing.
Fluorescence-activated cell sorting and Cyto-ID staining
Single-cell suspension for FACS was prepared as described previously [52]. Briefly, Tg(coro1a:DsRed) zebrafish embryos at 3 dpf were digested with GibcoTM Trypsin-EDTA (0.05%) (Thermo Fisher 25,300,062) for 15 min at 28°C and then disassociated with pipetting on ice. After termination of Trypsin with CaCl2 (2 mM), the suspension was filtered using a 40-μm cell strainer (BD Biosciences 352,340) and washed with phosphate-buffered saline (PBS) (VWR Life Science, E404-200TABS) with 1% (vol:vol) fetal bovine serum (Thermo Fisher 26,140,079). FACS of coro1a:DsRed+ leukocyte was then conducted in BD FACSAria III Cell Sorter according to the manufacturer’s instructions. Around 8,000 coro1a:DsRed+ cells were targeted to be sorted using a “purity sort” mode. Autophagic vacuoles and nucleus in sorted cells were immediately stained using CYTO-ID® Autophagy detection kit 2.0 with Hoechst 33,342 Nuclear Stain (Enzo Life Sciences, ENZ-KIT175) at 37°C in dark following the manufacturer’s instructions [21]. CYTO-ID® Autophagy Dye and Hoechst 33,342 co-stained leukocytes were washed with 1X assay buffer before fluorescence microscopic imaging.
Fluorescence microscope imaging
Fluorescent images of transgenic zebrafish embryos, stained zebrafish embryos, or sorted coro1a+ cells stained with CYTO-ID® Autophagy Dye and Hoechst 33,342 were taken by using Zeiss Lightsheet Z.1 Selective Plane Illumination Microscope, Leica TCS SPE Confocal Microscope, or Nikon Stereomicroscope with a Nikon DS-Fi2 Camera as previously described [42]. Zebrafish embryos were mounted in 1.5% low-melting agarose (Sigma-Aldrich, A9045) into a 35-mm glass-bottom confocal dish or glass capillary before imaging. Tricaine (Sigma-Aldrich, A5040) at 0.16 mg/ml in E3 medium (5 mM NaCl, 0.17 mM KCl, 0.33 mM CaCl2, and 0.33 mM MgSO4, pH 7.4) was used as an anesthetic for zebrafish embryos. In addition, Tg(GFP-Lc3) zebrafish embryo was treated with CQ (Selleckchem, S4157) at 100 μM in E3 medium before imaging.
Whole-mount in situ hybridization
WISH was performed on zebrafish embryos following the standard protocol described previously [52]. DIG-labeled anti-sense probes (myb, spi1b, lcp1, hbae1.1, and rag1) were made from the pGEM®-T Easy vector (Promega Corporation, A1360) containing the gene-coding sequences via in vitro transcription using DIG RNA Labeling Kit (Roche 11,175,025,910). Bleaching in a short period of time was used to remove the pigments from the fixed zebrafish embryos.
Mass spectrometry-based proteomics
Total protein was extracted from the CHT region of zebrafish embryos using cell lysis buffer (Sigma-Aldrich, C3228) as previously described [53]. Purified protein was then digested into peptides using Trypsin (Promega, V5111) and desalted using Pierce C18 Spin Columns (Thermo Fisher 89,870). A label-free quantitative proteomics was conducted on Thermo Fisher Orbitrap Fusion Lumos Mass Spectrometer coupled with Dionex UltiMate 3000 RSLCnano. Identification and quantification were processed with Progenesis QI software, and the abundance of proteins was quantified based on three independent experiments and normalized based on total protein. Arbitrary fold change cutoffs of > 1.5 and significance p-values of 0.05 were set for significantly up-regulated or down-regulated proteins.
Acridine orange and phospho-histone H3 staining
Live Tg(coro1a:DsRed) zebrafish embryos at 2 dpf were incubated with AO (Sigma-Aldrich, A6014) at 10 µg/ml in dark for 30 min and washed with fish water before fluorescence imaging. Whole-mount immunostaining of cells undergoing mitosis was conducted in fixed zebrafish embryos using p-H3 primary antibody (Cell Signaling Technology, 9701) following the manufacturer’s protocol [51].
Quantification and statistics
The number of Lc3+ puncta in the muscle was counted in Zeiss ZEN software following the criteria and protocol described in our previous study [42]. Cyto-ID+ autophagic vacuoles were defined by vacuole-like GFP+ fluorescence signals that were distinguished from the background and a similar size of autophagic vacuoles was considered in all the autophagic vacuoles counting in the cells. In addition, ImageJ (NIH) was utilized to measure the relative intensity of proteins in western blot and straighten the WISH images. Data are reported as mean ± standard deviation (S.D.). One-way analysis of variance (ANOVA) with post-hoc Tukey HSD Test, Chi-squared test, and independent t-test were performed where appropriate using Statistical Package for the Social Sciences (SPSS) Version 14.0, and a p-value less than 0.05 was considered statistically significant.
Supplementary Material
Acknowledgements
The zebrafish maintenance was supported by the Fish Model Translational Research Laboratory (HTI, PolyU). Light-sheet or confocal fluorescence microscopic imaging, flow cytometry, and mass spectrometry-based proteomics were supported by the University Research Facility in Life Sciences (ULS, PolyU).
Funding Statement
The work was supported by the Health and Medical Research Fund [03143765]; Health and Medical Research Fund [06173226]; The Hong Kong Polytechnic University Postdoc Matching Fund Scheme Research Grants Council, University Grants Committee [T12-702/20-N].
Disclosure statement
No potential conflict of interest was reported by the author(s).
Data availability statement
MS data are available upon request.
Supplementary material
Supplemental data for this article can be accessed online at https://doi.org/10.1080/15548627.2023.2274251
References
- [1].Jiang P, Mizushima N.. Autophagy and human diseases. Cell Res. 2014;24(1):69–79. doi: 10.1038/cr.2013.161 [DOI] [PMC free article] [PubMed] [Google Scholar]
- [2].Suzuki H, Osawa T, Fujioka Y, et al. Structural biology of the core autophagy machinery. Curr Opin Struct Biol. 2017;43:10–17. doi: 10.1016/j.sbi.2016.09.010 [DOI] [PubMed] [Google Scholar]
- [3].Kuma A, Komatsu M, Mizushima N. Autophagy-monitoring and autophagy-deficient mice. Autophagy. 2017;13(10):1619–1628. doi: 10.1080/15548627.2017.1343770 [DOI] [PMC free article] [PubMed] [Google Scholar]
- [4].Collier JJ, Guissart C, Oláhová M, et al. Developmental consequences of defective ATG7-mediated autophagy in humans. N Engl J Med. 2021;384(25):2406–2417. doi: 10.1056/NEJMoa1915722 [DOI] [PMC free article] [PubMed] [Google Scholar]
- [5].Nishida Y, Arakawa S, Fujitani K, et al. Discovery of Atg5/Atg7-independent alternative macroautophagy. Nature. 2009;461(7264):654–658. doi: 10.1038/nature08455 [DOI] [PubMed] [Google Scholar]
- [6].Codogno P, Mehrpour M, Proikas-Cezanne T. Canonical and non-canonical autophagy: variations on a common theme of self-eating? Nat Rev Mol Cell Biol. 2011;13(1):7–12. doi: 10.1038/nrm3249 [DOI] [PubMed] [Google Scholar]
- [7].Galluzzi L, Green DR. Autophagy-independent functions of the autophagy machinery. Cell. 2019;177(7):1682–1699. doi: 10.1016/j.cell.2019.05.026 [DOI] [PMC free article] [PubMed] [Google Scholar]
- [8].Sawyers CL, Denny CT, Witte ON. Leukemia and the disruption of normal hematopoiesis. Cell. 1991;64(2):337–350. doi: 10.1016/0092-8674(91)90643-D [DOI] [PubMed] [Google Scholar]
- [9].Jung HE, Shim YR, Oh JE, et al. The autophagy protein Atg5 plays a crucial role in the maintenance and reconstitution ability of hematopoietic stem cells. Immune Netw. 2019;19(2):e12. doi: 10.4110/in.2019.19.e12 [DOI] [PMC free article] [PubMed] [Google Scholar]
- [10].Mortensen M, Soilleux EJ, Djordjevic G, et al. The autophagy protein Atg7 is essential for hematopoietic stem cell maintenance. J Exp Med. 2011;208(3):455–467. doi: 10.1084/jem.20101145 [DOI] [PMC free article] [PubMed] [Google Scholar]
- [11].Liu F, Lee JY, Wei H, et al. FIP200 is required for the cell-autonomous maintenance of fetal hematopoietic stem cells. Blood. 2010;116(23):4806–4814. doi: 10.1182/blood-2010-06-288589 [DOI] [PMC free article] [PubMed] [Google Scholar]
- [12].Yang X, Ge L, Wang J. BECN1 modulates hematopoietic stem cells by targeting caspase-3-GSDME-mediated pyroptosis. Blood Sci. 2020;2(3):89–99. doi: 10.1097/BS9.0000000000000051 [DOI] [PMC free article] [PubMed] [Google Scholar]
- [13].Ho TT, Warr MR, Adelman ER, et al. Autophagy maintains the metabolism and function of young and old stem cells. Nature. 2017;543(7644):205–210. doi: 10.1038/nature21388 [DOI] [PMC free article] [PubMed] [Google Scholar]
- [14].Hashimoto M, Umemoto T, Nakamura-Ishizu A, et al. Autophagy is dispensable for the maintenance of hematopoietic stem cells in neonates. Blood Adv. 2021;5(6):1594–1604. doi: 10.1182/bloodadvances.2020002410 [DOI] [PMC free article] [PubMed] [Google Scholar]
- [15].Davidson AJ, Zon LI. The ‘definitive’ (and ‘primitive’) guide to zebrafish hematopoiesis. Oncogene. 2004;23(43):7233–7246. doi: 10.1038/sj.onc.1207943 [DOI] [PubMed] [Google Scholar]
- [16].He C, Bartholomew CR, Zhou W, et al. Assaying autophagic activity in transgenic GFP-Lc3 and GFP-Gabarap zebrafish embryos. Autophagy. 2009;5(4):520–526. doi: 10.4161/auto.5.4.7768 [DOI] [PMC free article] [PubMed] [Google Scholar]
- [17].Howe K, Clark MD, Torroja CF, et al. The zebrafish reference genome sequence and its relationship to the human genome. Nature. 2013;496(7446):498–503. doi: 10.1038/nature12111 [DOI] [PMC free article] [PubMed] [Google Scholar]
- [18].Bill BR, Petzold AM, Clark KJ, et al. A primer for morpholino use in zebrafish. Zebrafish. 2009;6(1):69–77. doi: 10.1089/zeb.2008.0555 [DOI] [PMC free article] [PubMed] [Google Scholar]
- [19].Bedell VM, Wang Y, Campbell JM, et al. In vivo genome editing using a high-efficiency TALEN system. Nature. 2012;491(7422):114–118. doi: 10.1038/nature11537 [DOI] [PMC free article] [PubMed] [Google Scholar]
- [20].Hoshijima K, Jurynec MJ, Klatt Shaw D, et al. Highly efficient CRISPR-Cas9-based methods for generating deletion mutations and F0 embryos that lack gene function in zebrafish. Dev Cell. 2019;51(5):645–657.e4. doi: 10.1016/j.devcel.2019.10.004 [DOI] [PMC free article] [PubMed] [Google Scholar]
- [21].Guo S, Liang Y, Murphy SF, et al. A rapid and high content assay that measures cyto-ID-stained autophagic compartments and estimates autophagy flux with potential clinical applications. Autophagy. 2015;11(3):560–572. doi: 10.1080/15548627.2015.1017181 [DOI] [PMC free article] [PubMed] [Google Scholar]
- [22].Huang G, Zhang F, Ye Q, et al. The circadian clock regulates autophagy directly through the nuclear hormone receptor Nr1d1/Rev-erbα and indirectly via Cebpb/(C/ebpβ) in zebrafish. Autophagy. 2016;12(8):1292–1309. doi: 10.1080/15548627.2016.1183843 [DOI] [PMC free article] [PubMed] [Google Scholar]
- [23].Mortensen M, Watson AS, Simon AK. Lack of autophagy in the hematopoietic system leads to loss of hematopoietic stem cell function and dysregulated myeloid proliferation. Autophagy. 2011;7(9):1069–1070. doi: 10.4161/auto.7.9.15886 [DOI] [PMC free article] [PubMed] [Google Scholar]
- [24].Morishita H, Kanda Y, Kaizuka T, et al. Autophagy is required for maturation of surfactant-containing lamellar bodies in the lung and swim bladder. Cell Rep. 2020;33(10):108477. doi: 10.1016/j.celrep.2020.108477 [DOI] [PMC free article] [PubMed] [Google Scholar]
- [25].Masud S, Prajsnar TK, Torraca V, et al. Macrophages target salmonella by Lc3-associated phagocytosis in a systemic infection model. Autophagy. 2019;15(5):796–812. doi: 10.1080/15548627.2019.1569297 [DOI] [PMC free article] [PubMed] [Google Scholar]
- [26].Lee E, Koo Y, Ng A, et al. Autophagy is essential for cardiac morphogenesis during vertebrate development. Autophagy. 2014;10(4):572–587. doi: 10.4161/auto.27649 [DOI] [PMC free article] [PubMed] [Google Scholar]
- [27].Mawed SA, Zhang J, Ren F, et al. atg7 and beclin1 are essential for energy metabolism and survival during the larval-to-juvenile transition stage of zebrafish. Aquac Fish. 2021;7(4):359–372. doi: 10.1016/j.aaf.2021.01.002 [DOI] [Google Scholar]
- [28].Dong G, Zhang Z, Duan K, et al. Beclin 1 deficiency causes hepatic cell apoptosis via endoplasmic reticulum stress in zebrafish larvae. FEBS Lett. 2020;594(7):1155–1165. doi: 10.1002/1873-3468.13712 [DOI] [PubMed] [Google Scholar]
- [29].Imai K, Hao F, Fujita N, et al. Atg9A trafficking through the recycling endosomes is required for autophagosome formation. J Cell Sci. 2016;129:3781–3791. doi: 10.1242/jcs.196196 [DOI] [PubMed] [Google Scholar]
- [30].Nath S, Dancourt J, Shteyn V, et al. Lipidation of the LC3/GABARAP family of autophagy proteins relies on a membrane-curvature-sensing domain in Atg3. Nat Cell Biol. 2014;16(5):415–424. doi: 10.1038/ncb2940 [DOI] [PMC free article] [PubMed] [Google Scholar]
- [31].Tang Z, Takahashi Y, Chen C, et al. Atg2A/B deficiency switches cytoprotective autophagy to non-canonical caspase-8 activation and apoptosis. Cell Death Differ. 2017;24(12):2127–2138. doi: 10.1038/cdd.2017.133 [DOI] [PMC free article] [PubMed] [Google Scholar]
- [32].Puente C, Hendrickson RC, Jiang X. Nutrient-regulated phosphorylation of ATG13 inhibits starvation-induced autophagy. J Biol Chem. 2016;291(11):6026–6035. doi: 10.1074/jbc.M115.689646 [DOI] [PMC free article] [PubMed] [Google Scholar]
- [33].Jia X-E, Ma K, Xu T, et al. Mutation of kri1l causes definitive hematopoiesis failure via PERK-dependent excessive autophagy induction. Cell Res. 2015;25(8):946–962. doi: 10.1038/cr.2015.81 [DOI] [PMC free article] [PubMed] [Google Scholar]
- [34].Huang HT, Kathrein KL, Barton A, et al. A network of epigenetic regulators guides developmental haematopoiesis in vivo. Nat Cell Biol. 2013;15(12):1516–1525. doi: 10.1038/ncb2870 [DOI] [PMC free article] [PubMed] [Google Scholar]
- [35].Wang J. Beclin 1 bridges autophagy, apoptosis and differentiation. Autophagy. 2008;4(7):947–948. doi: 10.4161/auto.6787 [DOI] [PubMed] [Google Scholar]
- [36].Heideman MR, Lancini C, Proost N, et al. Sin3a-associated Hdac1 and Hdac2 are essential for hematopoietic stem cell homeostasis and contribute differentially to hematopoiesis. Haematologica. 2014;99(8):1292–1303. doi: 10.3324/haematol.2013.092643 [DOI] [PMC free article] [PubMed] [Google Scholar]
- [37].Tan P, He L, Xing C, et al. Myeloid loss of Beclin 1 promotes PD-L1hi precursor B cell lymphoma development. J Clin Invest. 2019;129(12):5261–5277. doi: 10.1172/JCI127721 [DOI] [PMC free article] [PubMed] [Google Scholar]
- [38].Shravage BV, Hill JH, Powers CM, et al. Atg6 is required for multiple vesicle trafficking pathways and hematopoiesis in drosophila. Development. 2013;140(6):1321–1329. doi: 10.1242/dev.089490 [DOI] [PMC free article] [PubMed] [Google Scholar]
- [39].Ulloa BA, Habbsa SS, Potts KS, et al. Definitive hematopoietic stem cells minimally contribute to embryonic hematopoiesis. Cell Rep. 2021;36(11):109703. doi: 10.1016/j.celrep.2021.109703 [DOI] [PMC free article] [PubMed] [Google Scholar]
- [40].Carroll KJ, Esain V, Garnaas MK, et al. Estrogen defines the dorsal-ventral limit of VEGF regulation to specify the location of the hemogenic endothelial niche. Dev Cell. 2014;29(4):437–453. doi: 10.1016/j.devcel.2014.04.012 [DOI] [PMC free article] [PubMed] [Google Scholar]
- [41].Honda S, Arakawa S, Nishida Y, et al. Ulk1-mediated Atg5-independent macroautophagy mediates elimination of mitochondria from embryonic reticulocytes. Nat Commun. 2014;5(1):4004. doi: 10.1038/ncomms5004 [DOI] [PubMed] [Google Scholar]
- [42].Chen XK, Kwan JS, Chang RC, et al. 1-phenyl 2-thiourea (PTU) activates autophagy in zebrafish embryos. Autophagy. 2020;17(5):1222–1231. 2020/04/15. doi: 10.1080/15548627.2020.1755119 [DOI] [PMC free article] [PubMed] [Google Scholar]
- [43].Yan B, Han P, Pan L, et al. Il-1β and reactive oxygen species differentially regulate neutrophil directional migration and basal random motility in a zebrafish injury–induced inflammation model. J Immunol. 2014;192(12):5998–6008. 2014/05/20. doi: 10.4049/jimmunol.1301645 [DOI] [PubMed] [Google Scholar]
- [44].Yoo SK, Deng Q, Cavnar PJ, et al. Differential regulation of protrusion and polarity by PI(3)K during neutrophil motility in live zebrafish. Dev Cell. 2010;18(2):226–236. doi: 10.1016/j.devcel.2009.11.015 [DOI] [PMC free article] [PubMed] [Google Scholar]
- [45].Harvie EA, Green JM, Neely MN, et al. Innate immune response to streptococcus iniae infection in zebrafish larvae. Infect Immun. 2013;81(1):110–121. doi: 10.1128/IAI.00642-12 [DOI] [PMC free article] [PubMed] [Google Scholar]
- [46].Kaizuka T, Morishita H, Hama Y, et al. An autophagic flux probe that releases an internal control. Mol Cell. 2016;64(4):835–849. doi: 10.1016/j.molcel.2016.09.037 [DOI] [PubMed] [Google Scholar]
- [47].Kimmel CB, Ballard WW, Kimmel SR, et al. Stages of embryonic development of the zebrafish. Dev Dyn. 1995;203(3):253–310. 1995/07/01. doi: 10.1002/aja.1002030302 [DOI] [PubMed] [Google Scholar]
- [48].Moreno-Mateos MA, Vejnar CE, Beaudoin JD, et al. Crisprscan: designing highly efficient sgRnas for CRISPR-Cas9 targeting in vivo. Nat Methods. 2015;12(10):982–988. doi: 10.1038/nmeth.3543 [DOI] [PMC free article] [PubMed] [Google Scholar]
- [49].Musso G, Tasan M, Mosimann C, et al. Novel cardiovascular gene functions revealed via systematic phenotype prediction in zebrafish. Development. 2014;141(1):224–235. doi: 10.1242/dev.099796 [DOI] [PMC free article] [PubMed] [Google Scholar]
- [50].Hu Z, Zhang J, Zhang Q. Expression pattern and functions of autophagy-related gene atg5 in zebrafish organogenesis. Autophagy. 2011;7(12):1514–1527. doi: 10.4161/auto.7.12.18040 [DOI] [PMC free article] [PubMed] [Google Scholar]
- [51].Chen XK, Kwan JK, Wong GC, et al. Leukocyte invasion of the brain after peripheral trauma in zebrafish (Danio rerio). Exp Mol Med. 2022;54(7):973–987. doi: 10.1038/s12276-022-00801-4 [DOI] [PMC free article] [PubMed] [Google Scholar]
- [52].Ma AC, Ward AC, Liang R, et al. The role of jak2a in zebrafish hematopoiesis. Blood. 2007;110(6):1824–1830. 2007/06/05. doi: 10.1182/blood-2007-03-078287 [DOI] [PubMed] [Google Scholar]
- [53].Xia J, Kang Z, Xue Y, et al. A single-cell resolution developmental atlas of hematopoietic stem and progenitor cell expansion in zebrafish. Proc Natl Acad Sci U S A. 2021;118(14):118. doi: 10.1073/pnas.2015748118 [DOI] [PMC free article] [PubMed] [Google Scholar]
Associated Data
This section collects any data citations, data availability statements, or supplementary materials included in this article.
Supplementary Materials
Data Availability Statement
MS data are available upon request.