

Abstract
We sought to disentangle effects of the components of a peer-education intervention on self-reported injection risk behaviors among people who inject drugs (n=560) in Philadelphia, US. We examined 226 egocentric groups/networks randomized to receive (or not) the intervention. Peer-education training consisted of two components delivered to the intervention network index individual only: 1) an initial training and 2) “booster” training sessions during 6- and 12-month follow up visits. In this secondary data analysis, using inverse-probability-weighted log-binomial mixed effects models, we estimated the effects of the components of the network-level peer-education intervention upon subsequent risk behaviors. This included contrasting outcome rates if a participant is a network member [non-index] under the network exposure versus under the network control condition (i.e., spillover effects). We found that compared to control networks, among intervention networks, the overall rates of injection risk behaviors were lower in both those recently exposed (i.e., at the prior visit) to a booster (rate ratio [95% confidence interval]: 0.61 [0.46–0.82]) and those not recently exposed to it (0.81 [0.67–0.98]). Only the boosters had statistically significant spillover effects (e.g., 0.59 [0.41–0.86] for recent exposure). Thus, both intervention components reduced injection risk behaviors with evidence of spillover effects for the boosters. Spillover should be assessed for an intervention that has an observable behavioral measure. Efforts to fully understand the impact of peer education should include routine evaluation of spillover effects. To maximize impact, boosters can be provided along with strategies to recruit especially committed peer educators and to increase attendance at trainings.
Clinical Trials Registration:
Clinicaltrials.gov NCT00038688 June 5, 2002
Keywords: Spillover effect, peer education, intervention components, injection risk behaviors, inverse probability weighting
Resumen
Intentamos desenmarañar los efectos de los componentes de una intervención de educación entre pares sobre los comportamientos de inyección de riesgo autorreportados entre personas que se inyectan drogas (n=560; 226 grupos/redes egocéntricos(as)) aleatorizados(as) a recibir (o no) la intervención en Filadelfia, EUA. Dos componentes fueron administrados a índices de redes de intervención: una capacitación inicial y sesiones de “refuerzo” durante visitas de seguimiento. Usando modelos log-binomial de efectos mixtos ponderados por probabilidad inversa, estimamos los efectos de dichos componentes sobre los comportamientos de riesgo posteriores. Encontramos que en comparación con las redes control, en las redes de intervención, las tasas generales de comportamientos de inyección de riesgo fueron más bajas en ambas aquellas expuestas recientemente a un refuerzo (razón de tasas [intervalo de confianza del 95%]: 0.61 [0.46–0.82]) y aquellas no expuestas recientemente (0.81 [0.67–0.98]). Solamente los refuerzos tuvieron efectos derrame (i. e., contraste de las tasas de resultados si es miembro [no índice] de una red en una red con exposición reciente versus bajo la condición control) significativos (p. ej., 0.59 [0.41–0.86] para la exposición reciente).
INTRODUCTION
Peer-driven interventions (PDIs) train individuals who can then serve to educate peers in their social network and community [1], disseminating risk reduction information and promoting behavior change through social networks. PDIs have been successful in improving communication about HIV prevention and in reducing injection and sexual risk behaviors among people who inject drugs (PWID) [2–14]. Despite ample evidence that PDIs can be effective, numerous factors may also work against their effectiveness, such as peer educators’ drug dependence and depression, illness and hospitalization [15], and food and housing insecurity [16, 17]. In addition, there are organizational and systemic obstacles to peer involvement in PDIs [18].
These PDIs have been developed based on social and behavioral theories [2], including behavior change theories such as social cognitive theory [19] and diffusion of innovation theory [20]. They usually consist of educational, behavioral skill, and biomedical intervention components that target different levels of influence. These multicomponent interventions or intervention packages involve 2 stages. First, index participants are recruited and trained to become peer educators or health advocates. Second, these indexes deliver the intervention (e.g., they educate peers, distribute risk reduction materials, etc.) to HIV risk network members (i.e., their injection drug and sexual network members) [2]. Index participants are expected to become change agents within their networks through modeling behaviors and educating peers, which leads to the diffusion of risk reduction norms and behaviors. Thus, while indexes may receive direct benefits (their own behavior may change due to the training), members of their network may receive spillover benefits. That is, network members’ behavior may change because they received the intervention from the indexes, but also because they interact with the indexes and other network members who also received the intervention from the indexes. These interactions and factors influencing behavior change may include sharing knowledge, modeling behaviors, discussing risk reduction, and shifting norms within the social network, involving encouragement from other network members [13, 21]. Effects may arise from various components of a PDI, such as the initial training or from one or more subsequent “booster” training sessions. Untangling the separate effects of PDI components, including their effects on network members, may illuminate which elements drive the effects of the whole package. This is crucial to understanding how networks of PWIDs may be affected by interventions that train peer educators instead of directly intervening with each individual in the network.
Network-randomized controlled trials of PDIs for HIV prevention and risk reduction among PWID have randomized indexes and thus their networks to the PDI or a control of no PDI. Such trials typically assess the overall effect, a contrast of the outcome rates under the network intervention (that is, indexes being offered peer-education training and their network members) to the network control condition (that is, indexes not being offered such a training and their network members) (Table 1) [14]. In addition, the spillover effect, a contrast of the outcome rates if a participant is a network member under the network intervention versus under the network control condition, can be estimated [14]. The direct effect, a contrast of the outcome rates under index status versus network member status if the network is an intervention network, and the composite effect, a contrast of the outcome rates if a participant is an index under the network intervention versus if a participant is a network member under the network control condition, can also be assessed in these trials [14].
Table 1.
Definitions of direct, spillover, composite, and overall effects for the whole PDI package in studies where networks are randomized to receive the intervention or no intervention, with indexes from intervention networks being the only participants directly receiving the intervention, and for exposure to intervention components in the present study.
| Effect name | Definitions for the effects of the randomized whole packagea | Effects of exposure to the intervention components in the present study (initial peer-education training and subsequent booster sessions)b | |
|---|---|---|---|
| Definitions for Components | Parameters of interest using metric for recent exposure to a booster session as example ( = index status, = randomized intervention (initial training), = booster session exposure at prior visit)c | ||
| Direct | Effect among indexes assigned to receive the peer-education training intervention beyond being in an intervention network; a contrast of the outcome rates under index status versus network member status if the network is an intervention network | Effect among indexes exposed to the intervention component beyond being in an exposed network; a contrast of the outcome rates under index status versus network member status if the network is an exposed network | No recent exposure to the 6-/12-month booster (initial intervention only) d Recent exposure to the 6-/12-month booster d |
| Spillovere | A contrast of the outcome rates if a participant is a network member under the network intervention (unexposed themselves to the peer-education training intervention, whose indexes were offered the training) versus under the network control condition | A contrast of the outcome rates if a participant is a network member under the network exposure versus under the network control condition | No recent exposure to the 6-/12-month booster (initial intervention only) Recent exposure to the 6-/12-month booster |
| Composite | Combined direct and disseminated effects; a contrast of the outcome rates if a participant is an index under the network intervention versus if a participant is a network member under the network control condition | Combined direct and disseminated effects; a contrast of the outcome rates if a participant is an index under the network exposure versus if a participant is a network member under the network control condition | No recent exposure to the 6-/12-month booster (initial intervention only) d Recent exposure to the 6-/12-month booster d |
| Overall | A contrast of the outcome rates under the network intervention to the network control condition | A contrast of the outcome rates under the network exposure to the network control condition | No recent exposure to the 6-/12-month booster (initial intervention only) Recent exposure to the 6-/12-month booster |
Adapted from Buchanan et al (AJE 2018) [14].
Exposed network is a network exposed to a given intervention component– initial peer-education training only or subsequent booster sessions in addition to the initial training. Networks exposed to the initial training include all networks randomized to the intervention. Networks only exposed to the initial training were intervention networks that were not exposed to the booster sessions (according to a given metric as described in the Methods). Networks exposed to subsequent booster sessions were intervention networks that were exposed to the booster sessions (according to a given metric as described in the Methods) among those networks randomized to the intervention.
Based on a log-binomial mixed effect outcome model (for further description and definitions of the model, see Supplementary information and [Buchanan et al medRxiv 2022]).
To control for unmeasured baseline differences between indexes and non-indexes, the index effect (i.e., a contrast of the outcome rates under index status versus network member status if the network is a control network; ) is subtracted when estimating the direct and composite effects [14] [Buchanan et al medRxiv 2022] (i.e., on the ratio scale the parameters for the direct and composite effects are divided by this index effect).
Different parameters could be defined to assess spillover effects and we consider this one set of parameters motivated by the partial interference literature [14] [Buchanan et al medRxiv 2022].
Assessing spillover effects is of great public health interest, as it is important to understand the ability of PDIs to affect broader population segments through intervening upon fewer individuals [22]. However, evidence of these effects upon injection risk behaviors is limited. In the HIV Prevention Trials Network (HPTN) 037 Study [7], the PDI had a significant protective overall effect in various injection risk behaviors among networks of PWID in the US and resulted in indexes engaged in more risk reduction conversations. This suggests indexes diffused risk reduction messages into their network, with spillover effects upon network members. This was supported by a subsequent analysis, where a statistically significant protective spillover effect of the entire PDI was observed for the inter-visit rate of any injection risk behavior (rate ratio (RR) [95% confidence interval (CI)]: 0.72 [0.55–0.94]) [14]. Of 4 previous network-randomized controlled trials of PDIs for HIV prevention and risk reduction among PWID [9, 11, 12, 14], spillover effects have been assessed in 2 [9, 12]. In those 2 trials, compared to control network members, intervention network members did not reduce their inter-visit injection risk behaviors in the US (odds ratio (OR) [95% CI]: 1.14 [0.67–1.96]) [9] or in Vietnam (p=.28; OR or RR not reported) [12].
PDIs and other intervention packages are often developed and evaluated using a “treatment package approach,” in which a package comprising all candidate components is assembled and then evaluated without previously confirming whether each individual component had a meaningful effect [23]. Knowing which components (i.e., features of the intervention that can be examined separately) drive the effects of the whole package can help researchers construct optimized intervention packages that are more effective, cost-effective, efficient, and readily scalable [23]. Nevertheless, previous PDIs to reduce injection risk behaviors in PWID have not assessed the separate effects of their intervention components before assembling the intervention package [2, 9, 11, 12, 14].
Methods were recently developed to estimate the separate effects of intervention components through secondary data analysis of network randomized trials in which participants were not compliant with all aspects of their assigned intervention’s components, as was the case in HPTN 037 [Buchanan AL, Hernández-Ramírez RU, Lok J, Vermund SH, Friedman SR, Forastiere L, Spiegelman D. Assessing Direct and Spillover Effects of Intervention Packages in Network-Randomized Studies. medRxiv 2022]. In HPTN 037, the PDI included an initial peer-education training and 2 subsequent boosters for the intervention indexes. Although boosters were expected to increase the intervention’s effectiveness at reducing injection risk behaviors, their potential value to do so was unclear. This changed when booster’s effects were found while researchers were developing novel methods to evaluate package interventions in network-randomized trials and used HPTN 037 trial data as the illustrative example [Buchanan et al medRxiv 2022].
In this study, we apply those methods and expand on prior work by examining cumulative metrics of exposure to network-level boosters. We account for censoring due to study dropout of participants, and we refine the covariate selection to control for confounding. Thus, we provide an extensive and thorough study to disentangle the overall, direct, spillover, and composite effects of the initial training and subsequent boosters on injection risk behavior among the US participants of HPTN 037. We hypothesized that both recent and cumulative exposure to the booster(s) were important contributors to the observed overall and spillover effects of the PDI.
METHODS
Study design and participants
The HPTN 037 Study [7] evaluated a PDI to promote HIV risk reduction among PWID and their immediate injection drug and sexual network members in Philadelphia, US and Chiang Mai, Thailand. Because intervention effects on injection risk behaviors were observed in Philadelphia but not in Chiang Mai, where the government’s “war” on drugs affected the study [7, 13], the present analysis was restricted to Philadelphia following previous analyses [13, 14] [Buchanan et al medRxiv 2022].
In Philadelphia, the PWID ≥18 years old who volunteered as index participants had been identified by outreach workers from neighborhoods with high prevalence of HIV/AIDS and drug use/sales [7]. Indexes had injected ≥12 times in the previous 3 months and were not in a methadone maintenance program. These individuals served as the initial point of contact into their HIV risk network; they were provided coupons and were asked to recruit ≥2 adults with whom they had injected drugs or had sex within the prior 3 months. Indexes (n=232), who recruited ≥1 eligible network member and who had had an HIV-negative test within 60 days of randomization, and the non-overlapping egocentric networks around each index (n=464 members) were randomized to the intervention or control (See Supplementary Figure S.1 for CONSORT diagram [24]). Details about randomization, blinding, sample size planning, contamination control, and other design aspects, including those recommended by reporting guidelines [24], are discussed in the HPTN 037 primary publication [7] and protocol [25]. Following randomization, follow-up visits occurred at 6-month intervals for up to 30 months. Network members were assumed to be part of their index’s network throughout follow-up. At baseline, 232 indexes and 419 network members reported injection drug use in the previous 6 months. Of those, we included the 201 indexes and 359 network members with at least 1 post-baseline follow-up visit/outcome assessment in our analyses. The remaining 31 indexes and 60 network members with no follow-up were included only in an analysis to model censoring.
Intervention
Indexes randomized to the intervention were offered a peer education training. This consisted of an initial training (i.e., six 2-hour, small-group training sessions during a four-week period) followed by two 1-to-2-hour additional small-group “booster” training sessions at the 6- and 12-month follow-up visits [7]. The intervention drew upon theories of social learning [19], social influence [26], social identity [27], and social norms [28] and diffusion of innovations [20], as well as upon prior evidence suggesting that peer education can influence risk behaviors of both the educators and those whom they educate [7, 25]. Training included instruction in harm reduction with safer injection behavior, developing and practicing communication skills and strategies to approach others, role-playing to practice peer education and risk reduction skills, problem-solving exercises, and outreach plan development. The boosters provided opportunities to troubleshoot, share experiences and lessons learned, improve outreach skills, and maintain motivation. All intervention and control participants received voluntary HIV counseling and testing. For our study, the initial training and boosters were considered to be two components, and only the intervention networks could be exposed to them; intervention networks were assumed to be exposed to the initial training; and subsequent network-level booster exposure was determined by indexes’ booster visit attendance (see Supplementary information).
Measures and outcome
Interviewers administered surveys to obtain information on injection risk behaviors, injection and non-injection drug use, alcohol use, and demographics. The primary outcome at each visit was self-report of any injection risk behaviors in the last month, including sharing injection needles, cookers, cotton, and/or rinse water and/or injecting drugs from one syringe to another, with people not known well, and/or in a shooting gallery/abandoned building/car/public place. The full intervention package resulted in reduction of these risk behaviors [7].
Statistical analysis
Descriptive statistics were used to summarize characteristics of our study population at baseline (with chi-squared tests used to assess differences between network intervention groups) and exposure to the booster(s) in the intervention networks.
To estimate RRs for the overall effect of the package components on the rate of injection risk behaviors, we used inverse-probability-weighted (IPW) [29, 30] log-binomial mixed effects models [31–33] in the individual-level data, with fixed effects for the randomized network-level intervention (initial training), a metric of the time-varying network-level exposure to the 6-/12-month booster(s), visit month (continuous), and selected baseline covariates (See additional details under Statistical Methods in the Supplementary information and in Tables S.1 and S.2). We included random intercepts to account for clustering by network and repeated measures over visits (with independent correlation structure), and we used robust sandwich variance estimators to construct 95% Wald type CI [32–35]. To estimate RRs for direct, spillover, and composite effects of the initial training and booster(s) as defined in Table 1 and Figure 1, we added index status and its pairwise interactions with each package component in the models [14] [Buchanan et al medRxiv 2022].
Figure 1. Overall, direct, spillover, and composite effects of exposure to intervention components in the present study (initial peer-education training and subsequent booster sessions), defined in Table 1.
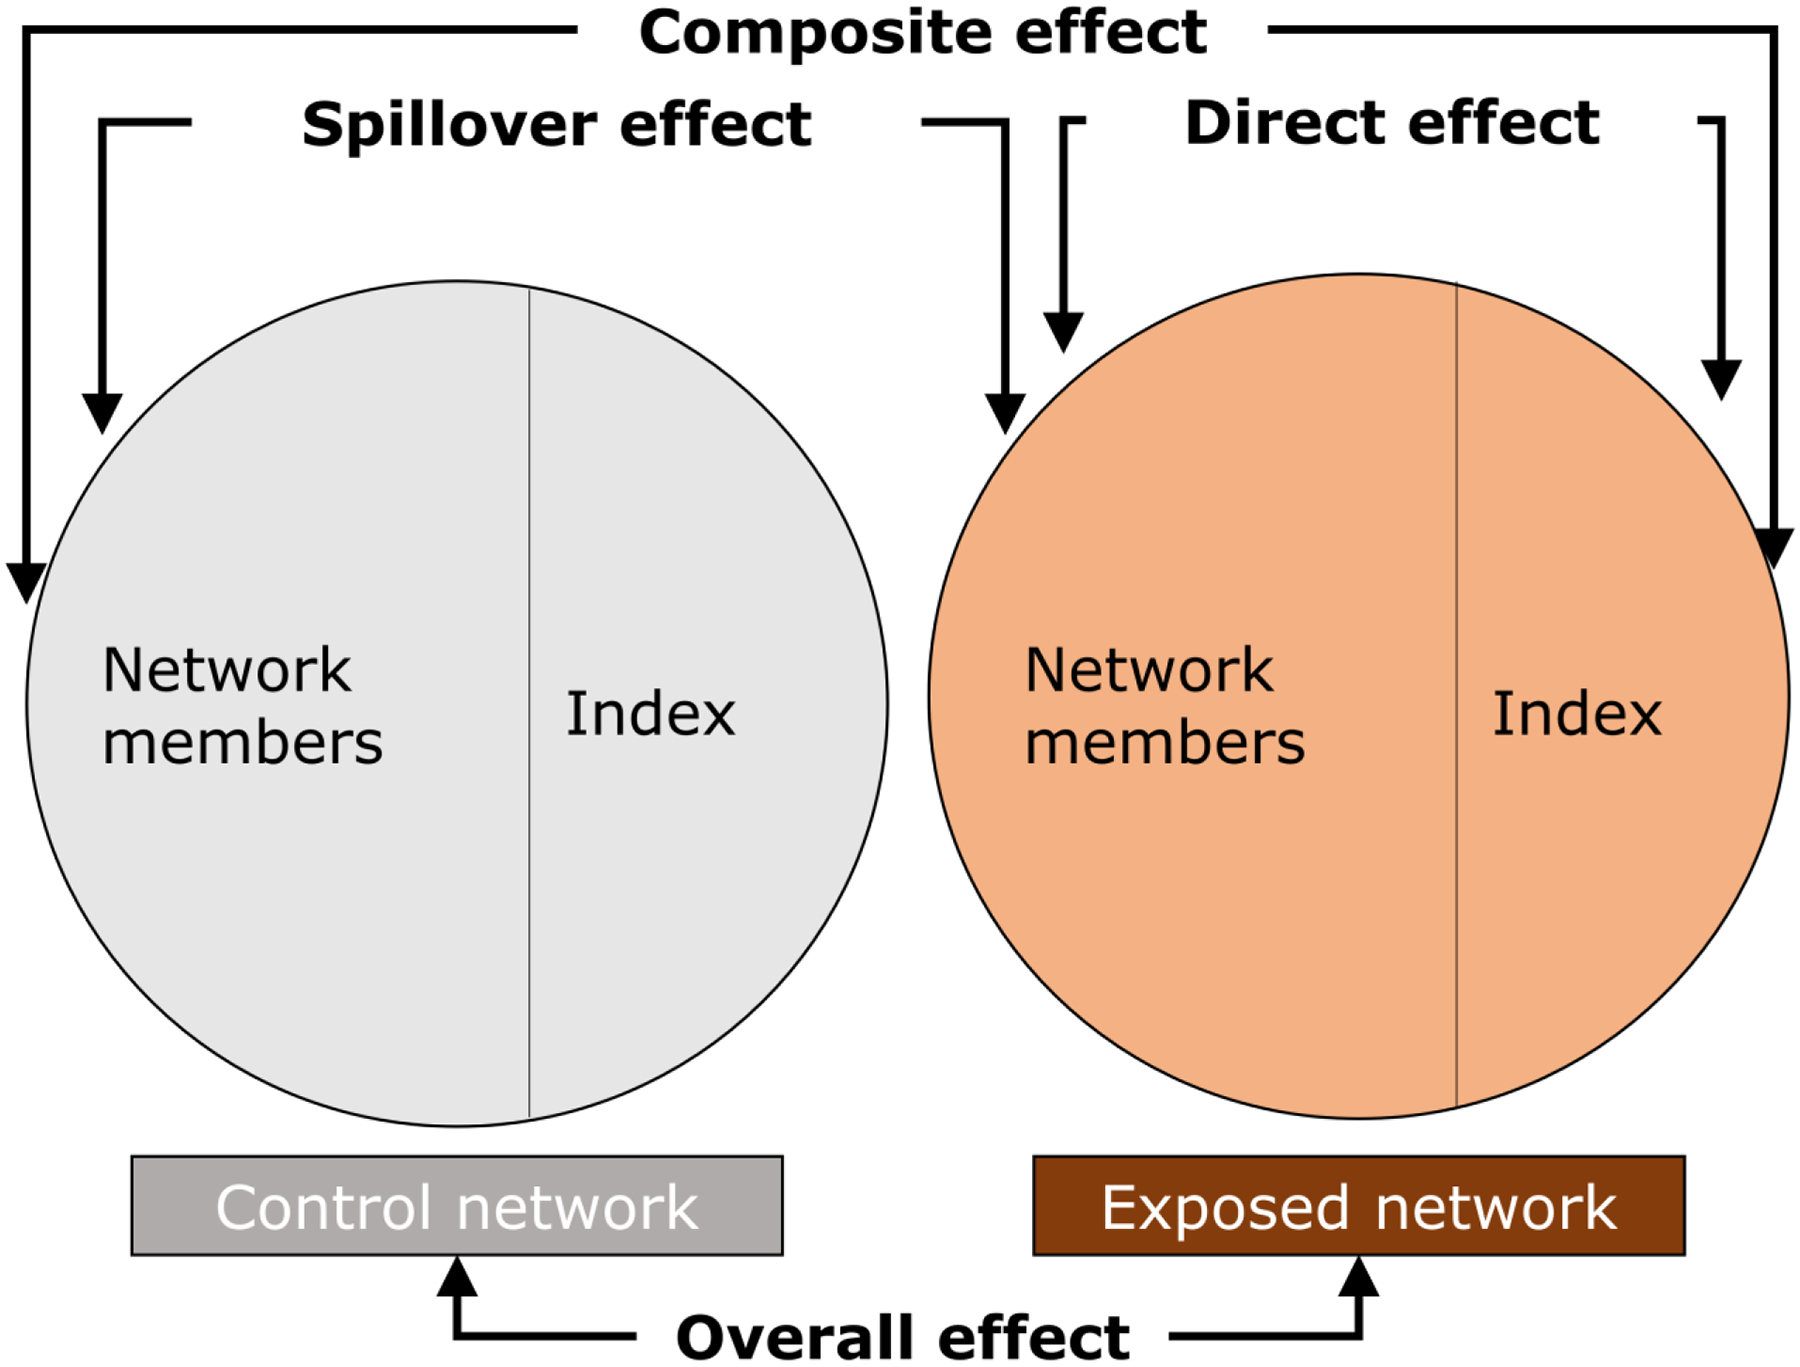
Adapted from [14, 42]. To control for unmeasured baseline differences between indexes and non-indexes, the index effect (i.e., a contrast of the outcome rates under index status versus network member status if the network is a control network) is subtracted when estimating the direct and composite effects using the outcome model [14] [Buchanan et al medRxiv 2022].
We analyzed the effect of the time-varying network-level boosters in 3 ways: 1) recent exposure to the 6-/12-month booster (i.e., exposed at the prior visit, at the start of the current interval; yes, no); 2) ever exposed before the current visit when the outcome was ascertained (i.e., by the start of the current interval; yes, no); and 3) total number of boosters received before the current visit (1 [yes, no] and 2 boosters [yes, no] as separate indicators; and as a continuous variable [0, 1, 2] to evaluate “dose-response” effects).
In our IPW models, to control for both post-randomization time-varying confounding for the non-randomized booster exposure and selection bias by possibly differential censoring due to participant dropout, we used weights corresponding to the inverse of the estimated probability of both the network-level booster exposure and individual-level censoring conditioned on prior booster exposure and baseline and time-varying covariates [29, 30]. To obtain these combined stabilized weights (SWs), we calculated the network-level booster exposure SWs and individual-level censoring SWs separately, then multiplied them together. For the booster exposure SW, covariates included index member continuous age and binary covariates (yes, no) for non-White race, unemployment, and heroin injection (yes, no) in the last month at baseline; baseline and time-varying (i.e. at prior visit) index member any prior injection risk behaviors and daily drug injection in the last month and spending night(s) on street/car/park/abandoned building in last 6 months; baseline network-level prevalence of reporting any prior injection risk behaviors; and baseline and time-varying binary covariates (≤median, >median) for network-level prevalence for reporting speedball injection, opiate smoking, and benzodiazepine use in the last month. For the censoring SWs, we included individual-level baseline sex, continuous age and age-squared, Hispanic ethnicity (yes, no), and non-White race, and baseline and time-varying (i.e., at prior visit) any prior injection risk behaviors (yes, no) and daily drug injection (yes, no) in the last month, and usual alcohol consumption (sometimes/always got drunk when drinking, never got drunk/does not drink alcohol). Our IPW outcome models included all the baseline covariates used to estimate the SWs [36], which also included individual-level covariates that help to control for measured confounding of the effect of self-selected index status on the outcome. Lastly, to control for unmeasured baseline differences between indexes and non-indexes, the direct and composite estimators also subtracted the estimated index effect (i.e., a contrast of the outcome rates under index status versus network member status if the network is a control network) [14] [Buchanan et al medRxiv 2022]. Moreover, in a sensitivity analysis of censoring, we considered participants to be censored at their first missed visit instead of when they dropped out of the study.
For comparison, we also fit standard, unweighted, multivariable models: 1) a model adjusted for sex, age, and race/ethnicity covariates mentioned above (simple standard outcome model); and 2) a model additionally adjusted for other selected baseline individual-level covariates plus time-varying individual-level, index member, and network-level covariates mentioned above (full standard outcome model), although standard methods do not appropriately account for time-varying confounding and censoring. We also fit an IPW model with SWs that ignored censoring due to study dropout. When our outcome models failed to converge with a binomial distribution, we used the Poisson distribution [37, 38]. If a covariate value was missing, the last available non-missing value was used [39]. We used an alpha of 0.05 to determine statistical significance of the component effects. We performed the analysis in SAS 9.4 (SAS Institute Inc., Cary, NC).
RESULTS
Of the 560 participants with post-baseline follow-up included in our analysis (Table 2), most were male (71%) and Black (49%) or non-Hispanic White (43%). At baseline, most participants were >35 years (71%), single (60%), and unemployed (82%), consumed alcohol (60%), and had completed high school/vocational/trade education at most (80%). Fifty-five percent of participants smoked crack, 98% injected drugs, and 85% reported ≥1 injection risk behavior in the last month at baseline. Overall, baseline characteristics were similar across network intervention groups and index status. There were no important differences between the 560 participants with and the 91 without post-baseline follow-up for most characteristics (Supplementary information Table S.3). Most intervention network participants with follow-up after the booster visits were in networks exposed to at least 1 booster (96% of indexes and 91% of network members were exposed to least 1; 97% of indexes and 93% of network members were exposed to 2 boosters). The injection risk behavior rate was 32% overall and 41%, 32%, 27%, 24%, and 19% at each of the 6-month intervals, respectively.
Table 2.
Individual-level demographics and baseline HIV risk behavior by network group and role among PWID participating in the HPTN 037 Study, Philadelphia, US (December 2002 to July 2006) included in the present analysis
| Characteristics | All (n=560) | Intervention network (n=270) | Control network (n=290) | Chi-square | Index | Chi-square | Network member | Chi-square | ||
|---|---|---|---|---|---|---|---|---|---|---|
| Intervention network (n=97) | Control network (n=104) | Intervention network (n=173) | Control network (n=186) | |||||||
| n (%) | n (%) | n (%) | n (%) | n (%) | n (%) | n (%) | ||||
| Demographics | ||||||||||
| Male | 395 (71) | 190 (70) | 205 (71) | 0.01 | 73 (75) | 86 (83) | 1.68 | 117 (68) | 119 (64) | 0.53 |
| Age (years) | ||||||||||
| 18–35 | 165 (29) | 70 (26) | 95 (33) | 3.39 | 27 (28) | 34 (33) | 1.65 | 43 (25) | 61 (33) | 2.76 |
| >35–50 | 302 (54) | 155 (57) | 147 (51) | 58 (60) | 53 (51) | 97 (56) | 94 (51) | |||
| >50–68 | 93 (17) | 45 (17) | 48 (17) | 12 (12) | 17 (16) | 33 (19) | 31 (17) | |||
| Race/ethnicity | ||||||||||
| Black | 272 (49) | 148 (55) | 124 (43) | 12.15** | 49 (51) | 45 (43) | 1.60 | 99 (57) | 79 (42) | 11.29** |
| Non-Hispanic White | 240 (43) | 108 (40) | 132 (46) | 43 (44) | 50 (48) | 65 (38) | 82 (44) | |||
| Non-Black/Hispanic White/Other | 48 (9) | 14 (5) | 34 (12) | 5 (5) | 9 (9) | 9 (5) | 25 (13) | |||
| Marital Status | ||||||||||
| Single | 337 (60) | 155 (57) | 182 (63) | 2.22 | 53 (55) | 72 (69) | 6.69 | 102 (59) | 110 (59) | 0.07 |
| Married | 62 (11) | 33 (12) | 29 (10) | 13 (13) | 9 (9) | 20 (12) | 20 (11) | |||
| Living with partner | 47 (8) | 22 (8) | 25 (9) | 10 (10) | 12 (12) | 12 (7) | 13 (7) | |||
| Separated/divorced/widowed | 114 (20) | 60 (22) | 54 (19) | 21 (22) | 11 (11) | 39 (23) | 43 (23) | |||
| Education | ||||||||||
| Any secondary schooling or less | 186 (33) | 76 (28) | 110 (38) | 6.35* | 24 (25) | 40 (38) | 4.36 | 52 (30) | 70 (38) | 2.72 |
| High school or vocational/trade | 265 (47) | 135 (50) | 130 (45) | 51 (53) | 45 (43) | 84 (49) | 85 (46) | |||
| Any college/university | 109 (19) | 59 (22) | 50 (17) | 22 (23) | 19 (18) | 37 (21) | 31 (17) | |||
| Unemployed | 459 (82) | 225 (83) | 234 (81) | 0.66 | 79 (81) | 80 (77) | 0.62 | 146 (84) | 154 (83) | 0.17 |
| Housing in the last 6 months | ||||||||||
| Spent time in drug treatment program | 164 (29) | 66 (24) | 98 (34) | 5.90* | 18 (19) | 22 (21) | 0.21 | 48 (28) | 76 (41) | 6.82** |
| Lived in the street/car/park/abandoned buildinga | 132 (24) | 67 (25) | 65 (22) | 0.42 | 25 (26) | 25 (24) | 0.08 | 42 (24) | 40 (22) | 0.36 |
| Spent time in jail/prisona | 89 (16) | 48 (18) | 41 (14) | 1.35 | 23 (24) | 13 (13) | 4.29* | 25 (14) | 28 (15) | 0.03 |
| Alcohol usea | ||||||||||
| Do not drink | 224 (40) | 103 (38) | 121 (42) | 3.03 | 45 (46) | 43 (41) | 9.27* | 58 (34) | 78 (42) | 3.26 |
| Never drink enough to get drunk | 148 (26) | 67 (25) | 81 (28) | 16 (16) | 35 (34) | 51 (29) | 46 (25) | |||
| Sometimes drink enough to get drunk | 131 (23) | 70 (26) | 61 (21) | 26 (27) | 16 (15) | 44 (25) | 45 (24) | |||
| Always drink enough to get drunk | 56 (10) | 30 (11) | 26 (9) | 10 (10) | 10 (10) | 20 (12) | 16 (9) | |||
| Non-injection drug use in the last month | ||||||||||
| Smoked crack | 307 (55) | 161 (60) | 146 (50) | 4.87* | 68 (70) | 52 (50) | 8.43** | 93 (54) | 94 (51) | 0.37 |
| Snorted/sniffed cocaine | 91 (16) | 43 (16) | 48 (17) | 0.04 | 15 (15) | 17 (16) | 0.03 | 28 (16) | 31 (17) | 0.02 |
| Smoked opiates | 198 (35) | 107 (40) | 91 (31) | 4.16* | 35 (36) | 28 (27) | 1.96 | 72 (42) | 63 (34) | 2.29 |
| Used benzodiazepines | 292 (52) | 128 (47) | 164 (57) | 4.69* | 47 (48) | 57 (55) | 0.81 | 81 (47) | 107 (58) | 4.12* |
| Injection drug use last monthb | ||||||||||
| Injected every day | 333 (59) | 154 (57) | 179 (62) | 1.27 | 59 (61) | 68 (65) | 0.45 | 95 (55) | 111 (60) | 0.83 |
| Injected heroin | 516 (92) | 247 (91) | 269 (93) | 0.32 | 89 (92) | 97 (93) | 0.17 | 158 (91) | 172 (92) | 0.16 |
| Injected heroin with cocaine | 204 (36) | 110 (41) | 94 (32) | 4.19* | 44 (45) | 35 (34) | 2.88 | 66 (38) | 59 (32) | 1.63 |
| Injected cocaine | 192 (34) | 96 (36) | 96 (33) | 0.37 | 36 (37) | 40 (38) | 0.04 | 60 (35) | 56 (30) | 0.86 |
| Any HIV injection risk behavior in the last monthb | 477 (85) | 226 (84) | 251 (87) | 0.90 | 84 (87) | 93 (89) | 0.38 | 142 (82) | 158 (85) | 0.54 |
p<.05
p<.01
Information from 1 participant was missing
Reported among people reporting injection drug use in the last month (n=547)
In IPW models with SWs for both the booster exposure and censoring (Table 3), compared to control networks, among intervention networks (i.e., networks that received the initial training), there was an estimated 39% overall reduction (RR [95% CI]: 0.61 [0.46–0.82]) in the rate of injection risk behaviors among networks recently exposed to the 6- or 12-month booster and a 19% overall reduction (0.81 [0.67–0.98]) among networks not recently exposed to the 6- or 12-month booster. When we analyzed the cumulative booster exposure metrics (i.e., ever exposed and number of boosters before current visit), we also observed significant overall rate reductions for the booster compared to the control, with a slightly larger magnitude for the estimate of 1 than to 2 boosters; however, the effect for the initial training did not achieve statistical significance. Regarding spillover effects of the boosters, there was an estimated 41% reduction (0.59 [0.41–0.86]) in the rates of injection risk behaviors if a participant was a network member within a network recently exposed to the 6- or 12-month booster versus within a control network. Compared to the estimated rate reduction for the spillover effects for the recent booster exposure (i.e., 41%), the protective spillover effects were similar in magnitude for any booster (37% reduction), but smaller for 2 boosters before the current visit (27% reduction) and larger when only 1 booster was received before the current visit (48% reduction). We also observed statistically significant composite effects for the 3 different booster exposure metrics–e.g., an estimated 35% reduction in the outcome rates if a participant is an index within a network recently exposed to the 6- or 12-month booster versus if a participant is a network member within a control network (0.65 [0.45–0.94]). We did not observe statistically significant direct effects for any of the booster metrics nor spillover, composite, or direct effects for receiving the initial training only (i.e., received the initial training and were not recently exposed to a booster, or were never exposed to a booster). Similar results were found in simple standard outcome models and IPW models that ignored censoring (Supplementary information Table S.4); as well as in the sensitivity analysis of censoring, except no statistically significant overall effects were observed for receiving the initial training only (Supplementary information Table S.5). In contrast, in the full standard outcome models, as compared to the IPW models with SWs for both the booster exposure and censoring, boosters’ estimated overall, spillover, and composite effects were attenuated (Supplementary information Table S.6). The estimated index effect, subtracted to estimate the direct and composite effects, was not statistically significant (e.g., 1.17 [0.91–1.49] in the IPW model with the recent booster exposure metric).
Table 3.
Overall, direct, spillover, and composite effects of the initial peer-educator training and subsequent 6-/12-month booster sessions on the rate of any HIV injection risk behavior among PWID participating in the HIV Prevention Trials Network 037 Study, Philadelphia, US (n/N=560/1598)
| Components’ effects in models with different time-varying network-level booster exposure metrics | Estimated Effectsa | |||
|---|---|---|---|---|
| Overallb | Directc | Spilloverc | Compositec | |
| RR (95% CI) | RR (95% CI) | RR (95% CI) | RR (95% CI) | |
| Model 1. Recent exposure to the 6-/12-month booster (i.e., at the prior visit; at the start of the current interval) | ||||
| Standard multivariable, baseline adjusted modeld | ||||
| Intervention network (exposed to the initial training) | ||||
| Not recently exposed to the 6-/12-month booster | 0.84 (0.69, 1.03) | 0.94 (0.66, 1.35) | 0.86 (0.67, 1.10) | 0.81 (0.60, 1.10) |
| Recently exposed to the 6-/12-month booster | 0.64 (0.47, 0.87) | 1.09 (0.68, 1.76) | 0.62 (0.41, 0.91) | 0.67 (0.46, 0.99) |
| IPW modele,f | ||||
| Intervention network (exposed to the initial training) | ||||
| Not recently exposed to the 6-/12-month booster | 0.81 (0.67, 0.98) | 0.88 (0.60, 1.30) | 0.85 (0.66, 1.09) | 0.75 (0.56, 1.01) |
| Recently exposed to the 6-/12-month booster | 0.61 (0.46, 0.82) | 1.09 (0.68, 1.76) | 0.59 (0.41, 0.86) | 0.65 (0.45, 0.94) |
| Model 2. Ever exposed to a booster before the current visit (i.e., by the start of the current interval) | ||||
| Standard multivariable, baseline adjusted modeld | ||||
| Intervention network (exposed to the initial training) | ||||
| Never exposed to a booster before the current visit | 0.89 (0.72, 1.11) | 1.00 (0.69, 1.46) | 0.89 (0.70, 1.15) | 0.90 (0.66, 1.22) |
| Ever exposed to a booster before the current visit | 0.62 (0.45, 0.86)f | 0.95 (0.60, 1.51) | 0.64 (0.43, 0.96) | 0.61 (0.41, 0.90) |
| IPW modele,f | ||||
| Intervention network (exposed to the initial training) | ||||
| Never exposed to a booster before the current visit | 0.88 (0.72, 1.07) | 0.99 (0.67, 1.47) | 0.88 (0.68, 1.14) | 0.87 (0.65, 1.18) |
| Ever exposed to a booster before the current visit | 0.61 (0.46, 0.82) | 0.92 (0.57, 1.46) | 0.63 (0.44, 0.91) | 0.58 (0.39, 0.85) |
| Model 3. Number of booster(s) received before the current visit (i.e., by the start of the current interval) | ||||
| Standard multivariable, baseline adjusted modeld | ||||
| Intervention network (exposed to the initial training) | ||||
| Never exposed to a booster before the current visit | 0.88 (0.72, 1.09) | 1.01 (0.69, 1.46) | 0.88 (0.69, 1.13) | 0.89 (0.65, 1.21) |
| Ever exposed to 1 booster before the current visit | 0.57 (0.41, 0.79) | 1.23 (0.70, 2.17) | 0.53 (0.34, 0.81) | 0.65 (0.42, 1.01) |
| Ever exposed to 2 boosters before the current visit | 0.68 (0.46, 1.01)f,* | 0.78 (0.47, 1.29) | 0.75 (0.48, 1.17) | 0.59 (0.37, 0.95)* |
| IPW modele,f | ||||
| Intervention network (exposed to the initial training) | ||||
| Never exposed to a booster before the current visit | 0.87 (0.71, 1.06) | 0.99 (0.67, 1.47) | 0.87 (0.67, 1.13) | 0.86 (0.64, 1.17) |
| Ever exposed to 1 booster before the current visit | 0.57 (0.42, 0.77) | 1.23 (0.69, 2.22) | 0.52 (0.34, 0.79) | 0.64 (0.41, 0.98) |
| Ever exposed to 2 boosters before the current visit | 0.66 (0.46, 0.94)** | 0.74 (0.45, 1.22) | 0.73 (0.48, 1.09)* | 0.54 (0.33, 0.86)* |
IPW, inverse-probability-weighted; 95% CI, 95% confidence interval; RR, rate ratio.
P for trend<.05
P for trend<.01
Overall effects, a contrast of the outcome rates under the network exposure to the network control condition; direct effects, a contrast of the outcome rates under index status versus network member status if the network is an exposed network; spillover effects, a contrast of the outcome rates if a participant is a network member under the network exposure versus under the network control condition; composite effects, a contrast of the outcome rates if a participant is an index under the network exposure versus if a participant is a network member under the network control condition.
Components were simultaneously included in a standard or an IPW log-binomial mixed effects outcome model adjusted for visit time and selected baseline covariates.
Model included covariates above plus index status and pairwise interaction terms between this and each of the 2 package components.
Adjusted for individual-level demographics—sex, Hispanic ethnicity (yes, no), non-White race (yes, no), and baseline continuous age (years) and age-squared.
With stabilized weights for booster session exposure and censoring and adjusted for baseline covariates: individual-level demographics above and reporting injection risk behaviors (yes, no) and injected drugs daily (yes, no) in the last month and usual alcohol consumption (sometimes/always got drunk when drinking and never got drunk when drinking/does not drink); index member continuous age (years) and binary covariates (yes, no) for reporting non-White race, unemployment, any injection risk behaviors, injected drugs daily, injected heroin in the last month, and spent night on street/car/park/abandoned building in the last 6 months; and network-level prevalence of reporting any injection risk behaviors and binary covariates (≤median, >median) for network-level prevalence of injected speedball, smoked opiates, and used benzodiazepines in the last month.
Log-Poisson models were used as log-binomial models did not converge.
DISCUSSION
For the HPTN 037’s PDI package, comprising an initial peer-educator training and subsequent booster training sessions, we disentangled direct, spillover, composite, and overall effects of those package components upon the rate of self-reported injection risk behaviors among US PWID. We found that the initial training and boosters were associated with an overall reduction in the rate of injection risk behaviors. We did not observe statistically significant direct, spillover, or composite effects for receiving the initial training only. While we did not observe a significant direct effect for the exposure to the boosters, we did find evidence that the boosters resulted in meaningful spillover and composite reduction in the rate of any injection risk behaviors.
Overall effect
We found evidence that the previously observed protective overall effects of the whole PDI package in HPTN 037 [7, 14] were likely driven by the overall effects upon both networks receiving the initial training only and those additionally receiving the boosters. As the overall effects of receiving the initial training only were no longer statistically significant when the booster exposure was evaluated as a cumulative exposure metric, our results suggest that ever being exposed to a booster after having received the initial training could be more important than receiving the initial training alone. This highlights the crucial role of boosters in prolonging the benefits of the intervention. In HPTN 037, the whole PDI was also associated with increased engagement in HIV prevention conversations by the indexes with their network members [7], and with an overall reduction of risky social norms [13] likely resulting from modeling and discussing injection risk reduction. Diffusion of intervention terms, although limited, was also observed [40]. In a separate analysis [41], the whole PDI was associated with an increased recall of intervention knowledge/information, after accounting for index status, but recall of that information explained less than half of the overall effect of the whole PDI upon injection risk behaviors. Thus, risk reduction discussions, social norms change, intervention knowledge, behavioral modeling, and other factors may have contributed to the effects of the PDI.
Spillover effect
We found that intervention network members received benefits of the boosters delivered to their indexes. A protective spillover effect was not observed for those receiving the initial training only, indicating that the previously observed spillover effects of the whole PDI package [14] were likely sustained by the boosters. The boosters’ spillover effect may have resulted in increased self-efficacy and response efficacy of the network members, as well as a reduction in risky social norms, developed by the additional exposure to the intervention provided by the boosters. If social norms changed, then the peer educator would not need to be present when network members were injecting for the lower-risk behaviors to be encouraged. Based on the diffusion of innovations [20], index individuals act as early innovators who start to diffuse the innovation, which then diffuses to other network members who are early adopters in their social networks. Role modeling is a key element in this process. Modeling behaviors may increase network members’ self-efficacy and response efficacy, according to social cognitive theory [19]. By engaging in and endorsing risk reduction behaviors, indexes and network members may influence social norms for those behaviors [21]. Moreover, network members may have begun to influence each other’s behaviors directly. Our analysis with the cumulative booster exposure metric suggests that spillover effects impacted outcomes beyond the subsequent visit after exposure to the booster occurred. Although the two boosters consisted of the same intervention approach and materials, the magnitude of the protective spillover effect was larger for being exposed to one than to two boosters, suggesting the 6-month booster as possibly the main driver of the spillover effects of the PDI. This could indicate that a more intense or frequent booster may be needed for the index to maintain the knowledge, communication skills, and motivation to promote HIV prevention. Alternatively, this result could indicate that there is a threshold point beyond which further exposure to the intervention may have diminishing effects in network members. Once network norms change, there may be little need for additional exposure. For peer educators, it is critical to possess the necessary skills to communicate the intervention and provide appropriate social support without eliciting reactance, impugning self-efficacy, or undermining autonomy and control [21]. Still, this finding should be interpreted with caution, as the confidence intervals are wide and overlap for one and two boosters, highlighting uncertainty in these estimates. The two other previous PDI trials for injection risk reduction in PWID that assessed spillover effects did not evaluate the separate effects of their PDI components [9, 12]. In contrast to our findings, those studies found that the intervention package did not reduce injection risk behaviors among intervention network members compared to control network members. Although published evidence of the spillover effects of PDIs is limited, our results and previous results from HPTN 037 [14] indicate that PDIs can lead to meaningful spillover to PWIDs’ network members.
Composite and direct effect
We found evidence of a composite effect for the boosters exposure with initial training, but not for receiving the initial training only. This suggests that the boosters component led to reductions in injection risk behaviors if a participant was an index under the network exposure to the booster(s) versus if a participant is a network member under the network control condition. It also suggests that the previously observed protective composite effect for the whole PDI [14] was largely increased by this component. As for the whole PDI, we did not find evidence of direct effects (i.e., effect on intervention indexes beyond being in an intervention network) of exposure to the individual package components. This indicates that spillover may have driven the observed composite effect (i.e., combined direct and spillover effects). It has been suggested that inhabiting a social role can change one own’s behaviors and that such changes are more likely than among people not engaging in such roles [21]. The lack of significant direct effects suggests that intervention indexes, although they reduced their own injection risk behaviors as reflected by the protective overall effects, may not have experienced additional benefits for reducing of injection risk behaviors further from being peer educators while accounting for potential confounding due to index self-selection. Our results should be interpreted with caution given the uncertainty of that estimate, suggested by its wide confidence interval. To the best of our knowledge, the composite and direct effects of PDIs on injection risk reduction in PWID as defined here have only been previously studied in HPTN 037 [14] [Buchanan et al medRxiv 2022].
Our methods assumed both individuals are only part of one network (i.e., no overlap) and no contamination between networks. By design, although participants could only participate in 1 network and no index could participate as a network member for another index, there is certainly the possibility of HIV risk connections and overlap among networks, since recruitment occurred in a single city. Unobserved connectivity between intervention and control networks could result in sharing of the intervention knowledge (i.e., contamination), and this may have biased the effects evaluated herein [22]. However, no evidence of contamination was observed in HPTN 037 [40]. Future studies could include networks from geographically separate regions in order to minimize connections between networks or measure connections among all participants in order to address them in the analysis.
Unmeasured confounding of the relationship between the whole intervention package and the outcome is unlikely, as the intervention assignment was randomized. As index status was not randomized but self-selected, in order to control for unmeasured baseline confounding of index status, we subtracted the estimated index effect in order to quantify direct and composite effects [14] [Buchanan et al medRxiv 2022]. Furthermore, we included selected baseline individual-level covariates in our models to control for measured confounding of the effect of self-selected index status upon the outcome. We also used SWs to account for time-varying confounding and censoring [29, 30]. Nevertheless, there may be unmeasured confounding of the package components because these were not randomly assigned to networks as individual components. Our outcome assessment relied upon self-report. Assessment of spillover effects in PDIs that have an observable behavioral component, as well as other non-self-reported outcomes, is warranted.
CONCLUSIONS
Driven by the initial training and the subsequent booster sessions components of the HPTN 037’s PDI led to an overall reduction in injection risk behaviors among HIV risk PWIDs’ networks. In intervention networks, by interacting with their indexes, network members experienced significant spillover benefits from the boosters resulting in a reduction in injection risk behavior. Our results provide an improved understanding of the PDI’s effects in HPTN 037, suggesting that the intervention sustained by the boosters was successful in disseminating risk reduction information, modeling of health behaviors, and altering social norms, and, ultimately, in promoting behavior change among PWID’ social networks. This supports the premise of using PDIs to reduce HIV risk in PWID. Two possible approaches to maximize the effects and sustainability of peer education are having a two-phase approach by training a large number of peer educators, then choosing those who attend booster sessions to sustain the program, and implementing strategies to increase peer educators’ attendance at booster sessions. PDIs provide a method to reduce risk behaviors among networks of PWIDs through intervention with fewer participants. To better understand the full impact of PDIs, spillover effects should be routinely evaluated. PDIs with partial compliance can be analyzed using causal inference approaches to reveal the causal impact of spillover of the entire intervention package and its individual components, generating information to design future optimized interventions with improved potential to be scaled up as public health programs.
Supplementary Material
ACKNOWLEDGMENTS
R.U.H-R., A.L.B., and D.S. were supported by National Institutes of Health (NIH) grant R01AI112339. R.U.H-R. and D.S. were also supported by NIH grant P30MH062294. A.L.B. and D.S. were also supported by NIH grant DP1ES025459. A.L.B. was also supported by NIH grant DP2DA046856. J.J.L. was supported by National Science Foundation (NSF) DMS-1854934. We thank C.A.L. and Dr. Deborah Donnell for access to the HPTN 037 data. We also thank the study participants. Data from the HPTN 037 Study were obtained with support from the National Institute on Drug Abuse, the National Institute of Allergy and Infectious Diseases, and the National Institute of Mental Health under NIH grants UM1AI068619 (HPTN Leadership and Operations Center), UM1AI068617 (HPTN Statistical and Data Management Center), and UM1AI068613 (HPTN Laboratory Center). The content is solely the responsibility of the authors and does not necessarily represent the official views of the NIH or the NSF.
Footnotes
Conflicts of interest/Competing interests: None to declare.
Ethics approval: Approved by Yale University Institutional Review Board.
Availability of data and material:
HPTN 037 Protocol can be found in the HIV Prevention Trials Network (HPTN) website https://www.hptn.org/research/studies/28. HPTN data might be available by request to the Statistical Center for HIV/AIDS Research and Prevention through the ATLAS Science Portal https://atlas.scharp.org/cpas/project/HPTN.
REFERENCES
- 1.Latkin C, Friedman S. Drug use research: drug users as subjects or agents of change. Subst Use Misuse. 2012;47(5):598–9; 10.3109/10826084.2012.644177 [DOI] [PMC free article] [PubMed] [Google Scholar]
- 2.Ghosh D, Krishnan A, Gibson B, Brown SE, Latkin CA, Altice FL. Social network strategies to address HIV prevention and treatment continuum of care among at-risk and HIV-infected substance users: a systematic scoping review. AIDS Behav. 2017;21(4):1183–207; 10.1007/s10461-016-1413-y [DOI] [PMC free article] [PubMed] [Google Scholar]
- 3.Heckathorn DD, Broadhead RS, Anthony DL, Weakliem DL. AIDS and social networks: HIV prevention through network mobilization. Sociological Focus. 1999;32(2):159–79; 10.1080/00380237.1999.10571133 [DOI] [Google Scholar]
- 4.Sergeyev B, Oparina T, Rumyantseva TP, et al. HIV prevention in Yaroslavl, Russia: A peer-driven intervention and needle exchange. Journal of Drug Issues. 1999;29(4):777–804; 10.1177/002204269902900403 [DOI] [Google Scholar]
- 5.Latkin CA, Sherman S, Knowlton A. HIV prevention among drug users: Outcome of a network-oriented peer outreach intervention. Health Psychology. 2003;22(4):332–9; 10.1037/0278-6133.22.4.332 [DOI] [PubMed] [Google Scholar]
- 6.Booth RE, Lehman WEK, Latkin CA, Brewster JT, Sinitsyna L, Dvoryak S. Use of a peer leader intervention model to reduce needle-related risk behaviors among drug injectors in Ukraine. Journal of Drug Issues. 2009;39(3):607–26; 10.1177/002204260903900307 [DOI] [Google Scholar]
- 7.Latkin CA, Donnell D, Metzger D, et al. The efficacy of a network intervention to reduce HIV risk behaviors among drug users and risk partners in Chiang Mai, Thailand and Philadelphia, USA. Soc Sci Med. 2009;68(4):740–8; 10.1016/j.socscimed.2008.11.019 [DOI] [PMC free article] [PubMed] [Google Scholar]
- 8.Booth RE, Lehman WEK, Latkin CA, et al. Individual and network interventions with injection drug users in 5 ukraine cities. American Journal of Public Health. 2011;101(2):336–43; 10.2105/AJPH.2009.172304 [DOI] [PMC free article] [PubMed] [Google Scholar]
- 9.Tobin KE, Kuramoto SJ, Davey-Rothwell MA, Latkin CA. The STEP into Action study: a peer-based, personal risk network-focused HIV prevention intervention with injection drug users in Baltimore, Maryland. Addiction. 2011;106(2):366–75; 10.1111/j.1360-0443.2010.03146.x [DOI] [PMC free article] [PubMed] [Google Scholar]
- 10.Li J, Weeks MR, Borgatti SP, Clair S, Dickson-Gomez J. A social network approach to demonstrate the diffusion and change process of intervention from peer health advocates to the drug using community. Subst Use Misuse. 2012;47(5):474–90; 10.3109/10826084.2012.644097 [DOI] [PMC free article] [PubMed] [Google Scholar]
- 11.Hoffman IF, Latkin CA, Kukhareva PV, et al. A peer-educator network HIV prevention intervention among injection drug users: results of a randomized controlled trial in St. Petersburg, Russia. AIDS Behav. 2013;17(7):2510–20; 10.1007/s10461-013-0563-4 [DOI] [PMC free article] [PubMed] [Google Scholar]
- 12.Go VF, Frangakis C, Le Minh N, et al. Effects of an HIV peer prevention intervention on sexual and injecting risk behaviors among injecting drug users and their risk partners in Thai Nguyen, Vietnam: a randomized controlled trial. Soc Sci Med. 2013;96:154–64; 10.1016/j.socscimed.2013.07.006 [DOI] [PMC free article] [PubMed] [Google Scholar]
- 13.Latkin C, Donnell D, Liu TY, Davey-Rothwell M, Celentano D, Metzger D. The dynamic relationship between social norms and behaviors: The results of an HIV prevention network intervention for injection drug users. Addiction. 2013;108(5):934–43; 10.1111/add.12095 [DOI] [PMC free article] [PubMed] [Google Scholar]
- 14.Buchanan AL, Vermund SH, Friedman SR, Spiegelman D. Assessing individual and disseminated effects in network-randomized studies. Am J Epidemiol. 2018;187(11):2449–59; 10.1093/aje/kwy149 [DOI] [PMC free article] [PubMed] [Google Scholar]
- 15.US National Institutes on Drug Abuse. Common comorbidities with substance use disorders research report. 2020. https://www.ncbi.nlm.nih.gov/books/NBK571451/. Accessed 24 Mar 2023. [PubMed]
- 16.Degenhardt L, Peacock A, Colledge S, et al. Global prevalence of injecting drug use and sociodemographic characteristics and prevalence of HIV, HBV, and HCV in people who inject drugs: a multistage systematic review. Lancet Glob Health. 2017;5(12):e1192–e207; 10.1016/S2214-109X(17)30375-3 [DOI] [PMC free article] [PubMed] [Google Scholar]
- 17.Strike C, Rudzinski K, Patterson J, Millson M. Frequent food insecurity among injection drug users: correlates and concerns. BMC Public Health. 2012;12:1058; 10.1186/1471-2458-12-1058 [DOI] [PMC free article] [PubMed] [Google Scholar]
- 18.Marshall Z, Dechman MK, Minichiello A, Alcock L, Harris GE. Peering into the literature: A systematic review of the roles of people who inject drugs in harm reduction initiatives. Drug Alcohol Depend. 2015;151:1–14; 10.1016/j.drugalcdep.2015.03.002 [DOI] [PubMed] [Google Scholar]
- 19.Bandura A Social Learning Theory. Englewood, NJ: Prentice Hall; 1977. [Google Scholar]
- 20.Rogers EM. Diffusion of Innovations. New York, NY: Free Press; 1995. [Google Scholar]
- 21.Latkin CA, Knowlton AR. Social network assessments and interventions for health behavior change: A critical review. Behav Med. 2015;41(3):90–7; 10.1080/08964289.2015.1034645 [DOI] [PMC free article] [PubMed] [Google Scholar]
- 22.Benjamin-Chung J, Arnold BF, Berger D, et al. Spillover effects in epidemiology: parameters, study designs and methodological considerations. Int J Epidemiol. 2018;47(1):332–47; 10.1093/ije/dyx201 [DOI] [PMC free article] [PubMed] [Google Scholar]
- 23.Collins LM, Kugler KC, Gwadz MV. Optimization of multicomponent behavioral and biobehavioral interventions for the prevention and treatment of HIV/AIDS. AIDS Behav. 2016;20 Suppl 1:S197–214; 10.1007/s10461-015-1145-4 [DOI] [PMC free article] [PubMed] [Google Scholar]
- 24.Schulz KF, Altman DG, Moher D, Group C. CONSORT 2010 statement: updated guidelines for reporting parallel group randomized trials. Ann Intern Med. 2010;152(11):726–32; 10.7326/0003-4819-152-11-201006010-00232 [DOI] [PubMed] [Google Scholar]
- 25.Latkin C, Celentano D, Metzger D. Protocol for HPTN 037 A phase III randomized study to evaluate the efficacy of a network-oriented peer education intervention for the prevention of HIV transmission among injection drug users and their network members: A Study of the HIV Prevention Trials Network. 2003. https://www.hptn.org/sites/default/files/2016-05/HPTN037v2.pdf. Accessed 15 Mar 2023.
- 26.Lewis MA, DeVellis BM, Sleath B. Social influence and interpersonal communication in health behavior. In: Glanz K, Rimer BK, Lewis FM, editors. Health behavior and health education: Theory, research, and practice. 3rd ed. San Francisco: Jossey-Bass; 2002. p. 240–64. [Google Scholar]
- 27.Turner JC. Social comparison and social identity: Some prospects for intergroup behaviour. European Journal of Social Psychology. 1975;5(1):1–34; 10.1002/ejsp.2420050102 [DOI] [Google Scholar]
- 28.Van Knippenberg D Group norms, prototypicality, and persuasion. In: Terry DJ, Hogg MA, editors. Attitudes, behavior, and social context: the role of norms and group membership. Mahwah, NJ: Lawrence Erlbaum Associates Publishers; 2000. p. 157–70. [Google Scholar]
- 29.Robins JM, Hernan MA, Brumback B. Marginal structural models and causal inference in epidemiology. Epidemiology. 2000;11(5):550–60; 10.1097/00001648-200009000-00011 [DOI] [PubMed] [Google Scholar]
- 30.Hernan MA, Brumback B, Robins JM. Marginal structural models to estimate the causal effect of zidovudine on the survival of HIV-positive men. Epidemiology. 2000;11(5):561–70; 10.1097/00001648-200009000-00012 [DOI] [PubMed] [Google Scholar]
- 31.Wacholder S Binomial regression in GLIM: estimating risk ratios and risk differences. Am J Epidemiol. 1986;123(1):174–84; 10.1093/oxfordjournals.aje.a114212 [DOI] [PubMed] [Google Scholar]
- 32.Fitzmaurice GM, Laird NM, Ware JH. Applied longitudinal analysis. Hoboken, NJ: John Wiley & Sons, Inc.; 2012. [Google Scholar]
- 33.Skov T, Deddens J, Petersen MR, Endahl L. Prevalence proportion ratios: estimation and hypothesis testing. Int J Epidemiol. 1998;27(1):91–5; 10.1093/ije/27.1.91 [DOI] [PubMed] [Google Scholar]
- 34.Liang KY, Zeger SL. Longitudinal data-analysis using generalized linear-models. Biometrika. 1986;73(1):13–22; 10.1093/biomet/73.1.13 [DOI] [Google Scholar]
- 35.Huber PJ. The behavior of maximum likelihood estimates under nonstandard conditions. Proc Fifth Berkeley Symp Math Statist Prob. 1967;1(1):13; [Google Scholar]
- 36.Cole SR, Hernan MA. Constructing inverse probability weights for marginal structural models. Am J Epidemiol. 2008;168(6):656–64; 10.1093/aje/kwn164 [DOI] [PMC free article] [PubMed] [Google Scholar]
- 37.Spiegelman D, Hertzmark E. Easy SAS calculations for risk or prevalence ratios and differences. Am J Epidemiol. 2005;162(3):199–200; 10.1093/aje/kwi188 [DOI] [PubMed] [Google Scholar]
- 38.Zou G A modified Poisson regression approach to prospective studies with binary data. Am J Epidemiol. 2004;159(7):702–6; 10.1093/aje/kwh090 [DOI] [PubMed] [Google Scholar]
- 39.Miettinen OS. Theoretical epidemiology : Principles of occurrence research in medicine. New York: John Wiley & Sons; 1985. [Google Scholar]
- 40.Simmons N, Donnell D, Ou SS, et al. Assessment of contamination and misclassification biases in a randomized controlled trial of a social network peer education intervention to reduce HIV risk behaviors among drug users and risk partners in Philadelphia, PA and Chiang Mai, Thailand. AIDS Behav. 2015;19(10):1818–27; 10.1007/s10461-015-1073-3 [DOI] [PMC free article] [PubMed] [Google Scholar]
- 41.Aroke H, Buchanan A, Katenka N, et al. Evaluating the mediating role of recall of intervention knowledge in the relationship between a peer-driven intervention and HIV risk behaviors among people who inject drugs. AIDS Behav. 2023;27(2):578–90; 10.1007/s10461-022-03792-5 [DOI] [PMC free article] [PubMed] [Google Scholar]
- 42.Halloran ME, Struchiner CJ. Study designs for dependent happenings. Epidemiology. 1991;2(5):331–8; 10.1097/00001648-199109000-00004 [DOI] [PubMed] [Google Scholar]
Associated Data
This section collects any data citations, data availability statements, or supplementary materials included in this article.
Supplementary Materials
Data Availability Statement
HPTN 037 Protocol can be found in the HIV Prevention Trials Network (HPTN) website https://www.hptn.org/research/studies/28. HPTN data might be available by request to the Statistical Center for HIV/AIDS Research and Prevention through the ATLAS Science Portal https://atlas.scharp.org/cpas/project/HPTN.