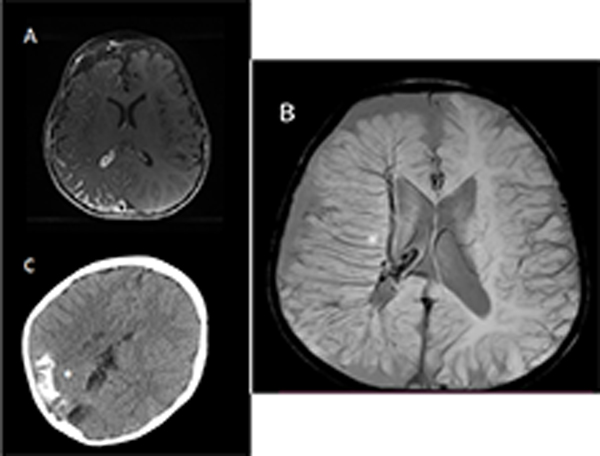
Figure 2:
Neuroimaging in 3 patients with Sturge-Weber syndrome. Stars indicate affected areas. A: Axial T1 post-contrast image showing leptomeningeal enhancement over the right hemisphere. B: Susceptibility weighted imaging (SWI) of another patient showing greatly dilated deep draining vessels draining to the deep venous system. C: Head CT, non-contrast, from another patient showing calcification in affected areas.

