

Abstract
Sequence similarity is of paramount importance in biology, as similar sequences tend to have similar function and share common ancestry. Scoring matrices, such as PAM or BLOSUM, play a crucial role in all bioinformatics algorithms for identifying similarities, but have the drawback that they are fixed, independent of context. We propose a new scoring method for amino acid similarity that remedies this weakness, being contextually dependent. It relies on recent advances in deep learning architectures that employ self-supervised learning in order to leverage the power of enormous amounts of unlabelled data to generate contextual embeddings, which are vector representations for words. These ideas have been applied to protein sequences, producing embedding vectors for protein residues. We propose the E-score between two residues as the cosine similarity between their embedding vector representations. Thorough testing on a wide variety of reference multiple sequence alignments indicate that the alignments produced using the new  -score method, especially ProtT5-score, are significantly better than those obtained using BLOSUM matrices. The new method proposes to change the way alignments are computed, with far-reaching implications in all areas of textual data that use sequence similarity. The program to compute alignments based on various
  -scores is available as a web server at e-score.csd.uwo.ca. The source code is freely available for download from github.com/lucian-ilie/E-score.
Keywords: sequence similarity, sequence alignment, amino acid scoring matrices, word embedding, alignment distance
INTRODUCTION
Sequence similarity is fundamental in sequence analysis. Significant similarities do not appear by chance but are evolutionarily motivated, with corresponding implications on their associated functions. Given a new sequence, its functionality is much faster investigated by performing a database search to identify known similar sequences and inferring the function of the new sequence from the existing information, resulting often in accurate identification. This procedure is sometimes the only way to infer function. Sequence similarity search is the most widely used procedure in bioinformatics, the BLAST program [1, 2] being one of the most cited contributions in the history of science. (The two BLAST papers [1, 2] combined exceed 190 000 citations on Google Scholar as of August 2023.)
The most important component of similarity search algorithms, such as BLAST, is the function that describes the similarity scores of various components, such as nucleotides for DNA and amino acids for proteins. We consider here the much more complicated case of proteins, where scoring of alignments is done using PAM [3] or BLOSUM [4] matrices, which give the substitution scores for pairs of amino acids. These matrices are fixed, which means that the substitution score for a pair of amino acids does not depend on their context, that is, the surrounding sequence of the protein containing them. We propose a new scoring function for residue pairs that is dependent on the context in which the residues appear. The new score makes use of protein embeddings.
Many of the best current techniques in Natural Language Processing (NLP) involve transfer learning based on pre-trained models using self-supervised learning on unlabelled data. Such data are freely available in enormous amounts, such as the Common Crawl corpus (commoncrawl.org). Words that share similar meanings or are related often appear in similar contexts. This enables scalable models to map words to numerical vectors (embeddings) in a high-dimensional space. Words with similar co-occurrence patterns are represented by vectors that are closer in this space. Such text embeddings are able to capture the semantic meaning of words. One of the best known earlier models is word2vec [5]. Denoting by  the vector associated with a word
  , an example ([5]) of meaning capture is shown by the fact that
  produces a vector that is closest to
  .
.
Embeddings such as word2vec [5] or GloVe [6] are contextual independent as the embedding vector for a given word is the same regardless of context. The next generation of embeddings, called contextual embeddings, overcome this limitation, e.g. ELMo [7], BERT [8], RoBERTa [9], XLNet [10], T5 [11]. The most successful contextual embeddings rely on the transformer architecture [12], achieving state-of-the-art results in many NLP benchmarks [8–10, 13].
Protein sequences present a similar situation, with entire proteins seen as sentences and residues as words, enabling the use of the embedding techniques developed for NLP to take advantage of the vast amount of protein sequences from UniProt [14]. Many protein embeddings have been proposed, including ProtVec [15], SeqVec [16], PRoBERTa [17], MSA-transformer [18], ESM-1b and ESM2 [19], and the models in the ProtTrans project: ProtTXL, ProtBert, ProtXLNet, ProtAlbert, ProtElectra and ProtT5 [20]. These protein embeddings have many important applications to various areas, such as: structure prediction [21–23], function prediction [24–26], interaction site prediction [27–29], etc. In many applications, they help achieving state-of-the-art performance.
Our new scoring function uses any embedding method that associates a vector to each residue. For any such method,  , we define the
  -score between two residues as the cosine similarity between their associated vectors. We investigate this new scoring function for contextual embeddings from the point of view of correct alignment generation. We have selected a wide variety of reference multiple sequence alignments (MSAs) from NCBI’s CDD (Conserved Domain Database) [30], that are manually curated according to the function. For each, we randomly selected many pairs of protein sequences in order to check how close the pairwise alignment is to the original reference MSA. Several alignment distances [31], including two that we introduce here, were used to compare the best new contextual ProtT5-score, with the best old one, the BLOSUM45 matrix. ProtT5-score performs overwhelmingly better than BLOSUM45, producing an average alignment distance that is better in all but one of the 37 MSAs tested.
The new scoring method proposes completely changing the way alignments are computed, with far-reaching implications in all areas that use sequence similarity.
MATERIALS AND METHODS
Cosine similarity
For two vectors,  and
and  , the cosine similarity between
  and
and  is defined as the cosine of the angle,
  , between the two vectors:
 |
The cosine similarity takes values between  and
and  , with
  for vectors of opposite direction,
  for the same direction and
  for orthogonal vectors; Figure 1 illustrates these three cases.
Figure 1.
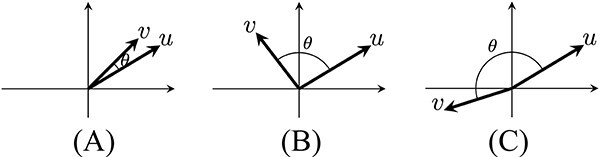
Cosine similarity of vectors  and
and  is the cosine of the angle,
  , between them: (A) similar vectors:
  ,
,  ; (B) orthogonal (independent) vectors:
  ,
,  ; (C) opposite vectors:
  ,
,  .
.
E-score
For a protein sequence  , of length
  , denote its
  th residue by
  . Consider an embedding method,
  , that produces embedding vectors of size
  . Assume that
  , when applied to protein
  , generates an
  matrix,
  , that has as its rows all
  embedding vectors of the residues of
  ; denote the embedding of the
  th residue by
  .
.
For two proteins  and
and  , and two positions,
  within
  and
and  within
  , the
, the  -score between the residues
  and
and  is defined as the cosine similarity between the corresponding embedding vectors:
 |
Note that, while not reflected by our notation,  depends also on the protein sequences
  and
and  . Thus, when the embedding method is ProtT5, ProtBert, ESM2, etc., we obtain ProtT5-score, ProtBert-score, ESM2-score, and so on. Clearly, for any contextual embedding method
  , the
, the  -score changes with context as well.
Visualizing E-scores
To have an idea what these new  -scores look like, we constructed some scoring matrices using those, and compared them with the BLOSUM matrices. While a BLOSUM matrix is fixed, the
  -scores change with context, so we computed average scores for each pair of amino acids. We picked the longest MSA, NBD_sugar-kinase_HSP70_actin, from the selected six representative MSAs (from the first column of Table 3). Then, we distinguished between ‘aligned’ residues, which appear in the same column of the MSA, and ‘unaligned’ residues, which occur in different columns. Since the
  -scores use the context, it is expected that aligned residues have significantly higher scores compared to unaligned ones. For each pair of amino acids, we randomly selected occurrences of their residues in the MSA and computed the average score; 100 000 pairs were selected in each of the categories, aligned and unaligned. We do this separately for the aligned and the unaligned case. This way, for a given embedding type and an MSA, we obtain two
  matrices. We show the aligned matrices for three embeddings: ProtT5-score, ESM2-score and ProtAlbert-score, alongside the BLOSUM45 matrix, in Figure 2. It appears from Figure 2 that the matrix for the ProtT5-score is the most similar to the BLOSUM45 matrix. The heatmaps of all five BLOSUM matrices and all twelve
  -score matrices (two matrices for each embedding method, for the aligned and the unaligned case) are shown in the Supplementary Table 8. It is interesting to notice the wide variety of ranges among the
  -score matrices. The unaligned matrices have lower, and narrower, ranges. It appears that a wider range of values is an indication of better performance for alignments.
Table 3.
ProtAlbert-score against BLOSUM45 matrix: comparison using 6 MSAs. The best values are shown in boldface. We show only the distances  ,
,  , and
, and  ; the comparisons using
  and
and  are similar to the one for
| MSA |

|

|

|
||||||
|---|---|---|---|---|---|---|---|---|---|
| Conserved domain | ProtAlbert | BLOSUM45 | P-value | ProtAlbert | BLOSUM45 | P-value | ProtAlbert | BLOSUM45 | P-value |
| Hb-alpha-like | 0.00064 | 0.00097 | 2.9E-05 | 0.00005 | 0.00023 | 2.4E-07 | 0.01538 | 0.02272 | 7.2E-06 |
| Globin-like | 0.04961 | 0.16054 | 1.5E-19 | 0.01144 | 0.11860 | 3.3E-19 | 0.54422 | 0.80690 | 6.1E-20 |
| 7tmA_photoreceptors_insect | 0.00139 | 0.00245 | 1.3E-38 | 0.00018 | 0.00108 | 1.4E-43 | 0.04539 | 0.08400 | 1.1E-42 |
| 7tm_GPCRs | 0.03310 | 0.09884 | 4.9E-24 | 0.00908 | 0.07128 | 9.6E-23 | 0.66807 | 0.89102 | 1.7E-23 |
| FGGY_YpCarbK_like | 0.00256 | 0.00486 | 7.3E-29 | 0.00038 | 0.00140 | 1.9E-44 | 0.07149 | 0.10790 | 2.9E-47 |
| NBD_sugar-kinase_HSP70_actin | 0.04928 | 0.12052 | 1.2E-48 | 0.03440 | 0.10443 | 3.6E-42 | 0.78501 | 0.90307 | 4.9E-47 |
Figure 2.

Heatmaps of (A) BLOSUM45 matrix (scaled to  ) and three aligned matrices of average
  -scores for the NBD_sugar-kinase_HSP70_actin MSA: (B) ProtT5-score, (C) ESM2-score and (D) ProtAlbert-score.
Correlations
It is of interest to see how well the new  -scores are correlated with the BLOSUM matrices. We consider here five BLOSUM matrices: BLOSUM45, BLOSUM50, BLOSUM62, BLOSUM80 and BLOSUM90, and six embedding methods: ProtT5, ProtBert, ProtAlbert, ProtXLNet, ESM-1b and ESM2. For each embedding method, we use for computing the correlations the same matrices computed above for the NBD_sugar-kinase_HSP70_actin MSA. Figure 3 gives the Pearson correlations between the five BLOSUM matrices and the twelve
  -score matrices. It can be seen that the ProtT5 matrices have the highest correlation with all BLOSUM matrices, followed, in order, by ESM2 and ProtBert, and then ProtAlbert, ESM-1b and, by far the last, ProtXLNet. For each method, the aligned matrix has higher correlation with BLOSUM matrices than the unaligned one. Interestingly, the unaligned ProtT5 matrix comes in second place, after the aligned ProtT5 and before all the other aligned matrices. With the exception of ProtXLNet, the two matrices, aligned and unaligned, for the same embedding method, are highly correlated.
Figure 3.

Pearson correlations between 5 BLOSUM matrices and 12  -score matrices. For each embedding method we considered, the aligned and unaligned matrices for the NBD_sugar-kinase_HSP70_actin MSA have been included.
Alignment distances
Our goal is to show that the use of the new  -scores provides better alignments compared to the BLOSUM scores. We do this by comparing their ability to produce true alignments, as given by the reference alignments from CDD; see Reference alignments subsection below. We selected a number of reference MSAs, discussed in the Results section, and investigated how close pairwise alignments produced using
  -score and BLOSUM matrices, respectively, are from the alignments between the same sequences, as induced by the reference MSAs. To compare how close two alignments are, we need to measure distances between alignments. We use five distance metrics, three existing ones,
  ,
,  and
and  from [31], and two that we introduce here,
  and
and  .
.
We give first a formal definition of an alignment. Consider an alphabet  . For a string
  over
over  of length
  , let
, let  , denote the
  th character of
  ; thus
  . For two strings
  over
over  , an alignment between
  and
and  is a pair of strings
  , of the same length
  , over
  (the ’-’ character stands for a gap), with
  (
( ) being obtained by inserting gaps at any positions in
  (
( , resp.), with the restriction that, for any position
  , at least one of the characters
  and
and  is not a gap.
Example 1.
Here are two examples of alignments between peptides
and
:
We have,
and
, both of length 4. Note that there is no column with two gaps.

Four distances have been introduced by [31], of which we use three that are suitable for our purpose:  , symmetrized sum-of-pairs score, which ignores gaps;
  , which treats all gaps in the same sequence equally; and
  , which incorporates positional information about the gaps. The original alignment is modified to reflect each gap treatment; in Example 1, alignment
  is converted into the following three alignments, to be used for each of the three distances
  , respectively:
 |
Similarly,  is converted into the following three versions:
 |
The three distances,  , are then defined using the three versions above, in order, using the homology set for each character,
  , for alignment
  ,
,  , sequence
  , position
  , that contain the characters from the other sequences in the same column as
  . For example,
  ,
,  .
.  is defined using the idea of the Jaccard distance [32] on the homology sets
  :
:
 |
The other two distances use symmetric difference on the sets  , for
, for  :
:
 |
We refer the reader to [31] for details and examples.
Relative displacement distance
The fourth distance,  , is new and measures the relative displacement between the positions of the letters in the two strings. Put
  and
and  and let
  be such that
  , for any
  . Similarly, let
  be such that
  , for any
  . For any
  , and
, and  , denote the distance between the positions of
  and
and  in
in  by
by  .
.
Given two alignments,  and
and  , between the same strings, we define the relative displacement distance between them as follows:
 |
The division by  is done to scale the value between 0 and 1. For any
  with
with  , we have that
  and
and  , implying that
  . Therefore,
  .
.
Example 1: for alignment  , we have
  , and
, and  ,
,  . For
. For  , we have
  and
and  . Then,
  ,
,  . The distance between the alignments is
  .
.
Closest context distance
The first three distances above,  ,
,  and
and  , consider only the column context of each residue, disregarding the position at which this occurs. On the other hand, the
  distance considers only the relative positions of the residues, disregarding their contexts. We propose next a distance that captures both position and context, by considering the distance to the closest position with the same context.
We introduce more notation. For a string  over
over  , of length
  , denote the range
  , if
, if  , and
, and  , if
, if  . Note that
  , the empty string.
For a string  over
over  , denote by
  the number of letters from
  in
in  ; e.g.,
  .
.
We modify slightly some notation from above. If  and
and  , and let
  be the position in
  at which
  occurs; that is,
  , for any
  and
and  . Similarly, let
  be the position in
  at which
  occurs; that is,
  , for any
  and
and  .
.
For a given  , we define
  , the contribution of
  from alignment
  to the distance, as follows, depending on whether the letter opposite to
  in
in  ,
,  , is (a) a letter or (b) a gap.
(a) If  is a letter, then
  is the number of letters in
  from position
  to the closest occurrence of a residue that is the same as
  (‘closest’ means fewest letters; gaps are not counted):
 |
In Example 1, for  , we have
  ,
,  ,
,  , and
, and  . The closest N to the position 1 in
  is at position 3, and there is one letter, D, in the range from 1 to 3. Therefore,
  . For
. For  , we have
  , because
  has the same opposite residue, N, in both alignments.
(b) If  is a gap, then
  is the difference between the number of letters in the two strings,
  and
and  , before the position of
  (note that this does not depend on whether
  is a letter or a gap):
 |
In Example 1, for  , we have
  ,
,  ,
,  , and
, and  . Therefore,
  .
.
The numbers  , for
, for  , are defined similarly. In our Example 1, we have
  .
.
Then, the closest context distance between  and
and  is
is
 |
The division by  is done to scale the value between 0 and 1, because we always have
  and
and  , thus making the sum after the fraction at most
  . In our Example 1, we have
  .
.
RESULTS
Reference alignments
There are multiple benchmark databases available to validate the accuracy of alignments. Most of these databases include comparatively similar sequences [33], albeit with the addition of features that are often difficult to align such as repeats, and many of the benchmarks were created using simulation techniques [34]. Most alignment algorithms can properly align similar sequences and the purpose of the method reported here is to align very distantly related protein sequences. For distantly related proteins, we do not agree that simulation methods have completely captured the vagaries of protein sequence evolution. We therefore wanted to use very distantly related protein sequence alignments that had been done by hand and based on the function of the proteins. To this end, we choose to make use of the CDD, [30], from NCBI. This database has hand curated alignments and furthermore, it lists these alignments in a hierarchical fashion. Thus, alignments can be chosen at different degrees of divergence from the same types of proteins.
Several alignments were chosen from CDD to explore different degrees of divergence and to explore different lengths of alignments. Pairs of protein groups were chosen to be very divergent (fold or superfamily level) and then a superfamily or family from within that protein group. Here are several examples: Globin-like, cd01067 (consensus alignment length 161 sites with 119 aa) and Hb-alpha-like, cd08927 (consensus alignment length 142 sites with 140 aa); 7tm_GPCRs, cd14964, (consensus alignment length 420 sites with 267 aa) and 7tmA_photoreceptors_insect, cd15079 (consensus alignment length 301 sites with 292 aa); NBD_sugar-kinase_HSP70_actin, cd00012 (consensus alignment length 1154 sites with 185 aa) and FGGY_YpCarbK_like, cd07782 (consensus alignment length 660 sites with 509 aa). The difference between the alignment length and the consensus number of aa gives an indication of the divergence within the grouping.
We have chosen 49 multiple sequence alignments from CDD. They are presented in Table 1, each with the conserved domain name, source, number of protein sequences and alignment length. The list is sorted by the alignment length.
Table 1.
The 49 MSAs from the CDD: the columns give, in order, the conserved domain, source ID, number of protein sequences and alignment length
| MSAs | |||
|---|---|---|---|
| Conserved domain | Source | Proteins | Length |
| Bbox2_MID2_C-I | cd19823 | 7 | 40 |
| Bbox2_TRIM42_C-III | cd19782 | 8 | 40 |
| Bbox2_MID | cd19758 | 9 | 40 |
| Bbox2_MID1_C-I | cd19822 | 8 | 47 |
| Bbox_SF | cd00021 | 5 | 48 |
| DEFL_defensin-like | cd21806 | 77 | 51 |
| Bbox2_TRIM37_C-VIII | cd19779 | 24 | 52 |
| Bbox2_TRIM9-like | cd19764 | 16 | 53 |
| CBD_like | cd12204 | 40 | 61 |
| Bbox2 | cd19756 | 126 | 65 |
| ChtBD1 | cd00035 | 31 | 67 |
| Bbox1_CYLD | cd19816 | 26 | 68 |
| KAZAL_FS | cd00104 | 272 | 74 |
| bHLH_SF | cd00083 | 78 | 75 |
| CD_CSD | cd00024 | 521 | 98 |
| C1 | cd00029 | 280 | 99 |
| TrHb | cd14756 | 7 | 130 |
| Hb | cd14765 | 14 | 138 |
| SH2_STAT5 | cd10376 | 4 | 140 |
| Hb-beta-like | cd08925 | 26 | 140 |
| Hb-alpha-like | cd08927 | 38 | 142 |
| SH2_STAT5a | cd10421 | 9 | 145 |
| Mb | cd08926 | 8 | 149 |
| GS_GGDEF_2 | cd14759 | 25 | 152 |
| Globin-like | cd01067 | 16 | 161 |
| FHb-globin | cd08922 | 46 | 162 |
| PFM_HFR-2-like | cd20216 | 89 | 174 |
| SH2_STAT_family | cd09919 | 66 | 206 |
| PBP-like | cd08919 | 30 | 213 |
| SH2 | cd00173 | 351 | 214 |
| Globin_sensor | cd01068 | 192 | 223 |
| PFM_monalysin-like | cd17904 | 30 | 229 |
| Mb-like | cd01040 | 383 | 239 |
| FYVE_like_SF | cd00065 | 391 | 266 |
| PFM_aerolysin_family | cd10140 | 64 | 270 |
| 7tmA_photoreceptors_insect | cd15079 | 34 | 301 |
| 7tmA_Melanopsin-like | cd15083 | 11 | 314 |
| ClyA_AhlB-like | cd22652 | 38 | 354 |
| 7tmA_Opsins_type2_animals | cd14969 | 70 | 400 |
| 7tm_GPCRs | cd14964 | 17 | 420 |
| 7tmA_Anaphylatoxin_R-like | cd14974 | 17 | 429 |
| 7tmA_Opioid_R-like | cd14970 | 15 | 458 |
| ClyA-like | cd21116 | 117 | 519 |
| FGGY_RBK_like | cd07768 | 5 | 537 |
| FGGY | cd00366 | 30 | 588 |
| FGGY_YpCarbK_like | cd07782 | 34 | 690 |
| 7tm_classa:rhodopsin-like | cd00637 | 404 | 808 |
| NBD_sugar-kinase_HSP70_actin | cd00012 | 124 | 1154 |
| 7tmA_amine_R-like | cd14967 | 77 | 1227 |
The MSAs are sorted increasingly by length.
Case studies
Before presenting a comparison between  -scores and the BLOSUM matrices, we show in this section two examples of the advantage presented by the alignments produced by the ProtT5-score compared with the BLOSUM45 matrix. The first example is for two sequences from the KAZAL_FS (cd00104) MSA. The sequences and the two alignments are shown below. The BLOSUM45 alignment is correct in the first half, whereas the second half is significantly different, with several gaps added, whereas the true alignment has none.

|
The second example involves two sequences from the Globin_sensor (cd01068) MSA. The sequences and the two alignments are shown below. In this example, the BLOSUM45 alignment diverges drastically from the true alignment; the algorithm is deceived by a number of identities between the two sequences.

|
It appears that the BLOSUM45 matrix often introduces false gaps to achieve a higher number of matches. That is, it blindly works to achieve a maximum score while the ProtT5-score avoids this trap, due to its contextual nature. For example, note in the first example that BLOSUM45 removes one match to instead introduce six additional ones. Remarkably, the ProtT5-score finds the true alignment, in spite of the fact that it contains in the middle 21-18 region only one match instead of six. The ProtT5-score appears to be taking more information from the properties of the amino acids than are encoded in the matrix or capable of being encoded in the matrix without context.
Comparison procedure
We compare the  -scores against the BLOSUM matrices on the 49 MSAs introduced above as follows. For each MSA, we pick 1000 randomly selected protein pairs (if the total number of pairs is less than 1000, then we pick all pairs), compute pairwise alignment of each pair using either the
  -score or BLOSUM matrix, according to the Needleman-Wunsch dynamic programming global alignment algorithm [35], but without any penalties for gaps at the ends, called semi-global alignment. This is the most suitable alignment type, as we expect these sequences to align globally; however, using end-gap penalties could artificially alter the alignments.
For BLOSUM matrices we used the NCBI BLAST default values:  for gap opening and
  for gap extension. For
  -scores, we used experimentally set gap penalties:
  for gap opening and
  for gap extension. Experiments indicate that the algorithm is robust to penalty changes.
Each pairwise alignment is then evaluated against the reference alignment from CDD by computing the distance to the pairwise alignment induced by the reference MSA for the two sequences. The distance is computed using all five distances introduce above:  ,
,  ,
,  ,
,  and
and  .
.
The comparison for all  -scores and all BLOSUM matrices on all data is very time consuming; therefore, we need to choose the best
  -score and the best BLOSUM matrix. For that purpose, we have selected six representative MSAs of the above 49; see the first column of Supplementary Tables 3–6. We have first compared all six
  -scores on these six MSAs; the results are shown in Supplementary Table 3. The two top performers are the ProtT5-score and the ESM2-score. They are compared head-to-head in Supplementary Table 4, using the same six MSAs, but considering also the Wilcoxon signed-rank test P-values, with a threshold of 0.01, to check the validity of the findings. The result is that ProtT5 is the best
  -score.
Similarly, to find the best BLOSUM matrix for our purposes, we performed the same procedure. All five candidates, BLOSUM45, BLOSUM50, BLOSUM62, BLOSUM80 and BLOSUM90, are compared in Supplementary Table 5, and the top two, BLOSUM45 and BLOSUM62, in Supplementary Table 6. BLOSUM45 is the best scoring matrix for our comparison. This is not unexpected, given the fact that we consider distantly related sequences. The most commonly used matrix, BLOSUM62, comes in second place very closely behind BLOSUM45.
ProtT5-score versus BLOSUM45 matrix
In this section, we compare head-to-head the ProtT5-score against the BLOSUM45 matrix, the top performers, as decided by the previous section. We have compared the two, as described above, on all data; see Supplementary Table 1, where the Wilcoxon test P-values larger than.01 are indicated in red. We have removed all tests with P-values higher than .01 and present the comparison for the  ,
,  and
and  distances in Table 2. The
  distance presents the most important evaluation, which, together with
  and
and  gives a comprehensive evaluation of the similarity between the pairwise alignments and true ones, as induced by MSAs. The results for the
  and
and  distances are similar to those for the
  distance; see Supplementary Table 1.
Table 2.
ProtT5-score against BLOSUM45 matrix: comparison using 37 MSAs, for which the Wilcoxon test P-values are smaller than .01
| MSA |

|

|

|
||||||
|---|---|---|---|---|---|---|---|---|---|
| Conserved domain | ProtT5 | BLOSUM45 | P-value | ProtT5 | BLOSUM45 | P-value | ProtT5 | BLOSUM45 | P-value |
| Bbox2_TRIM37_C-VIII | 0.00433 | 0.00339 | 2.4E-05 | 0.00133 | 0.00101 | 1.9E-07 | 0.05080 | 0.04291 | 4.9E-03 |
| CBD_like | 0.01079 | 0.02063 | 5.2E-67 | 0.00366 | 0.01003 | 9.3E-85 | 0.15178 | 0.23148 | 2.3E-82 |
| Bbox2 | 0.01171 | 0.02491 | 1.6E-38 | 0.00305 | 0.00671 | 2.7E-34 | 0.13607 | 0.19105 | 8.0E-39 |
| ChtBD1 | 0.01270 | 0.02213 | 2.0E-23 | 0.00336 | 0.00815 | 7.1E-25 | 0.16092 | 0.21999 | 5.0E-23 |
| Bbox1_CYLD | 0.01368 | 0.02840 | 1.8E-25 | 0.00451 | 0.00726 | 3.1E-09 | 0.15525 | 0.22111 | 1.4E-21 |
| KAZAL_FS | 0.01333 | 0.03906 | 8.1E-105 | 0.00334 | 0.01391 | 1.2E-100 | 0.14704 | 0.26988 | 1.1E-94 |
| bHLH_SF | 0.00717 | 0.02892 | 6.2E-83 | 0.00289 | 0.01331 | 2.1E-78 | 0.09987 | 0.21775 | 2.1E-81 |
| CD_CSD | 0.00919 | 0.02334 | 1.5E-79 | 0.00152 | 0.00610 | 2.9E-106 | 0.10771 | 0.19795 | 9.3E-93 |
| C1 | 0.01326 | 0.02213 | 1.1E-58 | 0.00375 | 0.00832 | 4.9E-49 | 0.16152 | 0.22180 | 6.0E-48 |
| TrHb | 0.00453 | 0.04156 | 8.9E-05 | 0.00100 | 0.00768 | 1.4E-04 | 0.09407 | 0.34595 | 8.9E-05 |
| Hb | 0.00149 | 0.00249 | 5.1E-06 | 0.00020 | 0.00069 | 9.4E-09 | 0.04412 | 0.07279 | 4.6E-08 |
| Hb-beta-like | 0.00118 | 0.00204 | 2.0E-10 | 0.00017 | 0.00057 | 5.5E-16 | 0.02268 | 0.03898 | 5.6E-15 |
| GS_GGDEF_2 | 0.00184 | 0.01204 | 1.7E-45 | 0.00027 | 0.00337 | 5.5E-44 | 0.02721 | 0.16645 | 8.0E-48 |
| Globin-like | 0.03239 | 0.16054 | 6.3E-21 | 0.00655 | 0.11860 | 5.4E-21 | 0.37020 | 0.80690 | 6.0E-21 |
| FHb-globin | 0.00119 | 0.00223 | 2.1E-46 | 0.00014 | 0.00058 | 2.8E-87 | 0.02402 | 0.04233 | 1.2E-78 |
| PFM_HFR-2-like | 0.00685 | 0.00935 | 1.5E-13 | 0.00156 | 0.00210 | 6.8E-26 | 0.10431 | 0.13956 | 1.1E-43 |
| SH2_STAT_family | 0.02058 | 0.03761 | 1.3E-95 | 0.00656 | 0.01465 | 2.0E-72 | 0.21164 | 0.30587 | 1.6E-109 |
| PBP-like | 0.01275 | 0.03877 | 3.7E-62 | 0.00360 | 0.01670 | 2.3E-53 | 0.19832 | 0.35307 | 5.2E-64 |
| SH2 | 0.03420 | 0.06926 | 1.2E-121 | 0.00905 | 0.02893 | 4.4E-113 | 0.30237 | 0.47880 | 4.1E-137 |
| Globin_sensor | 0.00451 | 0.02360 | 2.7E-149 | 0.00060 | 0.00773 | 5.9E-155 | 0.06791 | 0.25776 | 9.0E-156 |
| PFM_monalysin-like | 0.01373 | 0.02205 | 2.0E-28 | 0.00475 | 0.00696 | 6.8E-13 | 0.26910 | 0.32413 | 1.2E-26 |
| Mb-like | 0.00874 | 0.04961 | 1.2E-159 | 0.00217 | 0.02193 | 4.8E-156 | 0.16868 | 0.45461 | 6.3E-160 |
| FYVE_like_SF | 0.01143 | 0.04492 | 1.6E-137 | 0.00467 | 0.02393 | 2.8E-134 | 0.17010 | 0.31653 | 5.8E-139 |
| PFM_aerolysin_family | 0.04597 | 0.07719 | 4.8E-152 | 0.01028 | 0.03162 | 9.3E-138 | 0.64020 | 0.75997 | 5.9E-118 |
| 7tmA_photoreceptors_insect | 0.00134 | 0.00246 | 3.1E-69 | 0.00021 | 0.00103 | 3.3E-75 | 0.04787 | 0.08499 | 6.0E-75 |
| 7tmA_Melanopsin-like | 0.00088 | 0.00387 | 2.1E-10 | 0.00013 | 0.00184 | 1.9E-10 | 0.04305 | 0.11684 | 2.1E-10 |
| ClyA_AhlB-like | 0.00172 | 0.00370 | 4.2E-49 | 0.00017 | 0.00084 | 1.2E-81 | 0.02966 | 0.07167 | 1.6E-84 |
| 7tmA_Opsins_type2_animals | 0.00201 | 0.00831 | 6.8E-163 | 0.00058 | 0.00373 | 1.1E-154 | 0.07003 | 0.23258 | 6.0E-164 |
| 7tm_GPCRs | 0.02268 | 0.09884 | 4.6E-24 | 0.00533 | 0.07128 | 5.6E-24 | 0.53322 | 0.89102 | 6.3E-24 |
| 7tmA_Anaphylatoxin_R-like | 0.00393 | 0.01085 | 1.6E-23 | 0.00119 | 0.00369 | 3.8E-22 | 0.10993 | 0.21479 | 6.7E-24 |
| 7tmA_Opioid_R-like | 0.00204 | 0.00713 | 7.8E-19 | 0.00097 | 0.00341 | 2.7E-17 | 0.11747 | 0.19390 | 3.5E-18 |
| ClyA-like | 0.02330 | 0.06187 | 1.2E-155 | 0.01339 | 0.03713 | 5.2E-145 | 0.42838 | 0.67022 | 1.1E-157 |
| FGGY | 0.00449 | 0.01098 | 2.1E-71 | 0.00216 | 0.00485 | 3.4E-45 | 0.18884 | 0.35385 | 7.6E-72 |
| FGGY_YpCarbK_like | 0.00164 | 0.00530 | 5.7E-78 | 0.00023 | 0.00148 | 4.5E-82 | 0.06366 | 0.10771 | 3.0E-89 |
| 7tm_classa:rhodopsin-like | 0.00578 | 0.02614 | 5.1E-165 | 0.00190 | 0.01220 | 1.3E-161 | 0.18442 | 0.45280 | 5.2E-165 |
| NBD_sugar-kinase_HSP70_actin | 0.03413 | 0.11619 | 3.0E-161 | 0.01782 | 0.09832 | 1.2E-155 | 0.66208 | 0.88831 | 6.3E-164 |
| 7tmA_amine_R-like | 0.00494 | 0.02148 | 3.6E-164 | 0.00256 | 0.01523 | 2.1E-155 | 0.19174 | 0.35597 | 5.4E-165 |
The best values are shown in boldface. We show only the distances  ,
,  and
and  ; the comparisons using
  and
and  are similar to the one for
ProtT5-score is better in all but one test on the shortest MSA. Regarding the overall number of better cases, ProtT5 has 74% of the cases, BLOSUM45 13%, while for the remaining 13%, they were equal; see Supplementary Table 2.
The tests with few samples are not very reliable, as indicated by the fact that almost all P-values above the threshold are for tests with 36 samples or less. Many of these tests are for short MSAs. The only case where BLOSUM performs better than ProtT5-score, Bbox2_TRIM37_C-VIII, is among these. In fact, one of its P-values is 4.87E-03, close to our threshold of 1.00E-02.
For the much more difficult case of long alignments, ProtT5-score outperforms BLOSUM matrices in 94% of cases of alignments with length over 300, whereas BLOSUM45 is better in only 4% of those cases; see Supplementary Table 2.
For a better visualization of the comparison, we plotted in Figure 4(A), for each of the five distances, the ratio between the distance to the reference alignment from the BLOSUM45 alignment and from the ProtT5 alignment, respectively. That means higher than 1 is better in favour of ProtT5. It is very clear from the figure that ProtT5 has a much better similarity with the reference alignment, the advantage being most clear for the  distance, as expected.
Figure 4.

(A) The ratio between the performance of BLOSUM45 and ProtT5-score in terms of distances to the reference from their alignments. The results are sorted by increasing MSA length. Higher than 1 (above the  line) indicates ProtT5-score is better. (B) The percentage of cases when ProtT5-score and BLOSUM45, respectively, are producing better results, sorted increasingly by MSA length. The results for the same distance are plotted in the same colour, with solid line for ProtT5-score and dashed line for BLOSUM45.
We also plotted the percentage of cases where ProtT5-score and BLOSUM45, respectively, produce better results (see Supplementary Table 2), as a function of MSA length, in Figure 4(B). The difference in performance in favour of the ProtT5-score is increasing with alignment length, and therefore with alignment complexity, to the point where ProtT5-score produces better results in practically all cases.
The comparison for the purely global alignment case (where end-gaps are considered) is presented in the Supplementary Table 7. The conclusions are similar to those presented here for the semi-global case.
ProtAlbert-score versus BLOSUM45 matrix
We have seen above that the best  -score, ProtT5, is much better than the best BLOSUM matrix, BLOSUM45. However, it turns out that the least powerful
  -score, ProtAlbert (strictly speaking, ProtXLNet is the least powerful, but it gives errors sometimes, and cannot be tested properly) is still clearly outperforming the top BLOSUM45 matrix. We show only the comparison on the six selected alignments in Table 3. This indicates most clearly the superiority of the
  -scores compared with BLOSUM matrices for scoring alignments.
DISCUSSION AND CONCLUSION
We have proposed a new method for scoring sequence alignments,  -score, using the cosine similarity between the vectors associated using any word embedding algorithm,
  . When using contextual embeddings, the
  -score has the advantage of incorporating into the score associated with each position contextual information from the neighbouring positions in the sequence.
We have thoroughly tested the new  -score in the context of protein global alignments, by comparing the top scoring function, ProtT5-score, against the BLOSUM45 matrix on a large set including a wide variety of reference multiple sequence alignments from NCBI’s Conserved Domain Database. The pairwise alignments produced by using the ProtT5-score are much closer to the true alignments, as induced by the reference multiple sequence alignments, compared to BLOSUM45. Furthermore, even the least powerful ProtAlbert-score outperforms the top BLOSUM45 matrix by a wide margin. This means that all E-scores clearly outperform all BLOSUM matrices, indicating the superiority of the new method.
Many issues remain to be investigated regarding the performance of the newly introduced  -scores for biological sequences, such as local alignments, multiple alignments, database search, genome alignment, phylogenetic tree reconstruction, etc. Also, the case of aligning nucleic acid sequences—DNA, RNA—though simpler than the case of proteins, is a whole area where
  -scores can be applied as well.
While we have tested the new  -score in the context of biological sequences, particularly proteins, the new method can be applied to any sequences where computation of embedding vectors is possible, which include practically all existing textual data, the largest type of data available. All Large Language Models have the possibility to produce word embedding vectors for any input text. Considering the importance and implications of text similarity in general, our method presents the potential for applications into many areas. We hope that future investigations will explore how our method can be applied in various fields, revealing its effectiveness and discovering new uses.
The language models are expected to improve at a rapid pace in the future, with expected corresponding improvements for those involving biological sequences. The ideas presented apply directly to any new model, meaning that the  -score will improve as well.
Specialized models, obtained usually by fine tuning the general ones, or adapting them to specialized tasks, are expected to provide improved performance. Regarding the case of biological sequences, where alignments play a particularly vital role, the possibility exists for training, or fine tuning, models for highly specialized tasks, such as specific types of proteins.
Key Points
Sequence similarity is central in biology, as similar sequences share function and common ancestry. BLOSUM matrices play a crucial role in identifying similarities, but have the drawback that they are independent of context.
We propose a new method,
 -score, for amino acid similarity that uses the context of the protein sequences. It uses the cosine similarity of the embedding vectors associated with the residues.
E-scores greatly surpass the ability of BLOSUM matrices to produce true alignments.
The new method can be applied to the similarity of any textual data, with a limitless number of applications.
Supplementary Material
Sepehr Ashrafzadeh obtained his M.Sc. degree from the University of Western Ontario in London, Canada under the supervision of Prof. Lucian Ilie.
G. Brian Golding is a Professor at McMaster University in Hamilton, Canada. He is interested in all aspects of Molecular Evolution, Bioinformatics and Population Genetics.
Silvana Ilie is an Associate Professor at Toronto Metropolitan University in Toronto, Canada. Her research interests include Computational Biology, Numerical Methods and Scientific Computing.
Lucian Ilie is a Professor at the University of Western Ontario in London, Canada. His research interests include Bioinformatics, Machine Learning and Algorithms.
Contributor Information
Sepehr Ashrafzadeh, Department of Computer Science, University of Western Ontario, London, N6A 5B7, Ontario, Canada.
G Brian Golding, Department of Biology, McMaster University, Hamilton, L8S 4K1, Ontario, Canada.
Silvana Ilie, Department of Mathematics, Toronto Metropolitan University, Toronto, M5B 2K3, Ontario, Canada.
Lucian Ilie, Department of Computer Science, University of Western Ontario, London, N6A 5B7, Ontario, Canada.
ACKNOWLEDGEMENTS
Seyed Mohsen Hosseini provided assistance with building the web server and installing some embedding models. All computations were performed on Compute Canada servers.
FUNDING
This research was funded by NSERC Discovery Grants (RGPIN-2020-05733 to G.B.G., RGPIN-2020-05469 to S.I. and RGPIN 2021-03978 to L.I.).
AUTHOR CONTRIBUTIONS
S.A. implemented the alignment programs, downloaded and installed the embedding models, downloaded and processed the data, performed all testing, and built the GitHub page and web server. G.B.G. proposed the Conserved Domain Database, selected all reference MSAs used for testing, identified the six representative ones used for pre-testing and wrote the description of the data. S.I. introduced the new closest context distance and contributed to finding the gap penalties. L.I. proposed the problem, defined the  -score, proposed the evaluation using pairwise alignments induced by reference MSAs, introduced the new relative displacement distance, supervised the implementation and testing, and wrote the manuscript. All authors read and approved the final version of the manuscript.
DATA AVAILABILITY
The program to compute alignments based on various  -scores is available as a web server at e-score.csd.uwo.ca. The source code is freely available for download from github.com/lucian-ilie/E-score.
References
- 1. Altschul SF, Gish W, Miller W, et al. Basic local alignment search tool. J Mol Biol 1990;215(3):403–10. [DOI] [PubMed] [Google Scholar]
- 2. Altschul SF, Madden TL, Schäffer AA, et al. Gapped BLAST and PSI-BLAST: a new generation of protein database search programs. Nucleic Acids Res 1997;25(17):3389–402. [DOI] [PMC free article] [PubMed] [Google Scholar]
- 3. Dayhoff M, Schwartz R, Orcutt B. 22 a model of evolutionary change in proteins. Atlas of protein sequence and structure 1978;5:345–52. [Google Scholar]
- 4. Henikoff S, Henikoff JG. Amino acid substitution matrices from protein blocks. Proc Natl Acad Sci 1992;89(22):10915–9. [DOI] [PMC free article] [PubMed] [Google Scholar]
- 5. Mikolov T, Chen K, Corrado G, Dean J. Efficient estimation of word representations in vector space arXiv preprint arXiv:1301.3781. 2013.
- 6. Pennington J, Socher R, Manning CD. GloVe: Global vectors for word representation. In:Proceedings of the 2014 Conference on Empirical Methods in Natural Language Processing (EMNLP), Doha, Qatarp. 1532–43, 2014.
- 7. Peters ME, Neumann M, Iyyer M, et al. Deep contextualized word representations arXiv:1802.05365. 2018.
- 8. Devlin J, Chang M-W, Lee K, Toutanova K. Bert: pre-training of deep bidirectional transformers for language understanding arXiv preprint arXiv:1810.04805. 2018.
- 9. Liu Y, Ott M, Goyal N, et al. Roberta: a robustly optimized bert pretraining approach arXiv preprint arXiv:1907.11692. 2019.
- 10. Yang Z, Dai Z, Yang Y, et al. XLNet: generalized autoregressive pretraining for language understanding. Adv Neural Inf Process Syst 2019;32. [Google Scholar]
- 11. Raffel C, Shazeer N, Roberts A, et al. Exploring the limits of transfer learning with a unified text-to-text transformer. arXiv preprint arXiv:1910.10683. 2020.
- 12. Vaswani A, Shazeer N, Parmar N, et al. Attention is all you need. Adv Neural Inf Process Syst 2017;30. [Google Scholar]
- 13. Lan Z, Chen M, Goodman S, et al. ALBERT: A Lite BET for self-supervised learning of language representations. arXiv preprint arXiv:1909.11942. 2019.
- 14. The UniProt Consortium . Uniprot: the universal protein knowledgebase. Nucleic Acids Res 2017;45(D1):D158–69. [DOI] [PMC free article] [PubMed] [Google Scholar]
- 15. Asgari E, Mofrad MRK. Continuous distributed representation of biological sequences for deep proteomics and genomics. PloS One 2015;10(11):e0141287. [DOI] [PMC free article] [PubMed] [Google Scholar]
- 16. Heinzinger M, Ahmed Elnaggar Y, Wang CD, et al. Modeling aspects of the language of life through transfer-learning protein sequences. BMC Bioinform 2019;20(1):1–17. [DOI] [PMC free article] [PubMed] [Google Scholar]
- 17. Nambiar A, Heflin M, Liu S, et al. Transforming the language of life: transformer neural networks for protein prediction tasks. In:Proceedings of the 11th ACM International Conference on Bioinformatics, Computational Biology and Health Informatics, p. 1–8, 2020.
- 18. Rao RM, Liu J, Verkuil R, et al. MSA transformer. In:International Conference on Machine Learning, p. 8844–56. PMLR, 2021. [Google Scholar]
- 19. Rives A, Meier J, Sercu T, et al. Biological structure and function emerge from scaling unsupervised learning to 250 million protein sequences. Proc Natl Acad Sci 2021;118(15):e2016239118. [DOI] [PMC free article] [PubMed] [Google Scholar]
- 20. Elnaggar A, Heinzinger M, Dallago C, et al. ProtTrans: toward understanding the language of life through self-supervised learning. IEEE Trans Pattern Anal Mach Intell 2021;44(10):7112–27. [DOI] [PubMed] [Google Scholar]
- 21. Senior AW, Evans R, Jumper J, et al. Improved protein structure prediction using potentials from deep learning. Nature 2020;577(7792):706–10. [DOI] [PubMed] [Google Scholar]
- 22. Yang J, Anishchenko I, Park H, et al. Improved protein structure prediction using predicted interresidue orientations. Proc Natl Acad Sci 2020;117(3):1496–503. [DOI] [PMC free article] [PubMed] [Google Scholar]
- 23. Jumper J, Evans R, Pritzel A, et al. Highly accurate protein structure prediction with AlphaFold. Nature 2021;596(7873):583–9. [DOI] [PMC free article] [PubMed] [Google Scholar]
- 24. Kulmanov M, Hoehndorf R. DeepGOPlus: improved protein function prediction from sequence. Bioinformatics 2020;36(2):422–9. [DOI] [PMC free article] [PubMed] [Google Scholar]
- 25. Vladimir Gligorijević P, Renfrew D, Kosciolek T, et al. Structure-based protein function prediction using graph convolutional networks. Nat Commun 2021;12. [DOI] [PMC free article] [PubMed] [Google Scholar]
- 26. Lai B, Jinbo X. Accurate protein function prediction via graph attention networks with predicted structure information. Brief Bioinform 2022;23(1):bbab502. [DOI] [PMC free article] [PubMed] [Google Scholar]
- 27. Hosseini SM, Ilie L. PITHIA: protein interaction site prediction using multiple sequence alignments and attention. Int J Mol Sci 2022;23(21):12814. [DOI] [PMC free article] [PubMed] [Google Scholar]
- 28. Yuan Q, Chen J, Zhao H, et al. Structure-aware protein–protein interaction site prediction using deep graph convolutional network. Bioinformatics 2022;38(1):125–32. [DOI] [PubMed] [Google Scholar]
- 29. Hosseini SM, Golding GB, Ilie L. Seq-InSite: sequence supersedes structure for protein interaction site prediction. Bioinformatics 2024;40(1):btad738. [DOI] [PMC free article] [PubMed] [Google Scholar]
- 30. Marchler-Bauer A, Derbyshire MK, Gonzales NR, et al. CDD: NCBI’s conserved domain database. Nucleic Acids Res 2015;43(D1):D222–6. [DOI] [PMC free article] [PubMed] [Google Scholar]
- 31. Blackburne BP, Whelan S. Measuring the distance between multiple sequence alignments. Bioinformatics 2012;28(4):495–502. [DOI] [PubMed] [Google Scholar]
- 32. Jaccard P. The distribution of the flora in the alpine zone. 1. New Phytol 1912;11(2):37–50. [Google Scholar]
- 33. Thompson JD, Koehl P, Ripp R, Poch O. Balibase 3.0: latest developments of the multiple sequence alignment benchmark. Proteins 2005;61(1):127–36. [DOI] [PubMed] [Google Scholar]
- 34. Stoye J, Evers D, Meyer F. ROSE: generating sequence families. Bioinformatics (Oxford, England) 1998;14(2):157–63. [DOI] [PubMed] [Google Scholar]
- 35. Needleman SB, Wunsch CD. A general method applicable to the search for similarities in the amino acid sequence of two proteins. J Mol Biol 1970;48(3):443–53. [DOI] [PubMed] [Google Scholar]
Associated Data
This section collects any data citations, data availability statements, or supplementary materials included in this article.
Supplementary Materials
Data Availability Statement
The program to compute alignments based on various -scores is available as a web server at e-score.csd.uwo.ca. The source code is freely available for download from github.com/lucian-ilie/E-score.