Abstract
A fluid–structure interaction (FSI) model of a left anterior descending (LAD) coronary artery was developed, incorporating transient blood flow, cyclic bending motion of the artery, and myocardial contraction. The three-dimensional (3D) geometry was constructed based on a patient’s computed tomography angiography (CTA) data. To simulate disease conditions, a plaque was placed within the LAD to create a 70% stenosis. The bending motion of the blood vessel was prescribed based on the LAD spatial information. The pressure induced by myocardial contraction was applied to the outside of the blood vessel wall. The fluid domain was solved using the Navier–Stokes equations. The arterial wall was defined as a nonlinear elastic, anisotropic, and incompressible material, and the mechanical behavior was described using the modified hyper-elastic Mooney–Rivlin model. The fluid (blood) and solid (vascular wall) domains were fully coupled. The simulation results demonstrated that besides vessel bending/stretching motion, myocardial contraction had a significant effect on local hemodynamics and vascular wall stress/strain distribution. It not only transiently increased blood flow velocity and fluid wall shear stress, but also changed shear stress patterns. The presence of the plaque significantly reduced vascular wall tensile strain. Compared to the coronary artery models developed previously, the current model had improved physiological relevance.
Keywords: numerical simulation, myocardial contraction, cyclic tensile strain, shear stress
Introduction
The left anterior descending (LAD) coronary artery supplies blood to 45–55% of the left ventricle and plays an important role in myocardial perfusion [1]. The narrowing or blockage of the LAD due to atherosclerosis results in 40–50% of all heart attacks and causes over 185,000 deaths in the U.S. annually [2,3]. Besides genetic and life-style factors, biomechanics plays a key role in the development of atherosclerosis. Although it is well established that pathological shear stress and tensile strain can cause inflammatory responses in vascular endothelial cells and enhance leukocyte transmigration [4,5], the associated mechanisms are not fully understood. A better quantification of coronary blood flow-induced shear stress and coronary artery motion-induced tensile strain [6–8] can provide more information on how coronary artery biomechanics affects atherosclerosis development and vice versa.
Computational fluid dynamics models are often used to estimate fluid shear stress and vascular wall tensile strain within blood vessels [9–13]. In recent years, a good number of fluid–structure interaction (FSI) models have been developed. Many of those models incorporated patient-specific geometry [14,15], transient blood flow conditions, cyclic bending motion [16,17], and anisotropic material properties of the blood vessel wall [18] and were successful in elucidating complex stress–strain conditions in the coronary arteries. However, only a handful of models considered the effect of myocardial contraction on coronary hemodynamics and blood vessel wall tensile strain distribution [19,20].
A large portion of the left coronary artery is embedded within the myocardium. During systole, the cardiac muscles contract, which can constrict the left coronary artery, and significantly reduce coronary blood flow [21]. The squeezing pressure of the myocardium on the external blood vessel wall can reach 40kPa [8]. Ignoring such a large contraction force is likely to lead to inaccurate estimation of flow, stress, and strain conditions. However, when myocardial contraction was considered, the results obtained from various FSI models differed. Zhang et al. simulated myocardial contraction using a two-dimensional FSI model to compare the difference between epi-cardial and intramural arteries and reported that myocardial contraction only caused a slight increase in the maximum blood flow velocity [22]. In contrast, a computational model developed by Smith demonstrated that myocardial contraction played a dominant role in reducing systolic flow [19]. In 2011, Ohayon et al. developed a patient-specific finite element model to study the effect of myocardial contraction on coronary blood vessel wall stress and strain distribution [23]. They reported that myocardial contraction caused vascular wall strain stiffening, which would contribute to the initiation of atherosclerosis. However, how blood flow interacted with the vessel wall was not considered in that study.
In this study, we aimed to develop a comprehensive FSI model of the left anterior descending contrary artery, to quantify blood flow shear stress and vascular wall tensile strain. This model was established based on a patient-specific geometry, and incorporated transient blood flow, blood vessel cyclic bending-stretching motion, and myocardial contraction. Compared to the coronary artery models we developed previously, i.e., a rigid wall CFD model [24] and a FSI model with coronary bending motion [16], the current model had improved physiological relevance.
Materials and Methods
The Geometry.
The three-dimensional (3D) geometry of a LAD coronary artery was constructed based on the anatomical-computed tomography angiography (CTA) data acquired from a patient at Tianjin First Center Hospital in China (patient’s information was removed). The myocardial area was isolated using a 3D Slicer (Surgical Planning Labs, Boston, MA), and LAD was segmented using the colliding fronts segmentation algorithm of the Vascular Modeling Tool Kit (vmtk, an open source software2). The three-dimensional geometry of LAD was constructed and smoothed using solidworks (2015), and exported to ADINA (Version 9.2, ADINA R&D, Inc., Watertown, MA) for mesh generation (Fig. 1). The diameter of LAD at the inlet was 3.82 mm, and that at the outlet was 1.59 mm. The total length of the model was 7.45 cm (Fig. 1(a), and the thickness of the arterial wall was 0.25 mm [25].
Fig. 1.
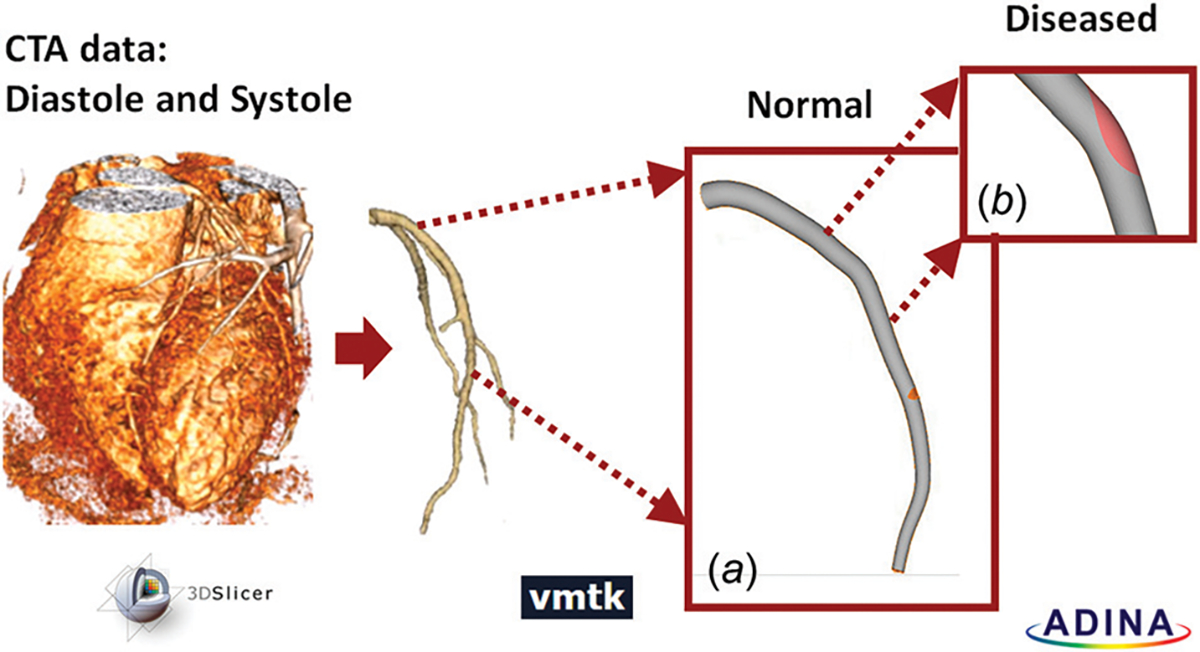
Patient-specific LAD segmentation workflow. Myocardium region was isolated from CTA data at diastole and at systole: (a) the LAD was segmented and prepared for mesh generation; (b) diseased condition was simulated by adding a 70% stenosis, 8mm downstream from the LAD inlet.
The patient’s coronary artery appeared healthy, and there was no visible stenosis within the artery. To investigate how atherosclerotic plaque and stenosis conditions affect coronary hemodynamics and blood vessel wall strain distribution, a 70% lumen narrowing was artificially created 8 mm downstream from the LAD inlet. A diffuse plaque was positioned on the pericardium side of the LAD lumen [26] (Fig. 1(b)). The width of the lesion area was 3.05 mm and the length was 6.78 mm, which were typical for a 70% stenosis in the left coronary artery [27]. Due to the presence of the “plaque,” the viscoelastic property of the lesioned LAD wall changed, and the details are provided below when material properties are discussed.
The Mesh.
Free-form triangular elements were generated for both the normal and the stenotic LAD geometries using the Delaunay meshing algorithm. The fluid domain (i.e., blood within the vessel) and the solid domain (i.e., the blood vessel wall) were meshed separately. To ensure mesh independence, mesh size (the number of elements) was increased gradually till the solution difference was less than 5%. The normal LAD consisted of 39,284 elements in the solid domain and 373,903 elements in the fluid domain. In the 70% stenosis model, the solid domain included the vascular wall and the plaque. There were 39,214 elements in the vascular wall, 30,778 elements within the plaque, and 374,517 elements in the fluid domain. For the stenosis model, adequate face linkage was employed to ensure nodal coincidence between the plaque and the arterial wall.
Material Properties.
The arterial wall and the plaque were defined as nonlinear elastic, anisotropic, and incompressible materials. Their mechanical behavior was described using the modified hyper-elastic Mooney–Rivlin model with added anisotropic effects [28]. These anisotropic properties resulted from randomly oriented or aligned collagenous fibers within the blood vessel wall, which could affect the response of the blood vessel to applied stress/strain significantly, especially when the strain is large.
The strain energy density function for the modified Mooney–Rivlin model (stress–strain relationship) is given by [28,29]
| (1) |
where ’s are strain invariants of the Cauchy-Green deformation tensor and are defined as the following:
| (2) |
| (3) |
| (4) |
| (5) |
| (6) |
’s are the reduced invariants [28,29], defined as the following:
| (7) |
| (8) |
The direction of the collagenous fibers are described by the normal vectors and with components and , respectively [28,29]. , , and are material constants chosen to match the experimental (tensile stretch and histology) data from human coronary arteries and calcified plaques, reported by Kural et al. [30] and Karimi et al. [31]. In those studies, the artery and plaque samples were pre-elongated by 5% during mechanical testing, simulating prestress conditions [30,31]. Table 1 summarizes the constants of the Mooney–Rivlin model and the added anisotropic properties.
Table 1.
The Mooney-Rivlin model constants and anisotropic constants for the normal vascular wall and the plaque.
Displacement, Bending, and Myocardial Compression.
During one cardiac cycle, LAD experienced large displacements due to cyclic bending and myocardial compression, which was prescribed based on the CTA data. Figure 2(a) depicts the centerline locations of LAD at the end of systole and diastole. The largest displacement occurred approximately 35 mm downstream from the inlet, and the outlet moved up/down by 7.5 mm. To simulate the cyclic bending motion of the blood vessel, displacement of the blood vessel was calculated based on the CTA data and prescribed along the inner LAD wall. The maximum radius of curvature displacement was 7.5 cm, occurring at 0.5 s during the cardiac cycle. Figure 2(b) depicts the displacement waveform (as a function of time) of the element with the largest displacement.
Fig. 2.
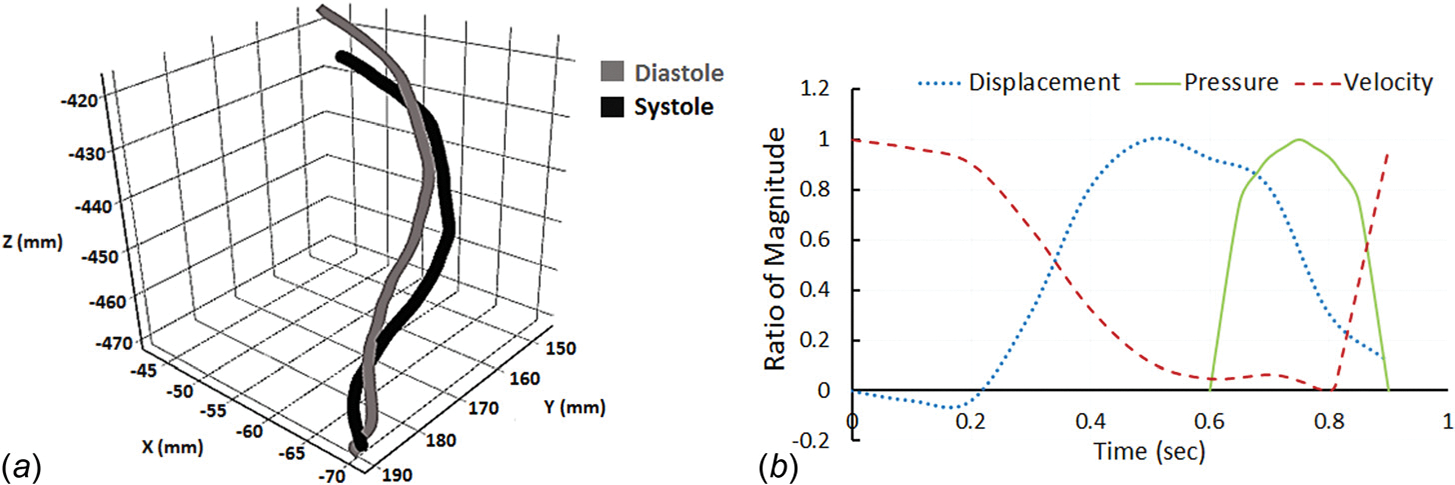
Input waveforms for the FSI model: (a) cyclic displacement of LAD was computed by tracking centerline locations of the LAD at the end of systole and diastole; (b) LAD wall displacement waveform (of the element with the largest displacement), pressure waveform induced by myocardial contraction, and inlet blood velocity waveform during one cardiac cycle (0.9 s). Displacement of the blood vessel varied between 0.3 mm and 7.5 mm, the maximum pressure induced by myocardial contraction was 25 kPa; inlet blood velocity varied between 0 and 15 cm/s. Values are presented as the ratio to the maximum magnitude.
The pressure induced by myocardial contraction was also included in the model. As depicted in Fig. 2(b), the squeezing of the cardiac muscles took place during systole, and the maximum pressure generated was 25 kPa [8]. This load was imposed on LAD through the outside blood vessel wall.
Blood Flow.
A transient blood flow velocity input was applied at the inlet of LAD (the velocity waveform in Fig. 2(b)). During one cardiac cycle, the flow rate within the LAD varied between 0 and 100 mL/min, corresponding to a mean velocity of 0–15 cm/s [32]. The maximum flow occurred during early diastole when the ventricles were relaxing, and the extravascular compression of the coronary arteries was absent. Blood flow was assumed laminar, and blood was modeled as an incompressible and Newtonian fluid with a density of 1060 kg/m3 and a dynamic viscosity of 3.5 cP. The LAD outlet was defined as a pressure outlet, with zero normal traction [16,24,33,34].
Fluid–Solid Interface.
The inner surface of the LAD wall and the outer boundary of the fluid volume were defined as the fluid–structure interface. At the interface, velocity and traction conditions were equal. The fluid domain was solved using the arbitrary Lagrangian–Eulerian formulation of the Navier–Stokes equations. The fluid and solid domains were fully coupled using a direct coupling method with a coupling composite time-step of 0.0025 s. Default convergence criteria (10−3 tolerance) were used for both the force and the displacement calculation.
Following numerical simulation, blood flow velocity and wall fluid shear stress (WSS) distribution were analyzed for the fluid domain. Blood vessel wall circumferential and axial strains were calculated for the solid domain. The results obtained from the normal LAD model were compared to those of the stenosis model.
Results
Blood Flow Velocity.
Transient velocity input was prescribed at the inlet of the LAD. As the blood vessel dislocated and the myocardial muscles compressed, blood flow velocity changed. Figure 3 depicts representative blood flow velocity distribution within the normal and stenosed LAD during one cardiac cycle. The beginning of diastole was defined as t = 0. 0.0175 s into the diastole, and approximately 8mm downstream from the inlet (enlarged area in Fig. 3(a)), blood flow velocity reached its maximum, i.e., 0.40 m/s, in the normal LAD. For the rest of the diastole, as blood pressure decreased, blood velocity decreased gradually. At the beginning of systole (t = 0.61 s), myocardial contraction started, squeezing the artery and accelerating the blood velocity back up to 0.42 m/s. Throughout the cardiac cycle, blood flow was laminar, with the Reynolds number varying between 27.6 and 551.
Fig. 3.
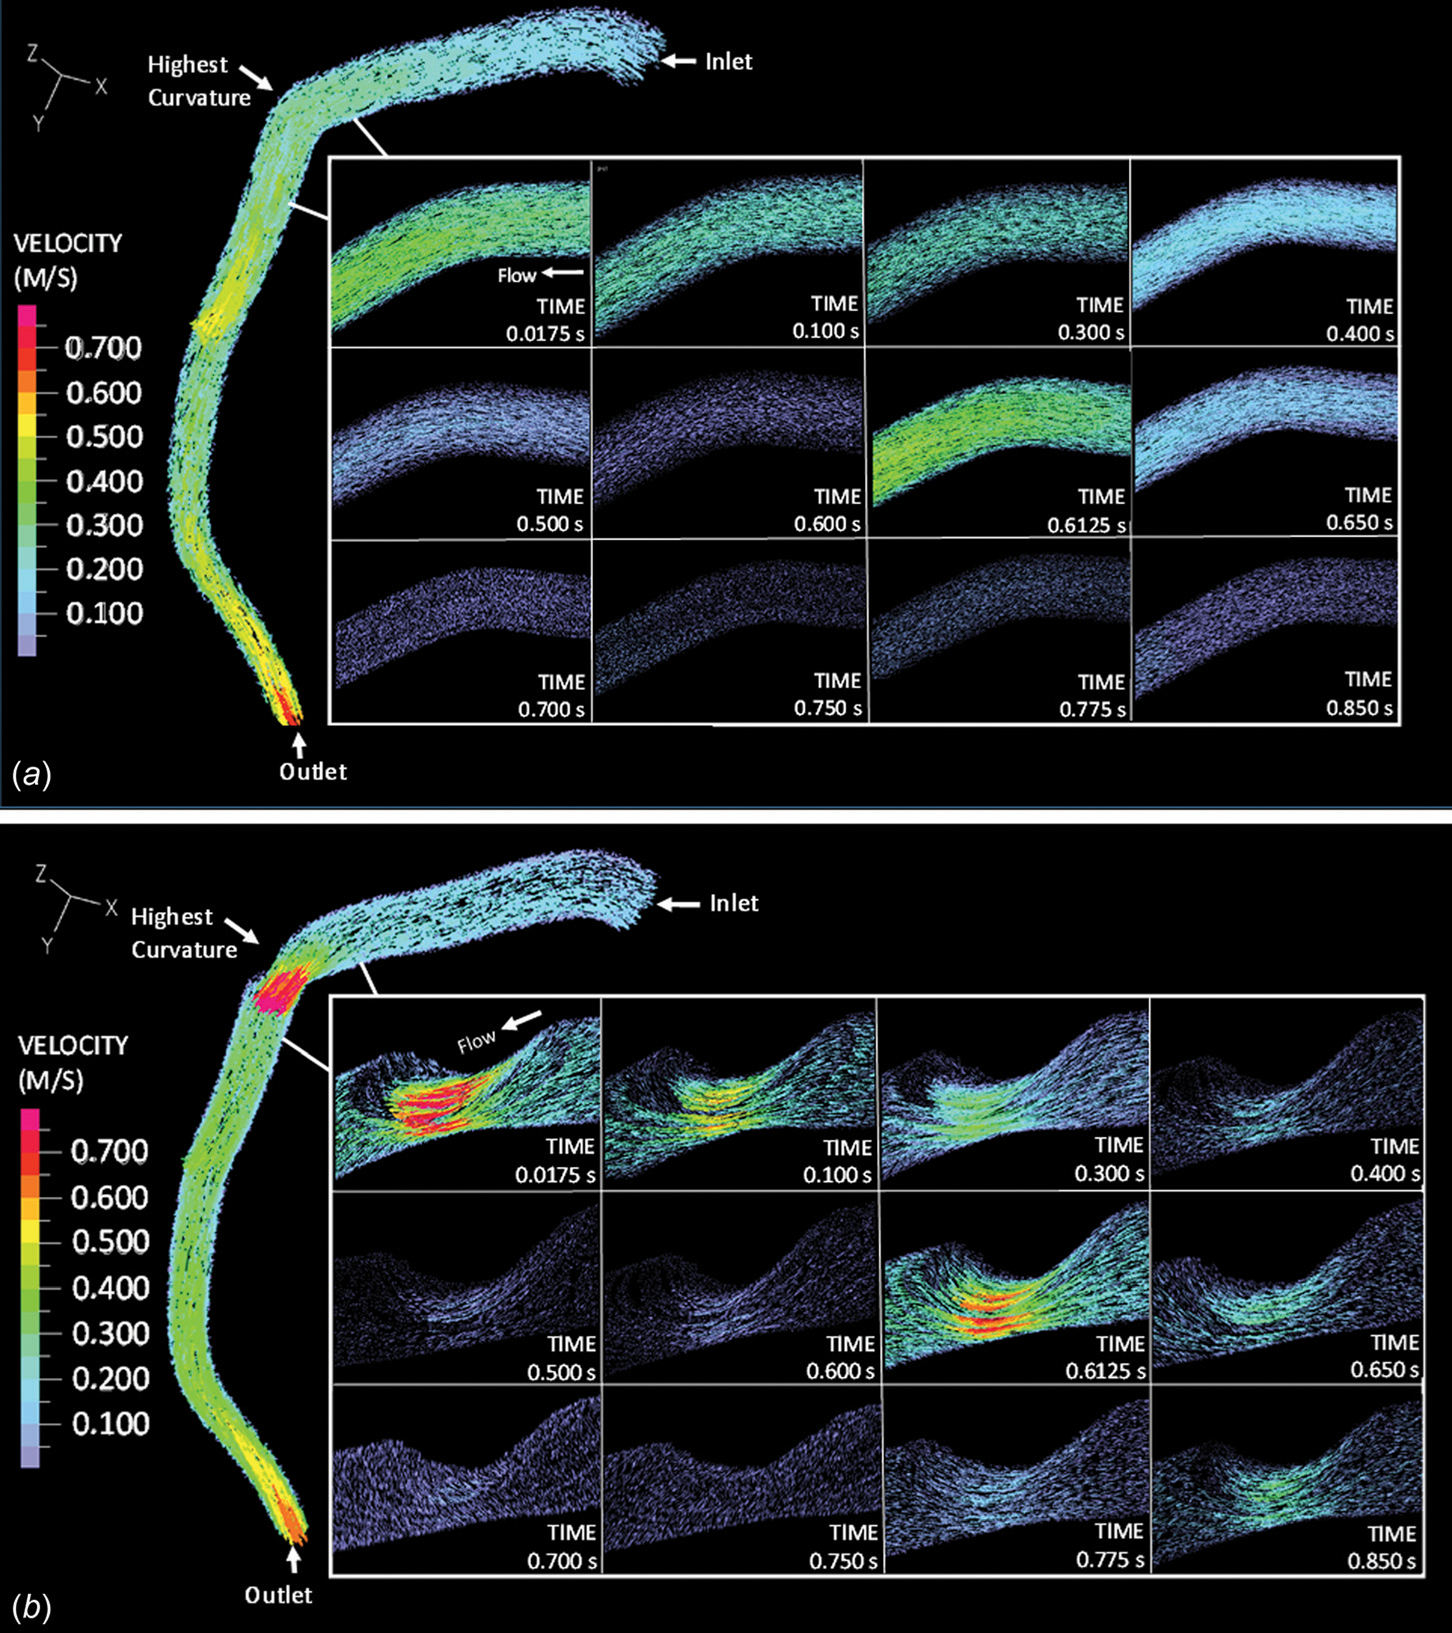
Blood flow velocity within (a) the normal LAD and (b) the stenosed LAD
Blood flow under the stenosis conditions (70%) followed a similar trend, but appeared more complex (Fig. 3(b)). At the stenosis throat, the maximum flow velocity (magnitude was 1.05 m/s) occurred at approximately 0.02 s, followed by a gradual decrease until the end of diastole. As systole started (t = 0.61 s), myocardial compression caused blood flow acceleration, and the velocity went up to 0.83 m/s. Flow detachment occurred downstream of the stenosis, generating a recirculation region. The average velocity of the oscillatory flow within the recirculation region (approximately 0.6 cm in length) was 0.075 m/s. With the presence of a 70% stenosis, the maximum Reynolds number increased to 757. The maximum and mean velocity, as well as the maximum Reynolds number of blood flow under normal and stenosis conditions are summarized in Table 2.
Table 2.
The maximum and mean velocity, maximum Reynolds number, maximum shear stress, maximum/mean WSS, and maximum/mean tensile strain values in the normal (point of interest is located 8mm downstream from the inlet) and stenotic (stenosis throat and recirculation region) LAD models
| Normal | Stenosis throat (on plaque) | Recirculation region | |
|---|---|---|---|
|
| |||
| Maximum velocity (m/s) | 0.42 | 1.05 | 0.225 |
| Mean velocity (m/s) | 0.21 | 0.35 | 0.11 |
| Maximum Reynolds number | 551 | 757 | 310 |
| Maximum shear stress (Pa) | 7.50 | 24.46 | 1.51 |
| Maximum WSS (Pa) | 2.63 | 10.3 | 0.9 |
| Mean WSS (Pa) | 1.2 | 3.7 | 0.3 |
| Maximum circumferential strain (%) | 10.8 | 4.50 | 9.00 |
| Mean circumferential strain (%) | 8.00 | 3.3 | 7.00 |
| Maximum axial strain (%) | 14 | 3.5 | 15.5 |
| Mean axial strain (%) | 8.5 | 1.3 | 10.5 |
Maximum Shear Stress.
The maximum shear stress along the vascular wall was calculated by ADINA directly and depicted in Fig. 4. The maximum shear stress was defined as one-half of the difference between the maximum and minimum principal stress. In a normal artery (Fig. 4(a)), near the inlet, maximum shear stress was always less than 2 Pa. Downstream at the point of the highest curvature, maximum shear stress varied between 0.5 and 6 Pa during the cardiac cycle. Arterial bending did not seem to impact vascular wall maximum shear stress much. However, with the presence of a 70% stenosis, vascular wall maximum shear stress increased significantly to over 10 Pa (Fig. 4(b)). WSS was calculated based on the local shear strain rate and effective viscosity. The maximum and mean WSS values are summarized in Table 2.
Fig. 4.
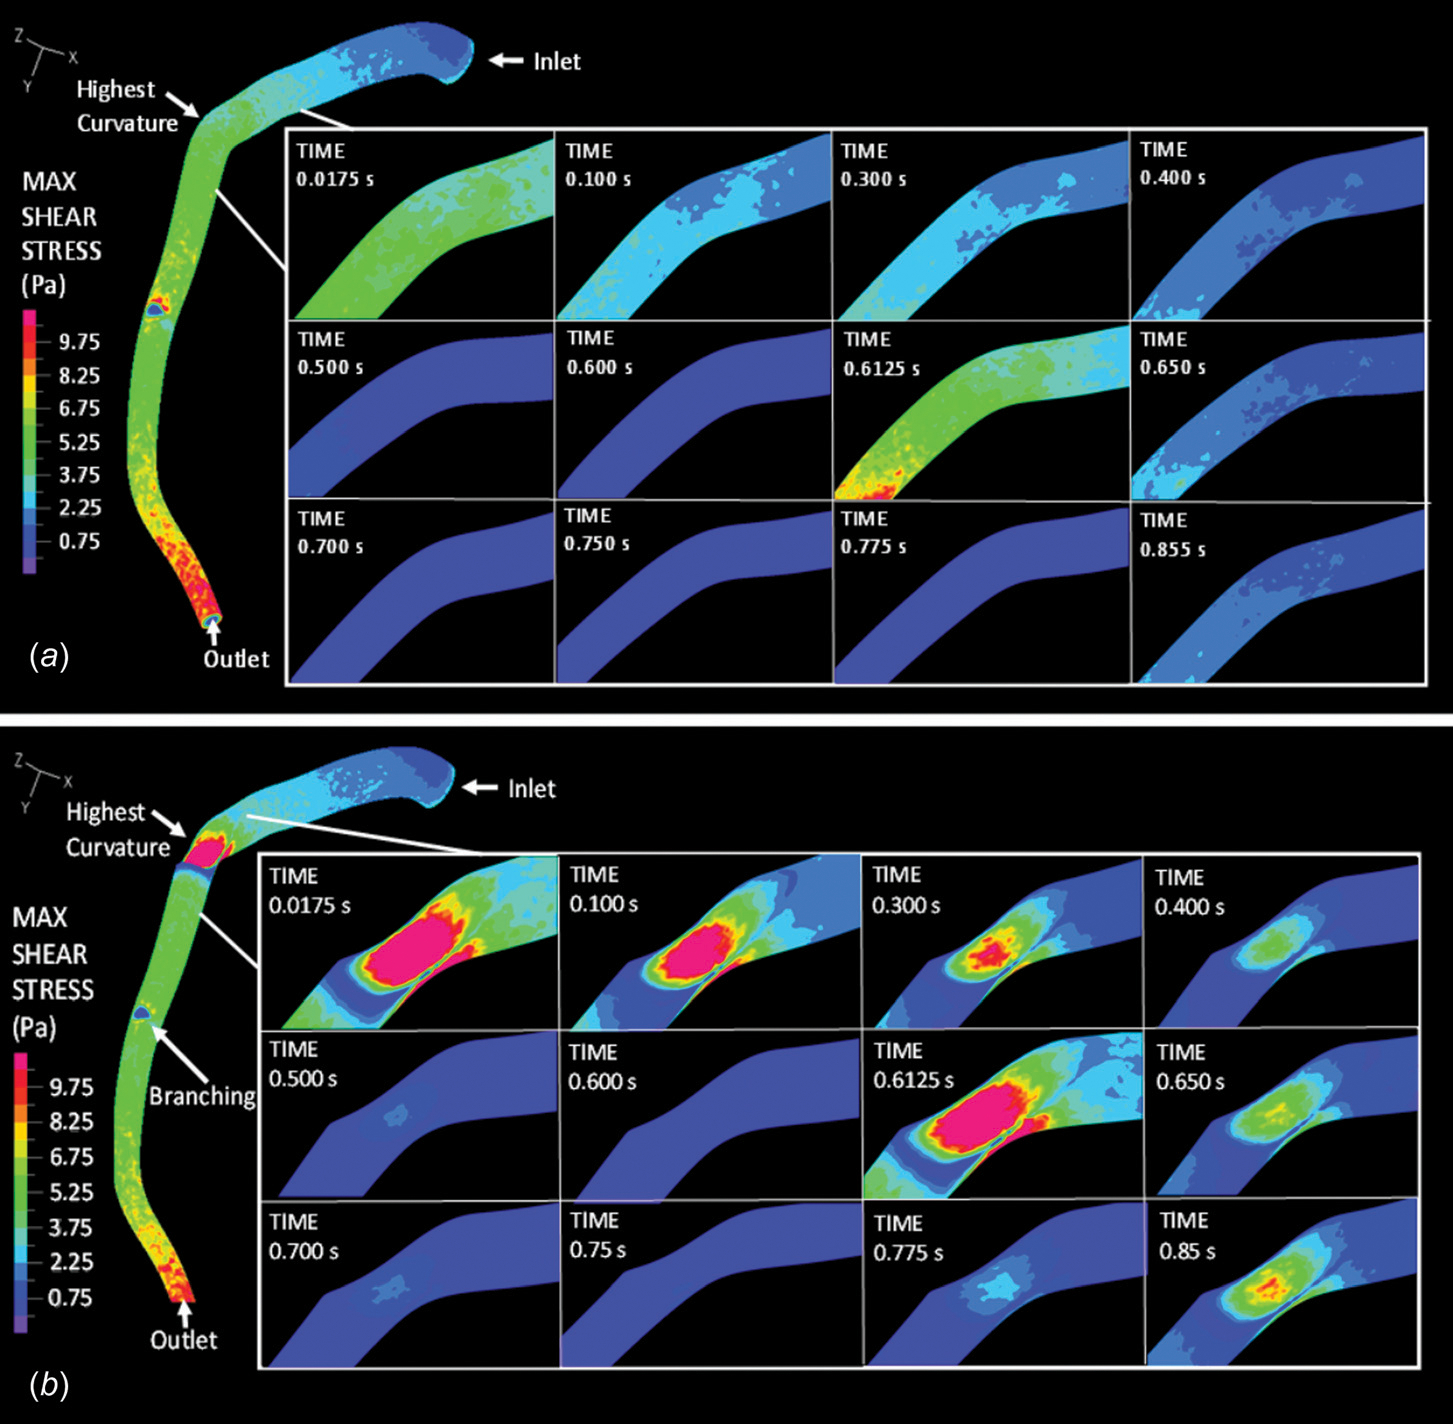
The maximum shear stress along the vascular wall under (a) normal and (b) stenosis conditions within the LAD
Strain.
The cyclic bending motion of LAD and myocardial contraction contributed greatly to the axial and circumferential strain developed within the blood vessel wall. Figure 5 depicts the circumferential (a) and axial (b) strain distribution within the vascular wall under normal and stenosis conditions. In the normal LAD, at midsystole (t = 0.75 s), myocardial contraction generated the most compression and resulted in a maximum circumferential strain of 10.8% and a maximum axial strain of 14%. During diastole (e.g., at t = 0.3 s), at the same location, the circumferential strain decreased to 2%, and the axial strain to 1.5%. Typical cross-sectional views of the LAD are depicted in Fig. 5. Changes in the blood vessel lumen size during the cardiac cycle are noticeable.
Fig. 5.
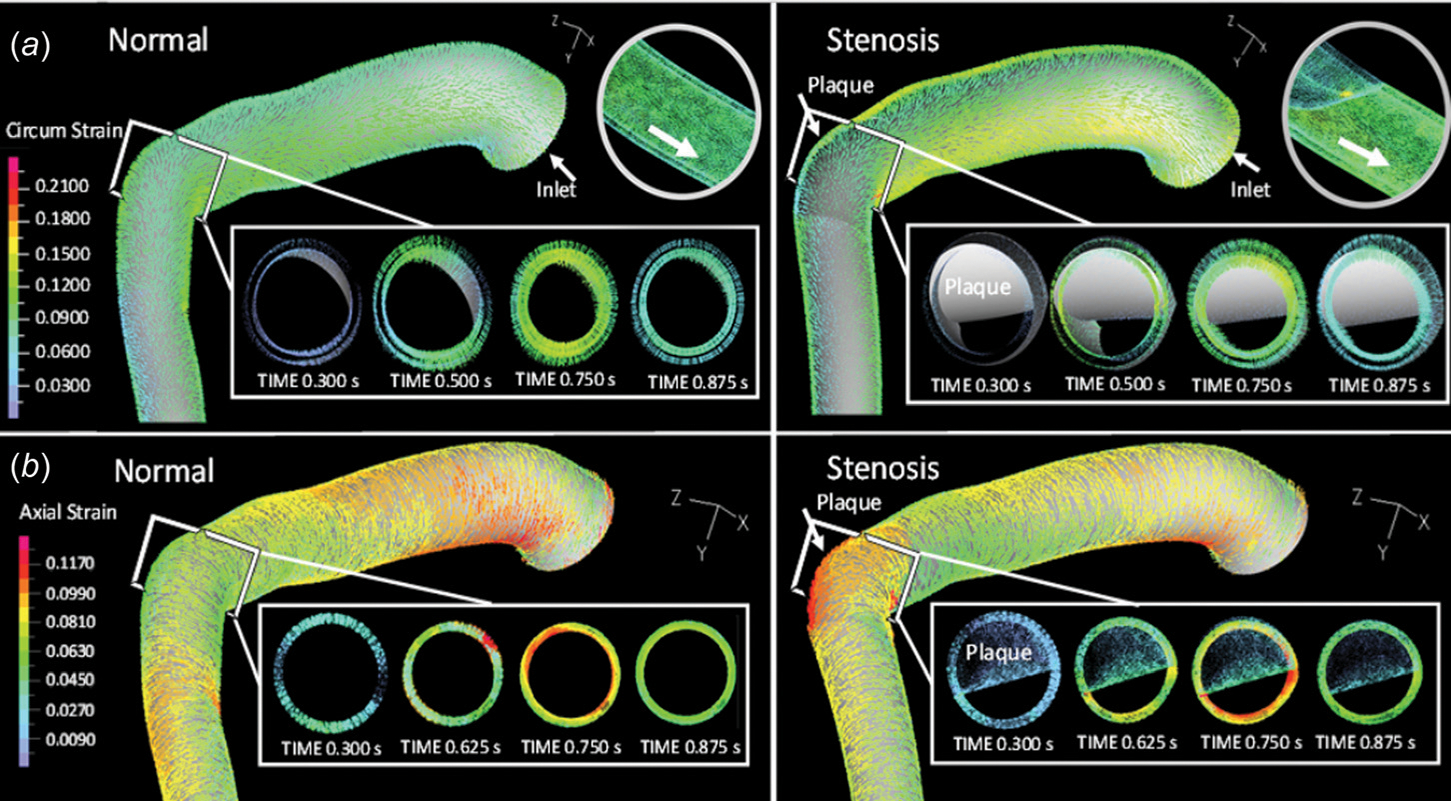
Vascular wall (a) circumferential and (b) axial strain distribution within the normal and stenosed LAD
Under stenosis conditions, near the stiffer plaque, the maximum circumferential strain within the vascular wall dropped to 4.5%, and the maximum axial strain to 3.5% during systole (Figs. 5(a) and 5(b), right panels). During early diastole, when myocardial contraction was absent and LAD was undergoing minimum bending, both circumferential and axial strain remained low (<2%) within the LAD wall (e.g., t = 0.3 s). Downstream from the plaque, within the recirculation region, the maximum circumferential strain was approximately 9%, and the maximum axial strain was 15% (data not shown in Fig. 5), similar to those observed with the normal LAD model.
Time-Variable Wall Fluid Shear Stress and Tensile Strain.
Figure 6 depicts representative wall fluid shear stress and tensile strain waveforms as functions of time, from randomly selected wall elements under normal and stenosis conditions. During one cardiac cycle, a wall element within a normal LAD experienced pulsatile shear stress and cyclic tensile strain simultaneously. For this wall element, the magnitude of wall fluid shear stress was 1 Pa, and that of the circumferential strain and axial strain were 7% and 8.4%, respectively (Fig. 6, normal). With a 70% stenosis, due to the narrowed lumen and the increased stiffness of the wall/plaque, wall fluid shear stress of a wall element located in the plaque area increased to 3.7 Pa, circumferential strain decreased to 3%, and axial strain to 2.9% (Fig. 6, stenosis throat). For a wall element located within the recirculation region, wall fluid shear stress decreased to 0.7 Pa, circumferential strain to 5%, and axial strain to 7.2% (Fig. 6, recirculation region). Also, under all conditions, in one cardiac cycle (0.9 s), two shear stress peaks occurred (instead of one peak, as reported by our previous model, which did not consider myocardial contraction [16]).
Fig. 6.
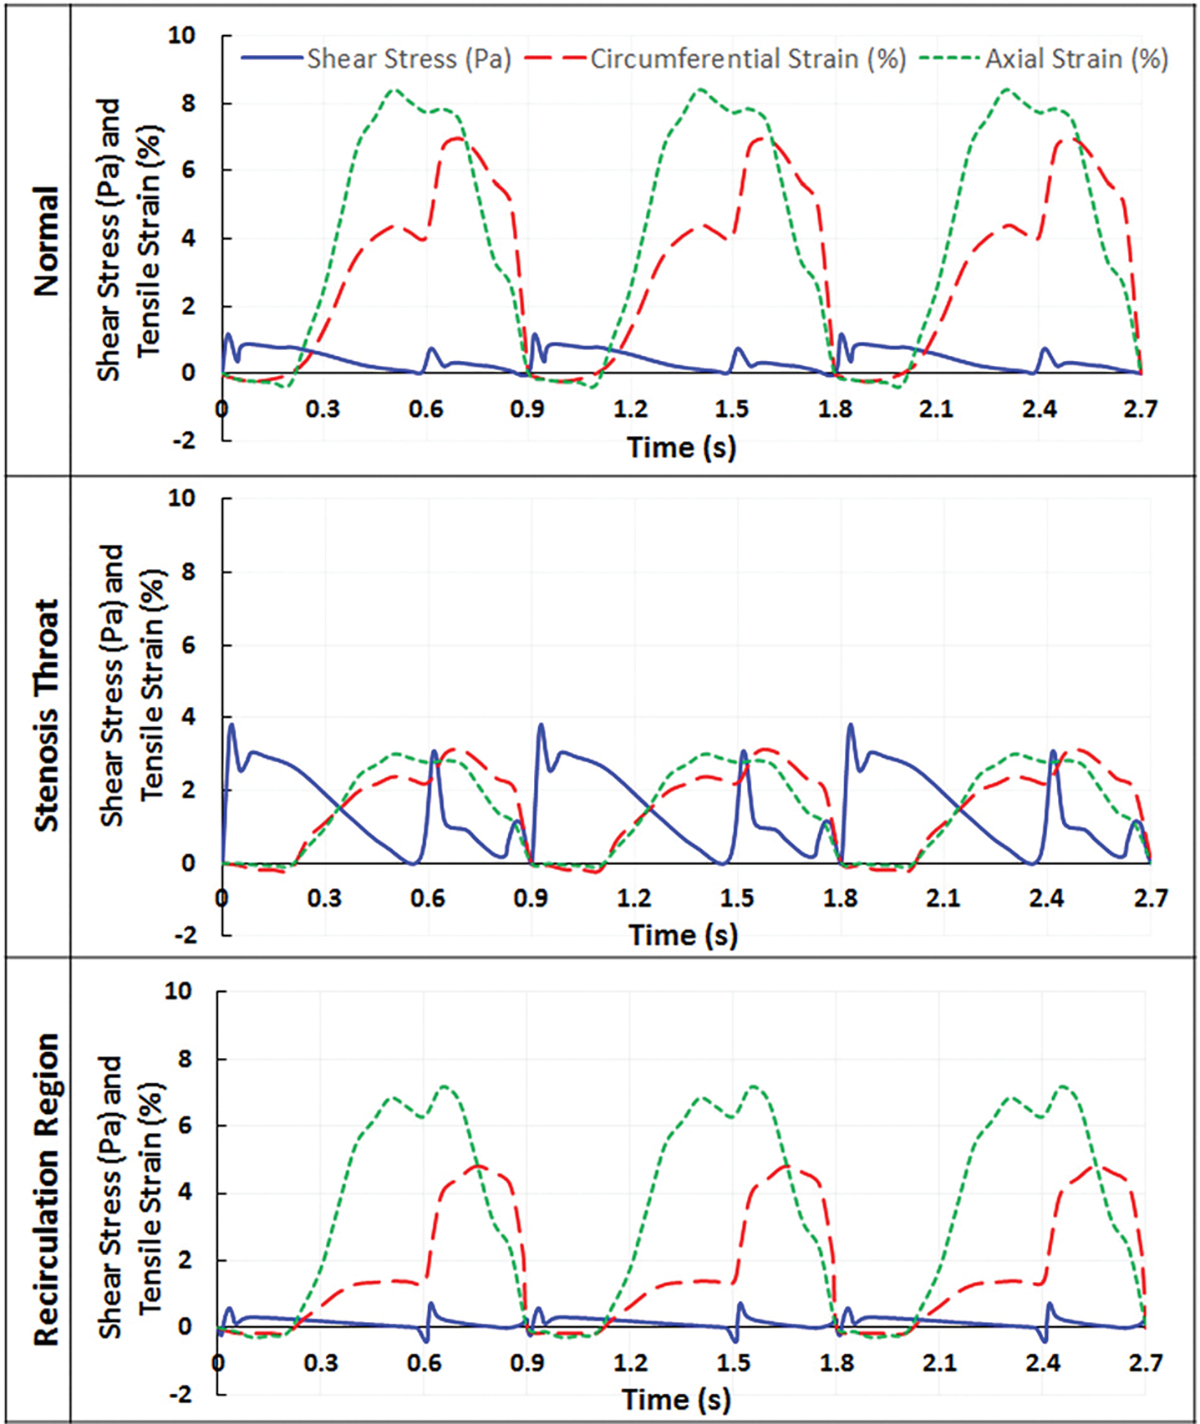
Wall fluid shear stress and tensile strain as a function of time in normal and stenosed LAD, when myocardial compression was included in the model
To evaluate how much myocardial contraction contributes to changes in blood vessel wall fluid shear stress and tensile strain, the normal and stenosed LAD models were also run without myocardial compression, i.e., in those models, the deformation of the blood vessel wall was mainly induced by the bending motion of the vessel and changes of blood pressure. Typical wall fluid shear stress and tensile strain waveforms without myocardial compression are demonstrated in Fig. 7. In the normal LAD model without compression, the magnitude of wall fluid shear stress was similar to that observed in the model with myocardium compression, which was approximately 1 Pa (Fig. 7, normal). However, the second surge in shear stress due to myocardial contraction disappeared during systole. Axial strain remained similar (7.3%) since axial strain was mostly induced by the bending motion of the vessel. Circumferential strain decreased to 2.9%. A similar trend was observed with the stenosis model. Near the plaque, the wall fluid shear stress magnitudes remained almost the same compared to that of the compressed model, i.e., 3.7 Pa at the stenosis throat and 0.7 Pa within the recirculation region. Similar to the normal model without compression, the second shear stress peak disappeared in the noncompressed stenosis model. The axial strain values remained similar at the stenosis throat, i.e., 3%, and slightly differed within the recirculation region (6.2% compared to 7.2%). However, the lack of compression resulted in a large decrease in circumferential strain within the recirculation region (from 5% to 3.7%) and at stenosis throat (from 3% to 1.9%).
Fig. 7.
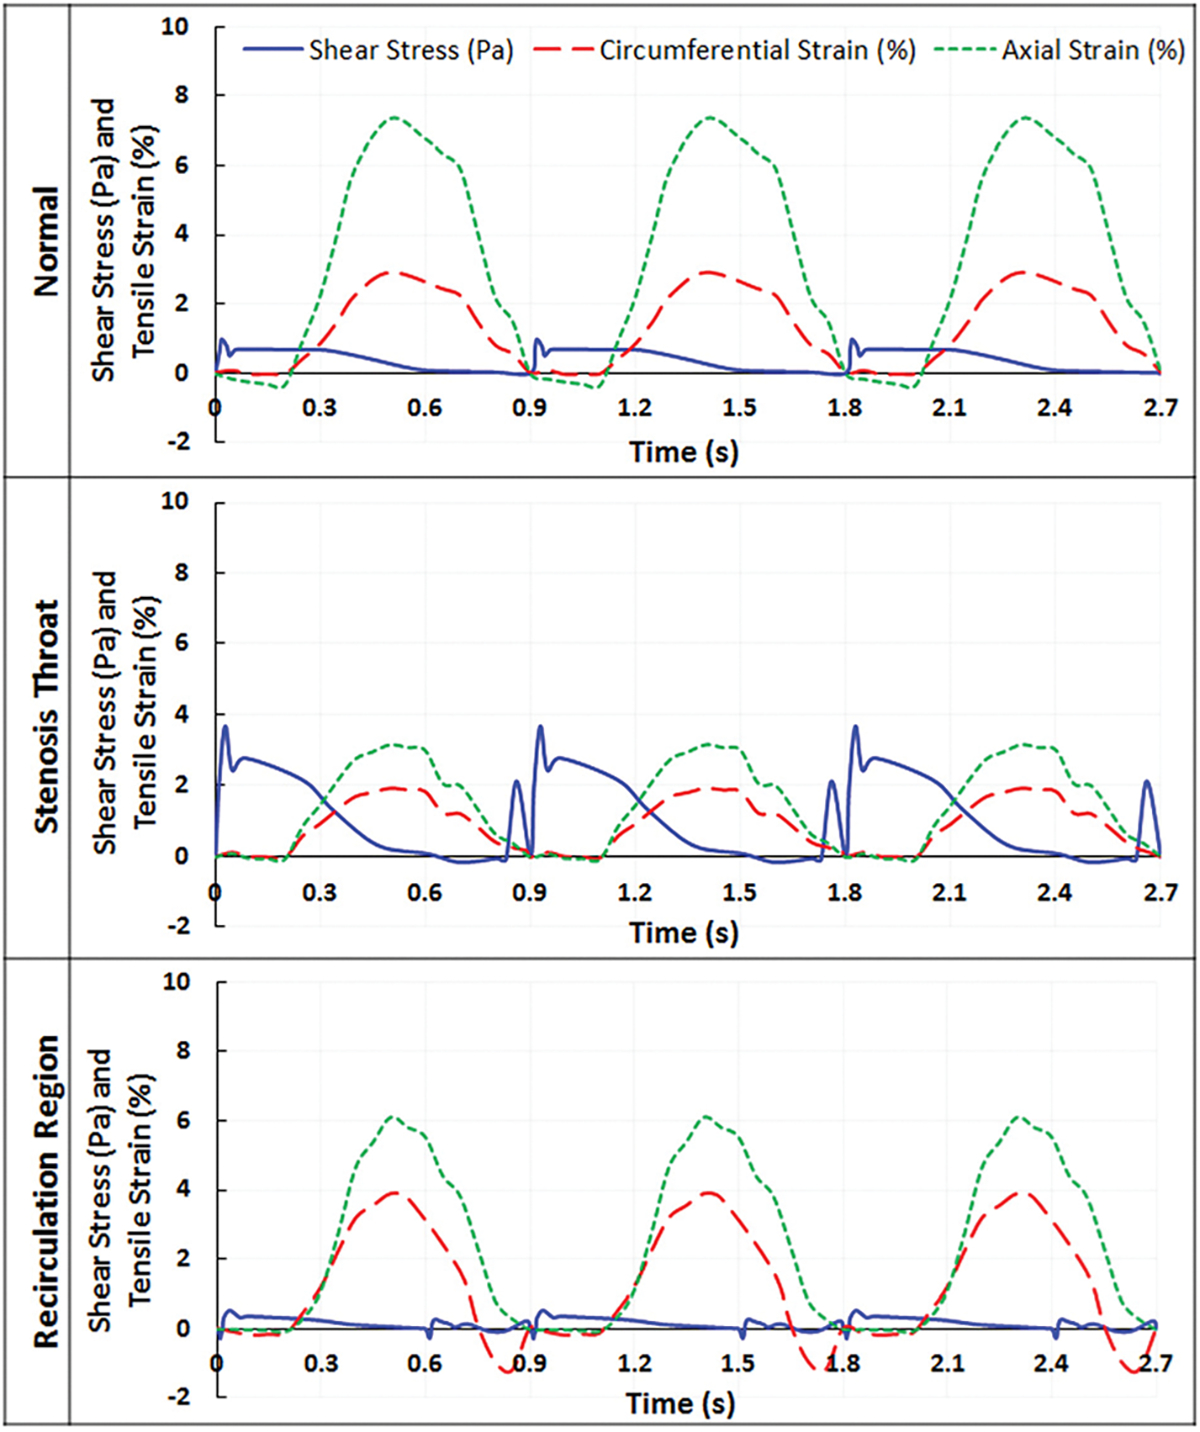
Wall fluid shear stress and tensile strain as a function of time in normal and stenosed LAD, when myocardial compression was not included in the model
Discussion
The left coronary artery models developed in this study incorporated transient blood flow, blood vessel motion (bending and stretching), and myocardial contraction. How blood flow, blood vessel motion, and cardiac muscle contraction collectively affected coronary artery hemodynamics and vascular wall stress/strain distribution was investigated.
We have previously reported a left coronary artery FSI model considering both dynamic blood flow and vessel stretching-bending motion [16]. This study improved the previous model by simulating a longer portion of the left anterior descending artery (the total length of the current model increased by 50%). It also improved the physiological relevance by incorporating patient’s specific geometry and myocardial contraction. The results indicated that myocardial contraction had a significant effect on all hemodynamic parameters.
Compared to our previously reported FSI model [16], velocity magnitudes estimated by the current model were much higher. In the earlier study, the maximum blood flow velocity within the normal LAD was estimated to be 0.18 m/s; in the current model, the maximum blood flow velocity was 0.42 m/s, which was in agreement with echo Doppler measurements in patients with normal coronary blood flow [35]. With the presence of a 70% stenosis, velocity increased near the stenosis throat. The previous model predicted a maximum stenosis flow velocity of 0.31 m/s and the current model 1 m/s. Furthermore, myocardial contraction during systole caused a second surge in blood velocity, which was absent from the previous model, and the same model run without myocardial compression. This is consistent with that observed by van Wolferen et al. in a clinical study [36], where coronary blood flow was measured by magnetic resonance imaging and a second peak in LAD flow was noticeable in control patients. Also, a recirculation region formed downstream of the stenosis, and the size of the recirculation zone varied between 0.07 mm (during systole) and 0.6 mm (during systole), which was much smaller than that predicted using the previous model. These differences were likely caused by the inconsistency in geometry [24], boundary conditions, and degrees-of-freedom [37] between the two models, as well as the myocardial contraction.
Fluid shear stress at the vascular wall was also calculated using the present model. In the current normal LAD model, the maximum wall fluid shear stress was 2.63 Pa. With the presence of a 70% stenosis, the maximum wall fluid shear stress near the stenosis throat went up to 10 Pa, and that within the recirculation region never exceeded 0.9 Pa. These values are comparable to those reported in the literature, that fluid shear stress below 1 Pa was considered pathologically low, between 1 and 2.5 Pa was considered normal (or physiological), and over 2.5 Pa was considered pathologically high [38–42]. The current model also estimated that in a normal LAD, the maximum shear stress within the vascular wall was 7.5 Pa, which is similar to that reported in the literature [38].
For the tensile strain developed in the vascular wall, axial strain was more prominent during the bending motion (mostly in diastole), while circumferential strain changed largely during systole once the myocardial compression started. Under normal conditions, the axial strain within the LAD could reach a maximum value of 14%, which increased to 15.5% under stenosis conditions. These values are in agreement with those reported by others. Yamamoto et al. measured the amount of compression in the LAD associated with cardiac contractions, using multiplanar reconstruction and enhanced CT images [43]. They reported an axial strain of 15.6±26.4% (mean ± standard deviation) in normal LAD, and 17.1±30.8% in stenosed LAD. A study by Ohayon et al. also reported similar axial strain values of 13.90±8.92 [23].
Using the current model, it was estimated that the maximum circumferential strain in the normal LAD was 10.8% and that near the plaque in a stenosed LAD was 4.5%. These estimations are comparable to those reported by in vivo studies using intravascular ultrasound. Liang et al. reported a 5–10% circumferential strain in normal regions of the LAD wall, and a 0–2% strain in the luminal area facing an eccentric plaque [44]. The slight difference here could be due to different plaque compositions, as mechanical properties of plaques change with their composition (calcified, soft, or mixed), which varies greatly among patients [45].
One limitation of the current FSI model is that the vascular wall was assumed to have a uniform thickness, which is not always the case in vivo. It was suggested by Choy and Kassab that coronary artery intimal-media thickness would affect transmural loading from intramyocardial pressure on the blood vessel wall, and thus affects left coronary artery mechanical adaptation and remodeling [46]. Under disease conditions, as atherosclerotic lesion/plaque grows, intima undergoes pathological thickening due to local inflammation and the accumulation of extracellular lipids [47]. This can alter the mechanical/material properties of the vascular wall and is likely to change local stress/strain distribution. Even though it is not fully understood how variations in the wall thickness affects vascular wall stress/strain distribution and coronary artery hemodynamics [23,25,48,49], it may be necessary to consider it in our future studies. In addition, anisotropic properties need to be described for the lesioned intima and plaque area, to further improve the accuracy of the model estimation.
A “traction-free” outlet boundary condition was used in the current model for simplicity. As pointed out by Moon et al., without considering the downstream flow resistance, a zero-pressure outlet boundary condition often led to inaccurate estimation of flow conditions [50]. Therefore, to improve the current model, proper pressure outlet boundary conditions (such as the “impedance” model [34]) will need to be imposed.
This model only simulated a portion of the left anterior descending artery, without considering the left main coronary artery and the left circumflex artery. The inlet blood velocity (coming off from the left main artery) was calculated based on coronary artery flow rate and previous studies [16,24,33]. Left coronary artery bifurcation geometry and hemodynamics within the left circumflex artery could affect blood flow within the left anterior descending artery [12]. However, due to the limitation in our simulation capability, the current model cannot properly prescribe the bending–stretching motion of the anterior descending artery and the left circumflex artery (including the bifurcation) at the same time. This will be another area to improve in the future.
Compared to our previous effort, this is a larger and more physiologically relevant LAD FSI model. It not only considered transient blood flow and vessel bending/stretching motion, but also included myocardium contraction. The results indicated that along with LAD cyclic stretching and bending motion [16,51,52], myocardial contraction exerted a substantial mechanical stress/strain on the arterial wall and had a significant effect on coronary hemodynamics and mechanical loading conditions. In the current model, myocardial contraction-induced pressure was imposed perpendicular to the blood vessel wall, uniformly all around the outer LAD wall. This does not match physiological conditions precisely. Based on a study reported by Ziadinov and Al-Sabti [53], only about 60% of the coronary artery is embedded within the cardiac muscle (border proximal and middle portion of the coronary artery). The proximal portion of the LAD could be partially embedded. Our incapability to impose heterogeneous external pressure partially on the LAD wall is another limitation of the current model. Also, the patient-specific CTA data did not provide any information on myocardial contraction-induced pressure. Such information was not available in the literature either. The external pressure waveform used in the current model was based on a study by Vis et al. [8], which reported the pressure–area relationship for coronary artery embedded in cardiac muscle in diastole and systole. Based on the reported intramural pressure to keep the artery open and the muscle pressure that caused significant decrease in blood vessel lumen size (in situ), a maximum external pressure of 25 kPa was applied to the outside of the blood vessel wall, to simulate myocardial contraction. Changes in this myocardial contraction-induced pressure resulted in changes in blood flow velocity, shear stress, and wall strain (data not shown), indicating that coronary hemodynamics was sensitive to myocardial contraction.
Even though there are a few areas that need to be improved in the future studies, stress/strain values estimated using this current model agreed well with those reported in the literature (numerical simulation or in vivo measurement), validating the improved physiological relevance and accuracy of the model. Coronary artery shear stress and tensile strain conditions estimated using this FSI model can be employed by in vitro studies to investigate how coronary biomechanics affect vascular wall endothelial cell pathophysiological responses during atherosclerosis development [6].
Acknowledgment
We would like to thank Dr. Hongyan Ni from Tianjin First Center Hospital for providing patient’s specific CTA data for model development.
Funding Data
• American Heart Association Grant-in-Aid Award (Grant No. 16GRNT30440002).
Footnotes
Contributor Information
Daphne Meza, Biomedical Engineering Department, Stony Brook University, Stony Brook, NY 11794.
David A. Rubenstein, Biomedical Engineering Department, Stony Brook University, Stony Brook, NY 11794
Wei Yin, Biomedical Engineering Department, Stony Brook University, Room 109, Stony Brook, NY 11794.
References
- [1].Aggarwal R, Ferenxzi E, and Muirhead N, 2007, One Stop Doc Cardiology, CRC Press, Boca Raton, FL. [Google Scholar]
- [2].Harsh M, 2010, Textbook of Pathology, Jaypee Brothers Medical Publishers (P) Ltd., New Delhi, India. [Google Scholar]
- [3].CDC Wonder Online Database, 2013, “Underlying Cause of Death 1999–2013 on CDC Wonder Online Database,” Atlanta, GA. [Google Scholar]
- [4].Cunningham KS, and Gotlieb AI, 2005, “The Role of Shear Stress in the Pathogenesis of Atherosclerosis,” Lab. Invest, 85(1), pp. 9–23. [DOI] [PubMed] [Google Scholar]
- [5].Jufri NF, Mohamedali A, Avolio A, and Baker MS, 2015, “Mechanical Stretch: Physiological and Pathological Implications for Human Vascular Endothelial Cells,” Vasc. Cell, 7(1), p. 8. [DOI] [PMC free article] [PubMed] [Google Scholar]
- [6].Meza D, Abejar L, Rubenstein DA, and Yin W, 2016, “A Shearing-Stretching Device That Can Apply Physiological Fluid Shear Stress and Cyclic Stretch Concurrently to Endothelial Cells,” ASME J. Biomech. Eng, 138(3), p. 4032550. [DOI] [PubMed] [Google Scholar]
- [7].Tecelao SR, Zwanenburg JJ, Kuijer JP, and Marcus JT, 2006, “Extended Harmonic Phase Tracking of Myocardial Motion: Improved Coverage of Myocardium and Its Effect on Strain Results,” J. Magn. Reson. Imaging, 23(5), pp. 682–690. [DOI] [PubMed] [Google Scholar]
- [8].Vis MA, Sipkema P, and Westerhof N, 1995, “Modeling Pressure-Area Relations of Coronary Blood Vessels Embedded in Cardiac Muscle in Diastole and Systole,” Am. J. Physiol, 268(6 Pt. 2), pp. H2531–H2543. [DOI] [PubMed] [Google Scholar]
- [9].Qiu Y, and Tarbell JM, 2000, “Numerical Simulation of Pulsatile Flow in a Compliant Curved Tube Model of a Coronary Artery,” ASME J. Biomech. Eng, 122(1), pp. 77–85. [DOI] [PubMed] [Google Scholar]
- [10].Santamarina A, Weydahl E, Siegel JM Jr., and Moore JE Jr., 1998, “Computational Analysis of Flow in a Curved Tube Model of the Coronary Arteries: Effects of Time-Varying Curvature,” Ann. Biomed. Eng, 26(6), pp. 944–954. [DOI] [PubMed] [Google Scholar]
- [11].Van Langenhove G, Wentzel JJ, Krams R, Slager CJ, Hamburger JN, and Serruys PW, 2000, “Helical Velocity Patterns in a Human Coronary Artery: A Three-Dimensional Computational Fluid Dynamic Reconstruction Showing the Relation With Local Wall Thickness,” Circulation, 102(3), pp. E22–E24. [DOI] [PubMed] [Google Scholar]
- [12].Malve M, Gharib AM, Yazdani SK, Finet G, Martinez MA, Pettigrew R, and Ohayon J, 2015, “Tortuosity of Coronary Bifurcation as a Potential Local Risk Factor for Atherosclerosis: CFD Steady State Study Based on In Vivo Dynamic CT Measurements,” Ann. Biomed. Eng, 43(1), pp. 82–93. [DOI] [PMC free article] [PubMed] [Google Scholar]
- [13].Mahalingam A, Gawandalkar UU, Kini G, Buradi A, Araki T, Ikeda N, Nicolaides A, Laird JR, Saba L, and Suri JS, 2016, “Numerical Analysis of the Effect of Turbulence Transition on the Hemodynamic Parameters in Human Coronary Arteries,” Cardiovasc. Diagn. Ther, 6(3), pp. 208–220. [DOI] [PMC free article] [PubMed] [Google Scholar]
- [14].Taylor CA, and Figueroa CA, 2009, “Patient-Specific Modeling of Cardiovascular Mechanics,” Annu. Rev. Biomed. Eng, 11(1), pp. 109–134. [DOI] [PMC free article] [PubMed] [Google Scholar]
- [15].Torii R, Wood NB, Hadjiloizou N, Dowsey AW, Wright AR, Hughes AD, Davies J, Francis DP, Mayet J, Yang G-Z, Thom SAM, and Xu XY, 2009, “Fluid–Structure Interaction Analysis of a Patient-Specific Right Coronary Artery With Physiological Velocity and Pressure Waveforms,” Commun. Numer. Methods Eng, 25(5), pp. 565–580. [Google Scholar]
- [16].Hasan M, Rubenstein DA, and Yin W, 2013, “Effects of Cyclic Motion on Coronary Blood Flow,” ASME J. Biomech. Eng, 135(12), p. 121002. [DOI] [PubMed] [Google Scholar]
- [17].Zeng D, Ding Z, Friedman MH, and Ethier CR, 2003, “Effects of Cardiac Motion on Right Coronary Artery Hemodynamics,” Ann. Biomed. Eng, 31(4), pp. 420–429. [DOI] [PubMed] [Google Scholar]
- [18].Tang D, Yang C, Kobayashi S, Zheng J, Woodard PK, Teng Z, Billiar K, Bach R, and Ku DN, 2009, “3D MRI-Based Anisotropic FSI Models With Cyclic Bending for Human Coronary Atherosclerotic Plaque Mechanical Analysis,” ASME J. Biomech. Eng, 131(6), p. 061010. [DOI] [PMC free article] [PubMed] [Google Scholar]
- [19].Smith NP, 2004, “A Computational Study of the Interaction Between Coronary Blood Flow and Myocardial Mechanics,” Physiol. Meas, 25(4), pp. 863–877. [DOI] [PubMed] [Google Scholar]
- [20].Cookson AN, Lee J, Michler C, Chabiniok R, Hyde E, Nordsletten DA, Sinclair M, Siebes M, and Smith NP, 2012, “A Novel Porous Mechanical Framework for Modelling the Interaction Between Coronary Perfusion and Myocardial Mechanics,” J. Biomech, 45(5), pp. 850–855. [DOI] [PMC free article] [PubMed] [Google Scholar]
- [21].Spann JA, 1993, “Heart Contraction and Coronary Blood Flow,” Recent Advances in Coronary Circulation, Springer, Tokyo, Japan, pp. 60–68. [Google Scholar]
- [22].Zhang W, Herrera C, Atluri SN, and Kassab GS, 2004, “Effect of Surrounding Tissue on Vessel Fluid and Solid Mechanics,” ASME J. Biomech. Eng, 126(6), pp. 760–769. [DOI] [PubMed] [Google Scholar]
- [23].Ohayon J, Gharib AM, Garcia A, Heroux J, Yazdani SK, Malve M, Tracqui P, Martinez MA, Doblare M, Finet G, and Pettigrew RI, 2011, “Is Arterial Wall-Strain Stiffening an Additional Process Responsible for Atherosclerosis in Coronary Bifurcations?: An In Vivo Study Based on Dynamic CT and MRI,” Am. J. Physiol. Heart Circ. Physiol, 301(3), pp. H1097–H1106. [DOI] [PMC free article] [PubMed] [Google Scholar]
- [24].Shanmugavelayudam SK, Rubenstein DA, and Yin W, 2010, “Effect of Geometrical Assumptions on Numerical Modeling of Coronary Blood Flow Under Normal and Disease Conditions,” ASME J. Biomech. Eng, 132(6), p. 061004. [DOI] [PubMed] [Google Scholar]
- [25].Gradus-Pizlo I, Bigelow B, Mahomed Y, Sawada SG, Rieger K, and Feigenbaum H, 2003, “Left Anterior Descending Coronary Artery Wall Thickness Measured by High-Frequency Transthoracic and Epicardial Echocardiography Includes Adventitia,” Am. J. Cardiol, 91(1), pp. 27–32. [DOI] [PubMed] [Google Scholar]
- [26].Oviedo C, Maehara A, Mintz GS, Araki H, Choi SY, Tsujita K, Kubo T, Doi H, Templin B, Lansky AJ, Dangas G, Leon MB, Mehran R, Tahk SJ, Stone GW, Ochiai M, and Moses JW, 2010, “Intravascular Ultrasound Classification of Plaque Distribution in Left Main Coronary Artery Bifurcations: Where Is the Plaque Really Located?,” Circ. Cardiovasc. Interv, 3(2), pp. 105–112. [DOI] [PubMed] [Google Scholar]
- [27].Zandwijk JK, 2014, Dynamic Geometry and Plaque Development in the Coronary Arteries, Department of Radiology & Center for Medical Imaging – North East Netherlands, University of Groningen, Groningen. [Google Scholar]
- [28].Holzapfel GA, Gasser TC, and Ogden RW, 2000, “A New Constitutive Framework for Arterial Wall Mechanics and a Comparative Study of Material Models,” J. Elasticity Phys. Sci. Solids, 61(1), pp. 1–48. [Google Scholar]
- [29].ADINA R&D, Inc., 2012, ADINA Theory and Modeling Guide, ADINA R&D, Watertown, MA. [Google Scholar]
- [30].Kural MH, Cai M, Tang D, Gwyther T, Zheng J, and Billiar KL, 2012, “Planar Biaxial Characterization of Diseased Human Coronary and Carotid Arteries for Computational Modeling,” J. Biomech, 45(5), pp. 790–798. [DOI] [PMC free article] [PubMed] [Google Scholar]
- [31].Karimi A, Navidbakhsh M, Yamada H, and Razaghi R, 2014, “A Nonlinear Finite Element Simulation of Balloon Expandable Stent for Assessment of Plaque Vulnerability Inside a Stenotic Artery,” Med. Biol. Eng. Comput, 52(7), pp. 589–599. [DOI] [PubMed] [Google Scholar]
- [32].Florenciano-Sanchez R, de la Morena-Valenzuela G, Villegas-Garcia M, Soria-Arcos F, Rubio-Paton R, Teruel-Carrillo F, Hurtado J, and Valdes-Chavarri M, 2005, “Noninvasive Assessment of Coronary Flow Velocity Reserve in Left Anterior Descending Artery Adds Diagnostic Value to Both Clinical Variables and Dobutamine Echocardiography: A Study Based on Clinical Practice,” Eur. J. Echocardiogr, 6(4), pp. 251–259. [DOI] [PubMed] [Google Scholar]
- [33].Yin W, Alemu Y, Affeld K, Jesty J, and Bluestein D, 2004, “Flow-Induced Platelet Activation in Bileaflet and Monoleaflet Mechanical Heart Valves,” Ann. Biomed. Eng, 32(8), pp. 1058–1066. [DOI] [PubMed] [Google Scholar]
- [34].Vignon-Clementel IE, Figueroa CA, Jansen KE, and Taylor CA, 2010, “Outflow Boundary Conditions for 3D Simulations of Non-Periodic Blood Flow and Pressure Fields in Deformable Arteries,” Comput. Methods Biomech. Biomed. Eng, 13(5), pp. 625–640. [DOI] [PubMed] [Google Scholar]
- [35].Watanabe N, 2017, “Noninvasive Assessment of Coronary Blood Flow by Transthoracic Doppler Echocardiography: Basic to Practical Use in the Emergency Room,” J. Echocardiogr, 15(2), pp. 49–56. [DOI] [PubMed] [Google Scholar]
- [36].van Wolferen SA, Marcus JT, Westerhof N, Spreeuwenberg MD, Marques KMJ, Bronzwaer JGF, Henkens IR, Gan CT-J, Boonstra A, Postmus PE, and Vonk-Noordegraaf A, 2008, “Right Coronary Artery Flow Impairment in Patients With Pulmonary Hypertension,” Eur. Heart J, 29(1), pp. 120–127. [DOI] [PubMed] [Google Scholar]
- [37].Javadzadegan A, Yong AS, Chang M, Ng MK, Behnia M, and Kritharides L, 2017, “Haemodynamic Assessment of Human Coronary Arteries Is Affected by Degree of Freedom of Artery Movement,” Comput. Methods Biomech. Biomed. Eng, 20(3), pp. 260–272. [DOI] [PubMed] [Google Scholar]
- [38].Dhawan SS, Avati Nanjundappa RP, Branch JR, Taylor WR, Quyyumi AA, Jo H, McDaniel MC, Suo J, Giddens D, and Samady H, 2010, “Shear Stress and Plaque Development,” Expert Rev. Cardiovasc. Ther, 8(4), pp. 545–556. [DOI] [PMC free article] [PubMed] [Google Scholar]
- [39].Eshtehardi P, McDaniel MC, Suo J, Dhawan SS, Timmins LH, Binongo JN, Golub LJ, Corban MT, Finn AV, Oshinski JN, Quyyumi AA, Giddens DP, and Samady H, 2012, “Association of Coronary Wall Shear Stress With Atherosclerotic Plaque Burden, Composition, and Distribution in Patients With Coronary Artery Disease,” J. Am. Heart Assoc, 1(4), p. e002543. [DOI] [PMC free article] [PubMed] [Google Scholar]
- [40].Hetterich H, Jaber A, Gehring M, Curta A, Bamberg F, Filipovic N, and Rieber J, 2015, “Coronary Computed Tomography Angiography Based Assessment of Endothelial Shear Stress and Its Association With Atherosclerotic Plaque Distribution in-Vivo,” PLoS One, 10(1), p. e0115408. [DOI] [PMC free article] [PubMed] [Google Scholar]
- [41].Malek AM, Alper SL, and Izumo S, 1999, “Hemodynamic Shear Stress and Its Role in Atherosclerosis,” JAMA, 282(21), pp. 2035–2042. [DOI] [PubMed] [Google Scholar]
- [42].Wang Y, Qiu J, Luo S, Xie X, Zheng Y, Zhang K, Ye Z, Liu W, Gregersen H, and Wang G, 2016, “High Shear Stress Induces Atherosclerotic Vulnerable Plaque Formation Through Angiogenesis,” Regen. Biomater, 3(4), pp. 257–267. [DOI] [PMC free article] [PubMed] [Google Scholar]
- [43].Yamamoto T, Iwasaki K, Arai J, and Umezu M, 2015, “A Study of the Proximal Left Anterior Descending Coronary Artery Motion,” J. Medical Diagnostic Methods, 4(3), p. 182. [Google Scholar]
- [44].Liang Y, Zhu H, Gehrig T, and Friedman MH, 2008, “Measurement of the Transverse Strain Tensor in the Coronary Arterial Wall From Clinical Intravascular Ultrasound Images,” J. Biomech,. 41(14), pp. 2906–2911. [DOI] [PubMed] [Google Scholar]
- [45].Valgimigli M, Rodriguez-Granillo GA, Garcia-Garcia HM, Vaina S, De Jaegere P, De Feyter P, and Serruys PW, 2007, “Plaque Composition in the Left Main Stem Mimics the Distal but Not the Proximal Tract of the Left Coronary Artery: Influence of Clinical Presentation, Length of the Left Main Trunk, Lipid Profile, and Systemic Levels of C-Reactive Protein,” J. Am. Coll. Cardiol, 49(1), pp. 23–31. [DOI] [PubMed] [Google Scholar]
- [46].Choy JS, and Kassab GS, 2009, “Wall Thickness of Coronary Vessels Varies Transmurally in the LV but Not the RV: Implications for Local Stress Distribution,” Am. J. Physiol. Heart Circ. Physiol, 297(2), pp. H750–H758. [DOI] [PMC free article] [PubMed] [Google Scholar]
- [47].Bentzon JF, Otsuka F, Virmani R, and Falk E, 2014, “Mechanisms of Plaque Formation and Rupture,” Circ. Res, 114(12), pp. 1852–1866. [DOI] [PubMed] [Google Scholar]
- [48].Joshi AK, Leask RL, Myers JG, Ojha M, Butany J, and Ethier CR, 2004, “Intimal Thickness Is Not Associated With Wall Shear Stress Patterns in the Human Right Coronary Artery,” Arterioscler. Thromb. Vasc. Biol, 24(12), pp. 2408–2413. [DOI] [PubMed] [Google Scholar]
- [49].Raut SS, Jana A, De Oliveira V, Muluk SC, and Finol EA, 2013, “The Importance of Patient-Specific Regionally Varying Wall Thickness in Abdominal Aortic Aneurysm Biomechanics,” ASME J. Biomech. Eng, 135(8), p. 81010. [DOI] [PMC free article] [PubMed] [Google Scholar]
- [50].Moon JY, Suh DC, Lee YS, Kim YW, and Lee JS, 2014, “Considerations of Blood Properties, Outlet Boundary Conditions and Energy Loss Approaches in Computational Fluid Dynamics Modeling,” Neurointervention, 9(1), pp. 1–8. [DOI] [PMC free article] [PubMed] [Google Scholar]
- [51].Prosi M, Perktold K, Ding Z, and Friedman MH, 2004, “Influence of Curvature Dynamics on Pulsatile Coronary Artery Flow in a Realistic Bifurcation Model,” J. Biomech, 37(11), pp. 1767–1775. [DOI] [PubMed] [Google Scholar]
- [52].Yang C, Bach RG, Zheng J, Naqa IE, Woodard PK, Teng Z, Billiar K, and Tang D, 2009, “In Vivo IVUS-Based 3-D Fluid-Structure Interaction Models With Cyclic Bending and Anisotropic Vessel Properties for Human Atherosclerotic Coronary Plaque Mechanical Analysis,” IEEE Trans. Biomed. Eng, 56(10), pp. 2420–2428. [DOI] [PMC free article] [PubMed] [Google Scholar]
- [53].Ziadinov E, and Al-Sabti H, 2013, “Localizing Intramyocardially Embedded Left Anterior Descending Artery During Coronary Bypass Surgery: Literature Review,” J. Cardiothorac. Surg, 8(1), p. 202. [DOI] [PMC free article] [PubMed] [Google Scholar]


