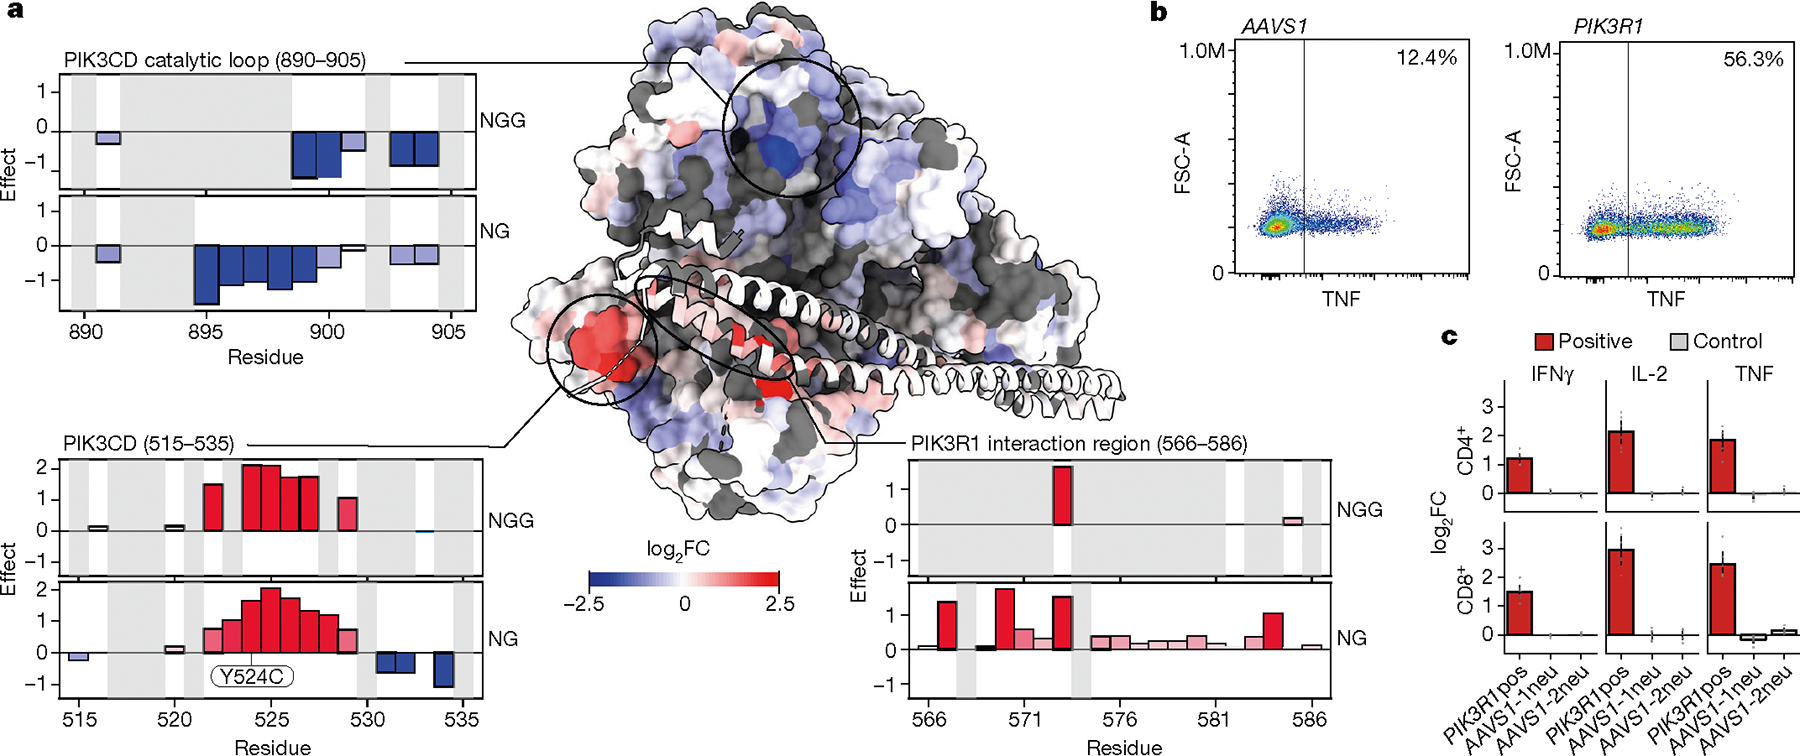
Fig. 5 |. High-resolution map of functional residues in a 3D protein complex structure.

a, Structural model of the PIK3CD–PIK3R1 complex (Protein Data Bank: 7JIS), with residues coloured by log2FC of TNF production from the NG PAM screen. The catalytic loop (residues 890–905) is marked by negative base-editing effects (top left); two other domains—the PIK3R1-interaction region (residues 566–586) (bottom right) and residues 515–535 (bottom left) are marked by positive base-editing effects. b, Flow cytometry plots of CD4+ T cells edited with ABE mRNA and synthetic sgRNA targeting PIK3R1 or AAVS1 (control). c, log2FC in cytokine production for CD4+ or CD8+ T cells edited with positive PIK3R1 sgRNA or AAVS1 controls in arrayed format. n = 6 human donors. Data are normalized to controls and show mean ± s.e.m.
