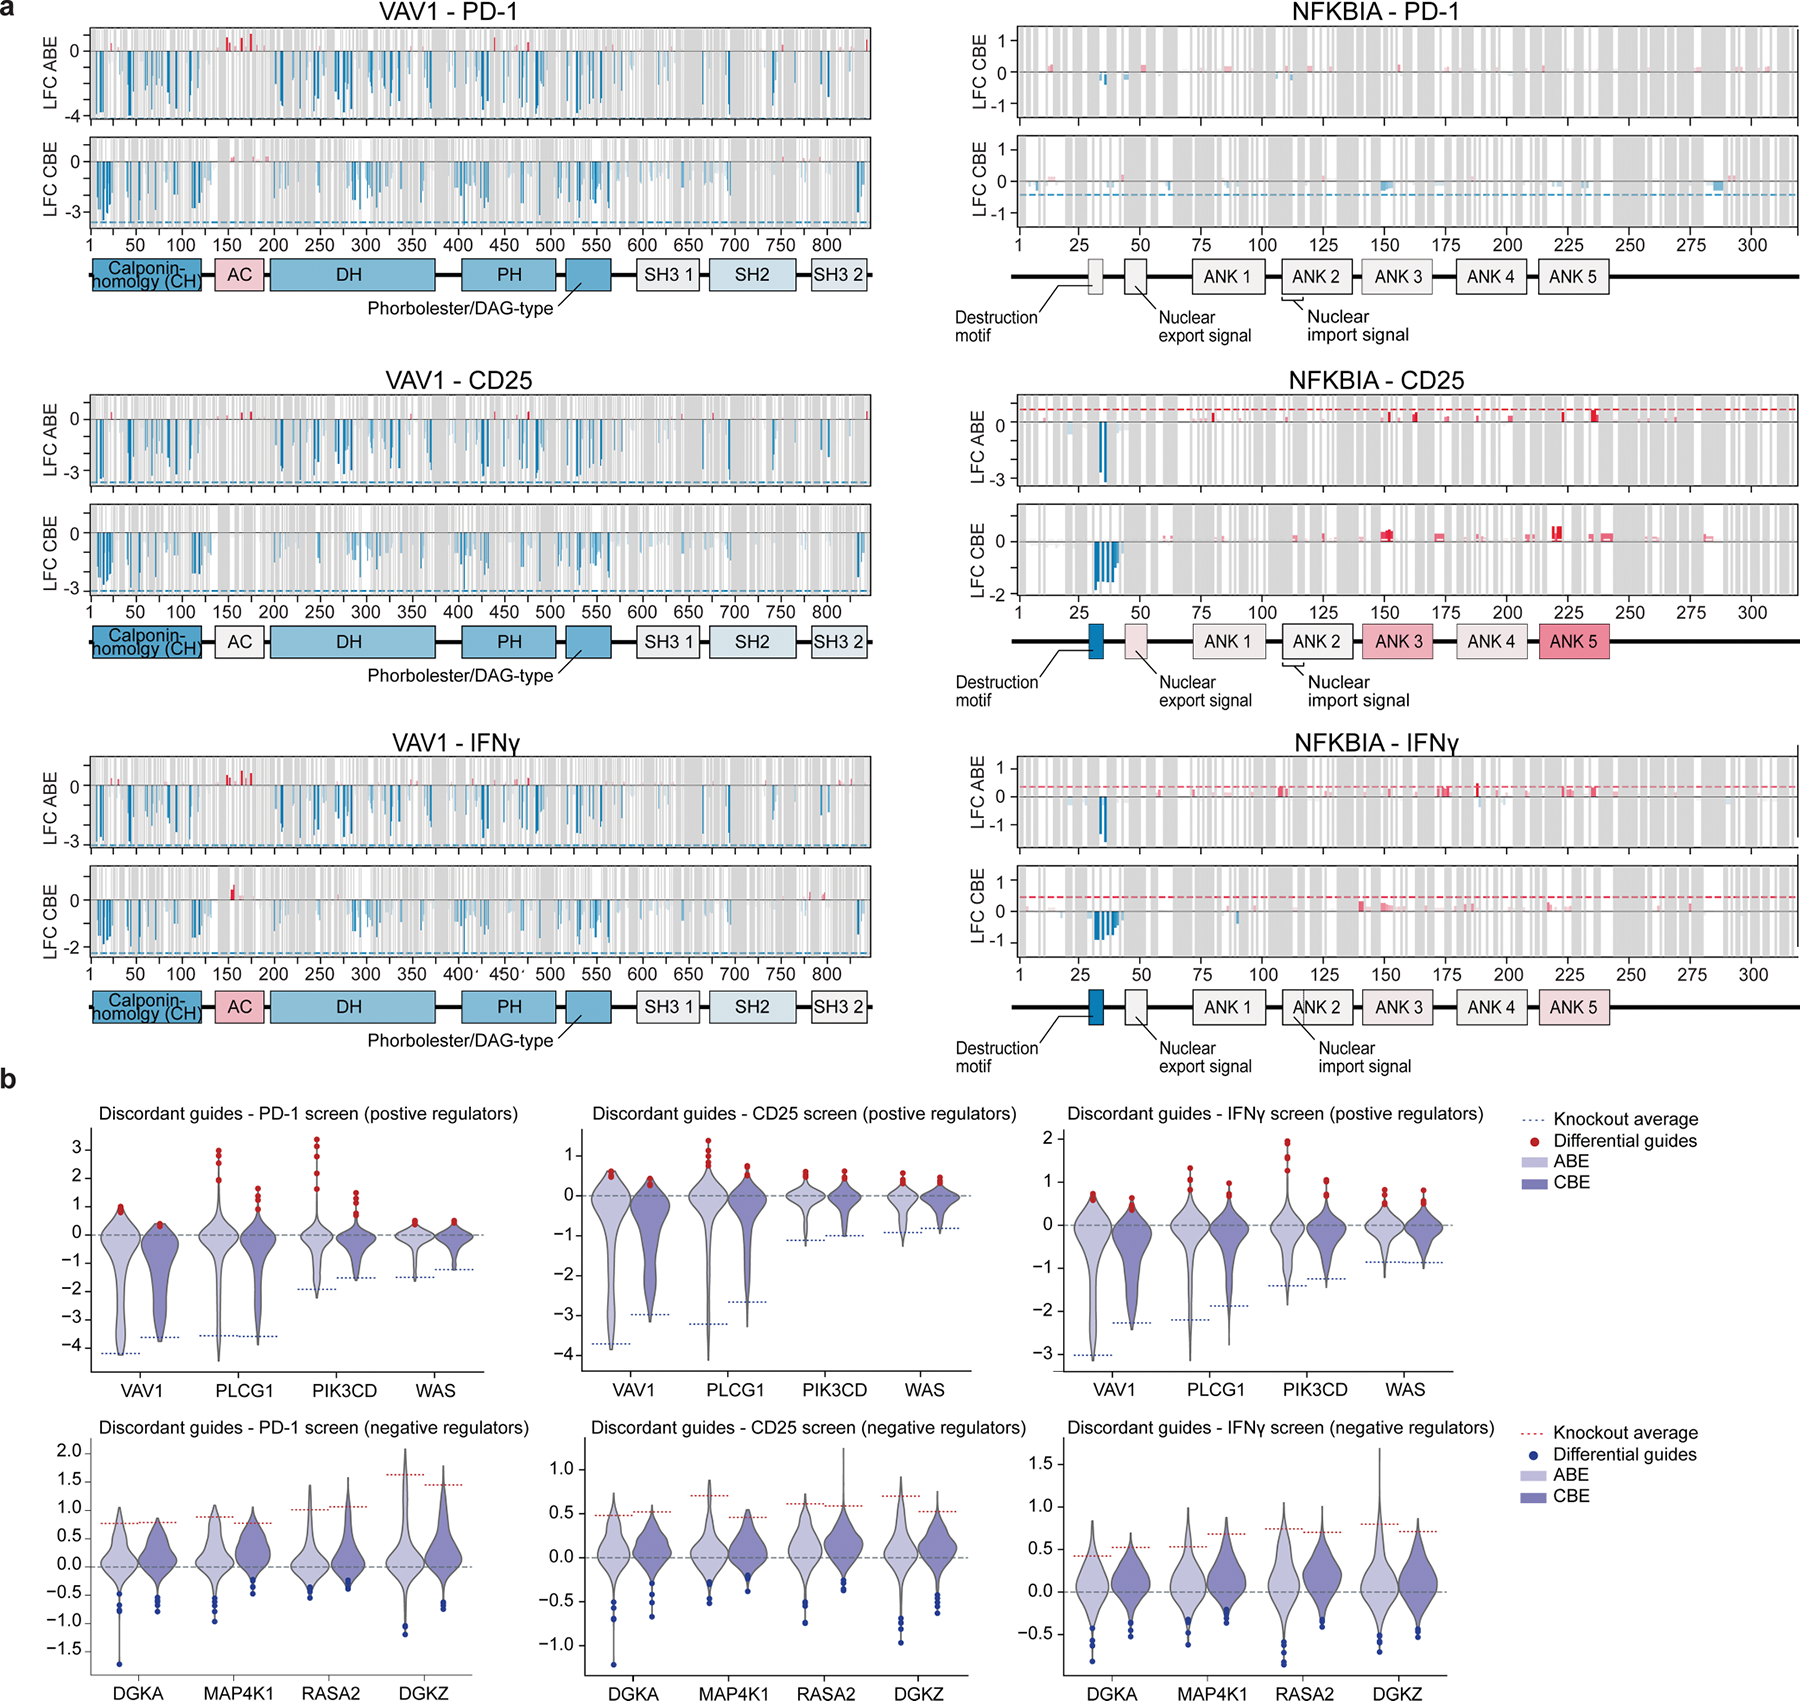
Extended Data Fig. 4 |. Tiling base edits reveal mutations with discordant effects across screens.

a, Average effects (LFC, log2-fold changes) of non-synonymous, non-terminating base edits at each residue (ABE, top; CBE, bottom) on PD-1, CD25 expression, and IFNγ production are plotted across open reading frames encoding VAV1 (left) and NFKBIA (right). The dotted line indicates the average log2-fold change of the top 3 terminating (knockout) guides in the first half of the coding sequence, with blue for negative effect and red for positive effect on TNFα levels. Annotated domains from UniProt are shown below and are colored by the average effect of guides targeting those regions. b, Violin plots show distribution of log2-fold changes of CBE (dark purple) and ABE (light purple) guides tiling positive (top) and negative (bottom) regulator genes of PD-1, CD25 expression, and IFNγ production. Dotted lines indicate the average log2-fold change of the top 3 terminating (knockout) guides in the first half of the coding sequence. Blue and red dots indicate guides with strongly opposing effects with respect to the knockout guides for the same gene.
