

Abstract
Chronic implantation of intracortical microelectrode arrays (MEAs) capable of recording from individual neurons can be used for the development of brain-machine interfaces. However, these devices show reduced recording capabilities under chronic conditions due, at least in part, to the brain’s foreign body response (FBR). This creates a need for MEAs that can minimize the FBR to possibly enable long-term recording. A potential approach to reduce the FBR is the use of MEAs with reduced cross-sectional geometries. Here, we fabricated 4-shank amorphous silicon carbide (a-SiC) MEAs and implanted them into the motor cortex of seven female Sprague-Dawley rats. Each a-SiC MEA shank was 8 μm thick by 20 μm wide and had sixteen sputtered iridium oxide film (SIROF) electrodes (4 per shank). A-SiC was chosen as the fabrication base for its high chemical stability, good electrical insulation properties, and amenability to thin film fabrication. Electrochemical analysis and neural recordings were performed weekly for 4 months. MEAs were characterized pre-implantation in buffered saline and in vivo using electrochemical impedance spectroscopy and cyclic voltammetry at 50 mV/s and 50,000 mV/s. Neural recordings were analyzed for single unit activity. At the end of the study, animals were sacrificed for immunohistochemical analysis. We observed statistically significant, but small, increases in 1 and 30 kHz impedance values and 50,000 mV/s charge storage capacity over the 16-week implantation period. Slow sweep 50 mV/s CV and 1 Hz impedance did not significantly change over time. Impedance values increased from 11.6 MΩ to 13.5 MΩ at 1 Hz, 1.2 MΩ to 2.9 MΩ at 1 kHz, and 0.11 MΩ to 0.13 MΩ at 30 kHz over 16 weeks. The median charge storage capacity of the implanted electrodes at 50 mV/s was 58.1 mC/cm2 on week 1 and 55.9 mC/cm2 on week 16, and at 50,000 mV/s, 4.27 mC/cm2 on week 1 and 5.93 mC/cm2 on week 16. Devices were able to record neural activity from 92% of all active channels at the beginning of the study, At the study endpoint, a-SiC devices were still recording single-unit activity on 51% of electrochemically active electrode channels. In addition, we observed that the signal-to-noise ratio experienced a small decline of −0.19 per week. We also classified observed units as fast and slow repolarizing based on the trough-to-peak time. Although the overall presence of single units declined, fast and slow repolarizing units declined at a similar rate. At recording electrode depth, immunohistochemistry showed minimal tissue response to the a-SiC devices, as indicated by statistically insignificant differences in activated glial cell response between implanted brains slices and contralateral sham slices at 150 μm away from the implant location, as evidenced by GFAP staining. NeuN staining revealed the presence of neuronal cell bodies close to the implantation site, again statistically not different from a contralateral sham slice. These results warrant further investigation of a-SiC MEAs for future long-term implantation neural recording studies.
Introduction
Microelectrode arrays (MEAs) are critical components of neural interfaces that provide an electrical connection between devices such as vision or motor prostheses and neurons, and provide insight into the functional circuitry comprising the complex neuronal networks found within the brain [1]–[6]. Two commonly used cortical MEA devices, the Utah array and Michigan probe, are fabricated using a rigid silicon-based platform [7], [8]. Although these devices have shown the ability to record or stimulate large numbers of neurons in several animal models, and there has been success in human implantation [9], [10], consistent chronic robustness remains a challenge [11]–[14]. This may be due to many factors including insulating material degradation, electrode site delamination, and physical breakage of the devices [14], [15]. However, the reactive tissue foreign body response (FBR) that arises after the invasive probes have been implanted into the cortex remains a major concern [16]–[18]. FBR is critical to minimize, as extracellular action potential amplitudes observed at recording sites on penetrating electrode arrays are reduced by tissue encapsulation [19]. Prior work has demonstrated that the FBR can encapsulate arrays in fibrous tissue when implanted in rat motor cortex after a 32-week study [20]. Additionally, as the devices are implanted into the cortex, they rupture blood vessels and may damage neurons and oligodendrocyte support cells [21], [22]. The FBR can be observed to begin within minutes of implantation and prevents the recovery of damaged tissue [21]. As the response continues, the device is encapsulated in a fibrous tissue that damages or appears to push viable neurons away from the implanted electrodes, reducing the ability for neural recording [23]–[25]. One approach to mitigating this response is to make the cross-sectional dimensions of the penetrating structures, typically the shanks of the MEAs, smaller to minimize trauma associated with surgical implantation, while maintaining the stiffness necessary to penetrate the pial surface and insert into the brain parenchyma without external mechanical support. Structures consisting of features with small cross-sectional dimensions have been shown to promote reduced FBR [26], [27]. Neuronal cell bodies, confirmed by immunohistochemistry four weeks after implantation, were also observed adjacent to the 20 μm2 structures [26]. Sub-cellular scale carbon fiber microwires have also been shown to have reduced tissue response when examining implantation sites after 12 weeks in vivo [28]. Intrinsically stiff, but highly flexible carbon fiber electrodes with cross-sectional areas of 60 μm2 were shown to reduce gliosis when compared to commercially available electrode arrays [29]. Additionally, flexible electrode arrays with cross-sectional areas of 50 μm2 and 10 μm2 implanted into cortex using a temporary mechanical shuttle showed excellent recording capabilities in a chronic preparation [30].
In the present study, we investigated amorphous silicon carbide (a-SiC) as both the insulating material and the fabrication base of a microelectrode array. A-SiC was chosen due to its relative chemical inertness, good electrical insulating characteristics, and comparatively high stiffness, sufficient to allow designs of cortical penetrating shanks even with low cross-sectional geometries [31]–[34]. Previous work has demonstrated the low dissolution rate of a-SiC in a saline soak test at 87°C for a period of 340 days [35]. A-SiC has been used in stents for patients with acute coronary syndrome [36]. Prior work has also demonstrated the ability of a-SiC arrays to be implanted into rat cortex without an insertion guide, a supporting coating such as polyethylene glycol, or an implant shuttle [33]. Bundled multi-shank a-SiC devices with individual cross-sectional areas of 60 μm2 were found to have well resolved single unit neural recordings in Zebra Finch cortex [37].
For MEA applications, electrode impedance must be low enough to allow neural recording and charge-injection capacity high enough to allow neural stimulation. Sputtered iridium oxide coated a-SiC MEAs have been shown to record neuronal action potentials (single units) from the cortex in a sub-chronic setting [37] and to record stable local field potentials for 16 weeks following implantation [38]. In this study, we assessed the ability of these MEAs to record single units for 16 weeks following implantation. Recording performance was assessed by identifying the presence of single units in neural recordings and calculating parameters such as the signal-to-noise ratio of recordings [39]. We also assessed the prevalence of fast and slow repolarizing units based on their trough-to-peak times, which suggest the presence of inhibitory and excitatory neurons respectively [40].
The FBR in brain tissue implanted with MEAs is typically quantified using endpoint immunohistochemical (IHC) characterization. The biomarkers used often include, but are not limited to, glial fibrillary acid protein (GFAP) to mark the emergence of activated astrocytic glial cells and neuronal nuclei antigen (NeuN) to identify neuronal cell bodies. Immune responses in brain tissue have been found to be directly proportional to the cross-sectional surface area of the penetrating shanks of implanted MEAs [41]–[43]. We hypothesized that the use of a-SiC microelectrode arrays could minimize the immune response in a chronic study and may be associated with a relative stability in the recording capability of extracellular action potentials. In this study, we evaluated the electrochemical properties and extracellular action potential recording performance of a-SiC devices implanted in rat motor cortex over 16 weeks. We also measured the mean fluorescence intensity and cell densities derived from GFAP and NeuN images, respectively, from rat brain tissues implanted with a-SiC MEAs and compared these with cortical tissue samples from contralateral sides.
Materials and Methods
Microelectrodes
Amorphous silicon carbide (a-SiC) probes were fabricated at The University of Texas at Dallas using standard semiconductor fabrication techniques. For the first step of fabrication, prime grade 100 mm diameter, 525 μm thick Si wafers (Silicon Valley Microelectronics, Inc., USA) were coated with a 1 μm layer of polyimide PI2610 (HD Microsystems, USA). This layer serves as a release layer that, when hydrated in deionized water after fabrication, releases the completed devices from the Si wafer. The PI was cured at 350 °C for one hour under nitrogen gas at atmospheric pressure. Next, 6 μm of a-SiC was deposited using plasma enhanced chemical vapor deposition (PECVD). The PECVD deposition conditions were substrate temperature of 350 °C, pressure of 1000 mtorr, and 270 W RF power, with 164 sccm Ar, 36 sccm CH4, and 600 sccm 2% SiH4 serving as the reactive gasses in the plasma. A trilayer Ti/Au/Ti (30/150/30 nm) metal interconnect layer from the bond pad region and the electrode sites was patterned using lift-off photolithography following deposition by electron beam evaporation (CHA Industries, USA). Metallization layers were patterned to be 2 μm wide with 2 μm spaces between traces along the shanks of the devices. Once the metallization layer was completed, a final 2 μm layer of a-SiC was deposited over the metallization and first layer of a-SiC to complete the stack. Stress of the deposited films was measured using a monitor wafer. The completed stack was then annealed at 400 °C until the measured stress of the monitor wafer was in a range that produces straight a-SiC devices, as demonstrated in Deku et al. [37]. Next, 2×5 μm2 vias were opened in the top a-SiC layer by inductively coupled plasma (ICP) reactive ion etching (RIE) (PlasmaTherm, USA) to expose the underlying metallization at the electrode sites. ICP RIE was performed with 25 sccm SF6 and 5 sccm O2 as reactive gases. In the same step, 200×100 μm2 openings for the bond pad region were created at the distal bond pad sites. Sputtered iridium oxide film (SIROF) was used on the electrode sites to reduce electrode impedance and increase charge injection capacity. SIROF was deposited using DC magnetron sputtering as described by Maeng et al. [44]. The SIROF electrodes were circular with a geometric surface area (GSA) of 200 μm2 and thickness of 250 nm. A 30 nm sputtered Ti adhesion layer was deposited prior to the SIROF. Finally, fabrication of devices was completed by singulation of the outline of the devices from the stack using ICP RIE as described above. The final a-SiC shank width was 20 μm and shank thickness 8 μm. Once thin film fabrication was complete, the wafers were soaked in 87 °C deionized water for approximately 24 hours to hydrate the base polyimide layer to release completed devices from the silicon wafer. The devices were bonded to connectors (Omnetics Connector Corporation, USA) and 30G stainless-steel reference and ground wires were both attached using H20E conductive silver epoxy (Epoxy Technology, Inc., USA). The conductive silver epoxy was applied to the bond pad area via stencil. Connector leads were then placed onto the bond pads in contact with the silver epoxy and cured at 87°C. Lastly, the bond pad area was coated in a medical epoxy (EA M-121HP, Henkel Loctite, Germany) to encapsulate the bond pads and connector. Cross-sectional diagrams of the device are shown in figure 1A. Optical and scanning electron microscope images of the completed device and a recording electrode site are shown in figures 1B–E.
Figure 1 –
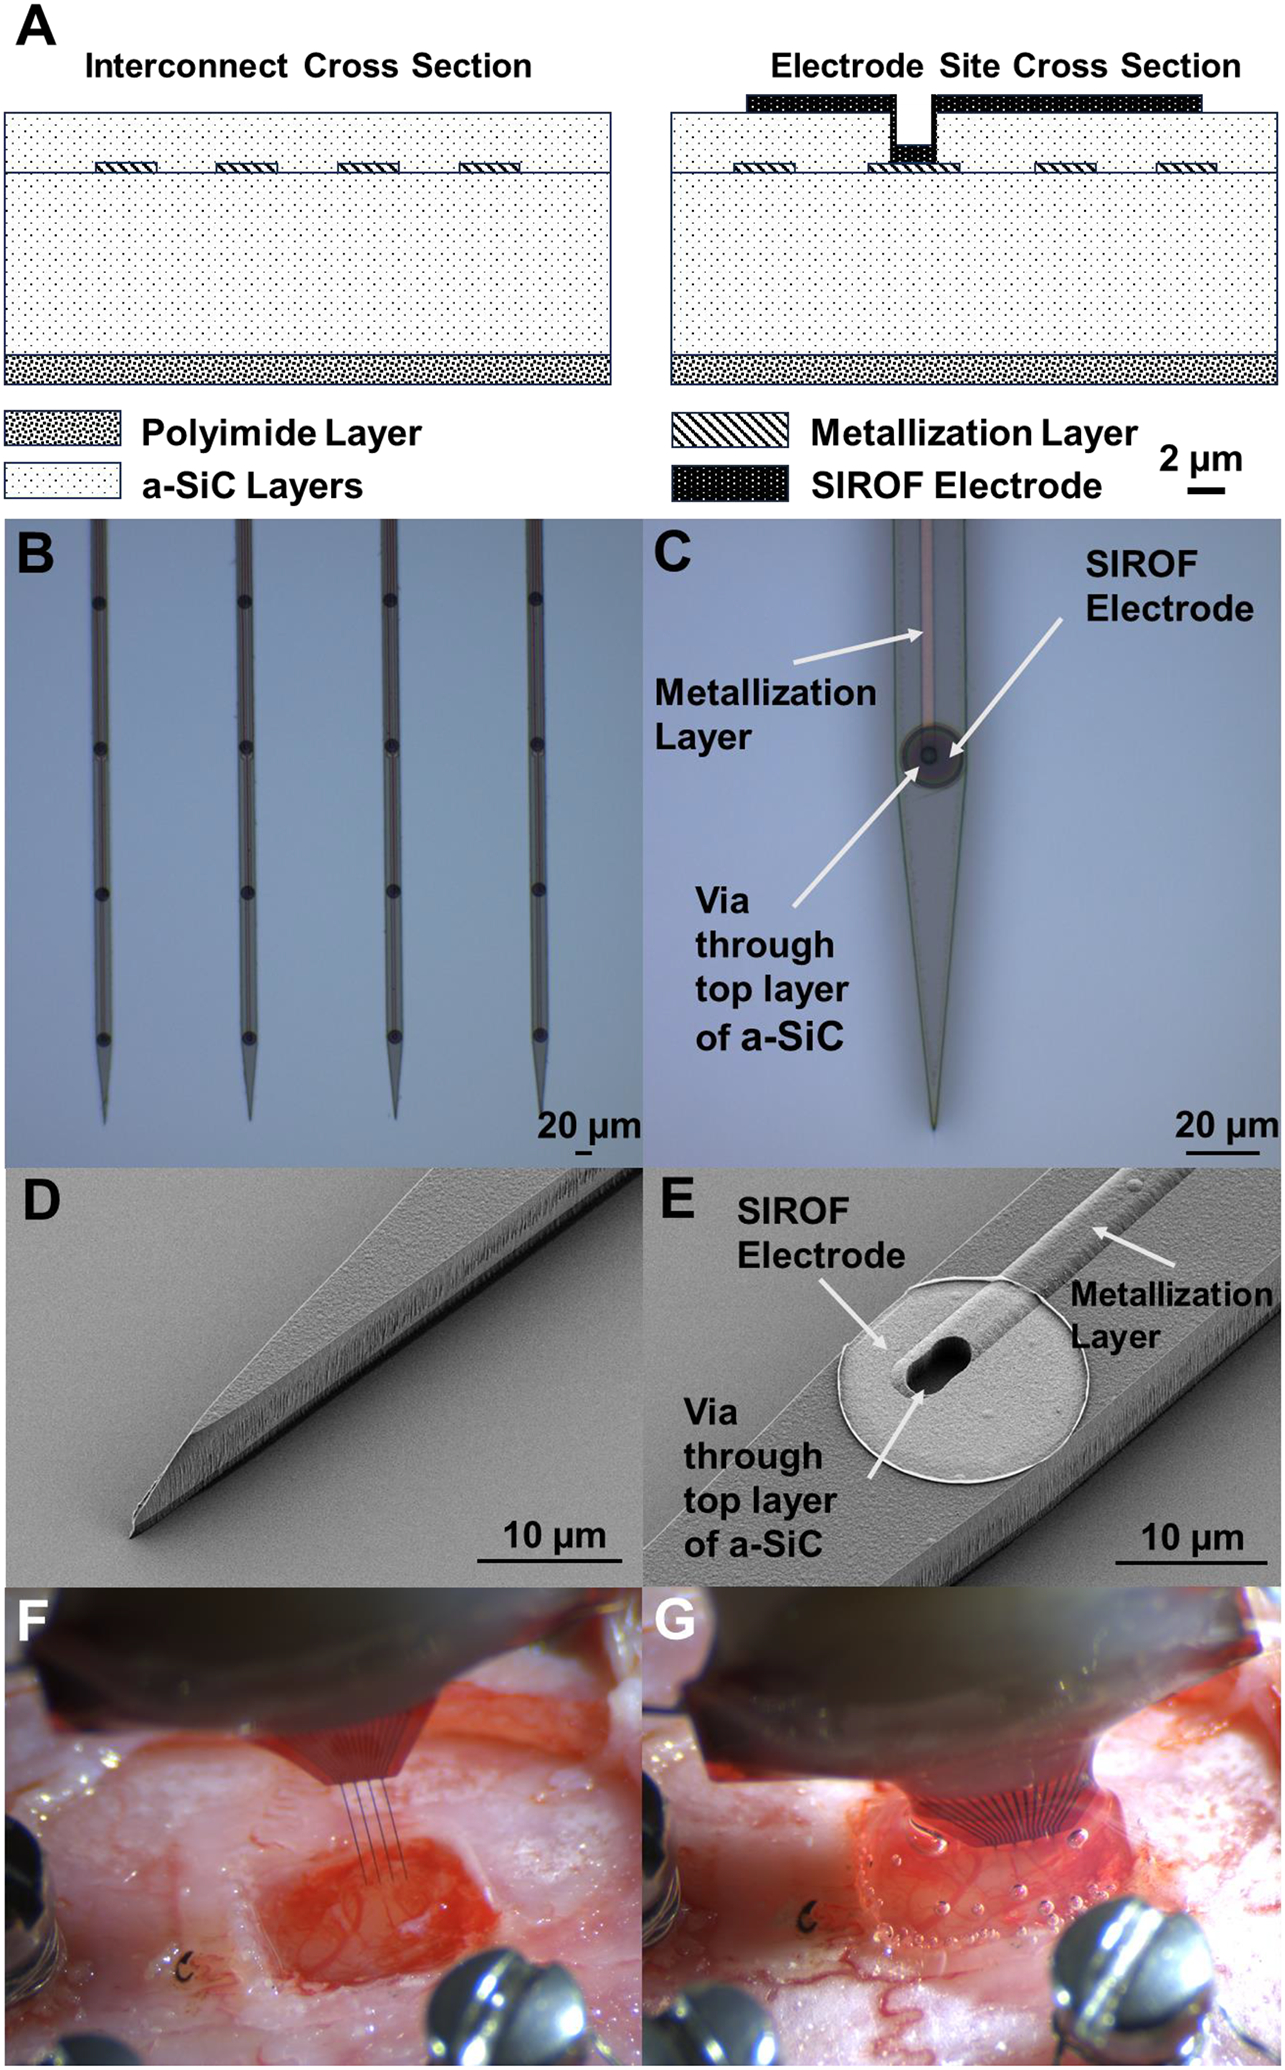
(A) Cross-sectional diagram of an a-SiC device. The metal traces that lead along the shank are pictured on the left diagram and the recording electrode site is shown in the right diagram. Diagram is drawn to scale. (B) Optical image of four a-SiC penetrating shanks and (C) detailed image of a single electrode site. The interconnect metallization can be seen in C. Scanning electron microscopy (SEM) images s) of the penetrating tip (D) and a recording electrode site (E) are also shown. The SIROF film (bright disk) is connected to the underlying metal trace by a via etched through the top layer of a-SiC. Note that there is an observable 1 μm thick polyimide layer below the a-SiC stack. Before (F) and after (G) implantation of an a-SiC electrode array into rat motor cortex. The size of the craniotomy shown is approximately 2×2 mm. In G, a topical adhesive has been added to close the craniotomy.
These devices had four 2 mm long shanks with four 200 μm2 recording sites per shank, for a total of 16 channels per device. Shanks were spaced, colinearly, 200 μm apart, and electrode sites were located at 100, 300, 500, and 700 μm from the distal tip of each shank. Each shank was patterned with a penetrating tip with an included angle of 11 degrees.
Surgical Implantation
All procedures were approved by The University of Texas at Dallas Institutional Animal Care and Use Committee (protocol #18–13). Adult female Sprague Dawley rats were used in the study. Initial anesthesia was induced using 2–3% isoflurane in oxygen followed by an intraperitoneal injection of a ketamine (65 mg/ml), xylazine (13.3 mg/ml), acepromazine (1.5 mg/ml) cocktail. A surgical plane of anesthesia was confirmed with tail and toe pinches. The animals were then transferred to a stereotactic frame and anesthesia was maintained with 2% isoflurane in oxygen. A warming pad (Kent Scientific Corporation, Torrington, CT, USA) was placed under the rat and kept at 37 °C. A midline incision was made on the scalp and tissue resected to expose the skull. Stainless-steel bone screws were drilled (Stoeltin Co., Wood Dale, IL, USA) adjacent to the site of implantation, and a ~2×2 mm craniotomy and durotomy was performed over the left motor cortex (M1) (2 mm anterior from bregma and 2 mm lateral from the midline). Ground and reference wires were wrapped around the bone screws, and devices were implanted with a NeuralGlider Cortical Neural Implant Inserter (Actuated Medical, Inc., USA), which supplied axial vibration in the direction of insertion to aid penetration into the brain [45]. Arrays were inserted at a speed of 100 μm/s to a depth of ~1.5 mm with vibrational power of 0.5 W. Fig 1F shows the a-SiC device prior to implantation through the craniotomy and Fig 1G shows the same array immediately following insertion. After implantation, a collagen-based dural graft was used to replace the resected dura, and silicone elastomer adhesive (Kwik-Sil, World Precision Instruments, Sarasota, FL, USA) was applied over the craniotomy. Finally, dental cement was used to form a headcap that encapsulated the device, bone screws, and exposed skull, while leaving the connector accessible. Implanted animals were individually housed and maintained for 16 weeks on a 12-hour light-dark schedule.
Electrochemical Evaluation
We quantified the electrochemical stability of the implanted electrodes using electrochemical impedance spectroscopy (EIS) and cyclic voltammetry (CV) prior to implantation and throughout the 16 weeks of implantation. EIS measurements were made over a 1–105 Hz frequency range using a 10 mV RMS sinusoidal voltage signal about the equilibrium potential of the electrode. Measurements were made at 10 data points per decade of frequency vs a Ag|AgCl reference electrode. In this study, we report the impedance magnitude at three frequencies, 1 Hz, 1 kHz, and 30 kHz. These frequencies were chosen to identify EIS regions of interest associated with local field potential recording, single unit action potential recording, and the tissue impedance, respectively [46], [47]. CV measurements involved sweeping the electrode potential from +0.8 V to −0.6 V versus Ag|AgCl at sweep rates of 50 mV/s and 50,000 mV/s to monitor electrode functionality and faradaic reactions occurring at the electrode site [47], [48]. The 50 mV/s sweep was chosen to measure the oxidation reduction reactions of the SIROF film and monitor any development of slow-time-constant leakage pathways in the insulating a-SiC [48]. The 50,000 mV/s sweep rate was chosen to monitor the surface reactions at the SIROF electrode coatings [48]. Polarizing the SIROF to potentials outside the +0.8 V to −0.6 V range may result in electrolysis of water, which may damage the electrode site or adjacent tissue [48]. The cathodal current over a single CV cycle was integrated over time to give the cathodal charge storage capacity (CSCc). Both saline and in vivo EIS and CVs were performed using a Gamry Reference 600 potentiostat (Gamry Instruments Inc, Warminster, PA, USA). All electrochemical measurements were performed in a 3-electrode configuration with each electrode site as a working electrode, a large Pt wire counter electrode, and Ag|AgCl reference electrode.
Prior to implantation, CV and EIS measurements of each electrode were obtained in an inorganic model of interstitial fluid (mISF) saturated with CO2/O2/N2 mixed gas (5/6/89% respectively). The mISF measurements allowed for the verification of the functionality of each electrode channel and provided baseline electrochemical properties of the devices prior to implantation. For in vivo CV and EIS measurements, Pt counter and Ag|AgCl reference electrodes were taped to the rat’s tail and covered in a phosphate buffered saline soaked gauze to ensure electrical connection to the animal. In vivo electrochemical measurements began at 7–13 days post-implantation, and then weekly up to 16 weeks.
Establishing the availability of functional electrodes was a key component in determining active electrode yield, which we defined as the percentage of available electrode sites showing at least one discernable single unit. Electrode site connectivity was assessed from the CSCc determined at slow and fast sweep rates. If the CSCc for the 50 mV/s sweep CV for a given channel was below 1 mC/cm2 and the 50,000 mV/s sweep CSCc was below 0.1 mC/cm2 the channel was presumed disconnected. The CVs with these low CSCc values were characterized by a lack of observable oxidation-reduction peaks associated with the SIROF. These channels were included in the data analysis for the weeks in which a characteristic in vivo SIROF CV was observed but excluded following a clear change in the CSCc. In some cases, a channel was observed to be “disconnected” for one week and connected for subsequent weeks. In this circumstance, the data for the week of observed electrochemical disconnects were not included for electrochemistry analysis, but these channels were considered connected when calculating active electrode yield for neural recording. We hypothesize that disconnection and reconnection of channels is a consequence of occasional poor contact at the connector on the animal’s head.
Neural Recordings
On the day of surgery, and each week thereafter with the rats anesthetized with 2–3% isoflurane, wideband (0.1–7000 Hz) neural recordings were collected for 600 s at a 40 kHz sampling frequency using a Plexon acquisition system (Omniplex, Plexon, Inc., USA). To discriminate single units, data were bandpass filtered using a 300 Hz to 3000 Hz Butterworth filter. Common median referencing was used to reduce the level of noise and the effect of artifacts [49]. Next, a −4σ (standard deviation) threshold of the filtered signal was used to extract waveforms that could be extracellular action potentials. Single units were then automatically identified using a k-means scan and manually verified based on separation in principal component space. Signal-to-noise ratio (SNR) was calculated by dividing the peak-to-peak voltage (Vpp) of the discriminated single units by the noise. The noise value was determined by removing any portion of the filtered continuous signal that was associated with a single unit, then calculated as the RMS of the remaining signal. Active electrode yield (AEY) for a recording session was calculated as the percentage of available channels that recorded at least one single unit in that session. The spike rate was calculated as the inverse of the median time between spikes associated with a given single unit.
Finally, the trough-to-peak time of each identified single unit was measured. Then, units were further classified as fast-repolarizing if the spike width was less than 0.4 ms, and as slow-repolarizing otherwise, based on previously reported literature [40], [50]. This threshold was further validated in this study by analyzing the histogram distribution of spike widths and using the MATLAB otsuthresh function in, which determines a threshold that can be used to separate a bimodal histogram into two groups (Mathworks, Natick, MA, USA). The proportion of slow repolarizing units with respect to fast repolarizing units was calculated as the percentage of all single units with a trough-to-peak time greater than 0.4 ms. Electrode channels that were identified as non-functioning based on electrochemistry as described above were excluded from the analysis of recording performance. Single units based on less than 100 waveforms in a 10-minute recording were also excluded from analysis.
Immunohistochemistry
Immunohistochemical analysis of rat brain tissues implanted with the a-SiC MEAs was performed as described previously [51], [52]. Briefly, at 16 weeks, rats were euthanized by intraperitoneal injection of sodium pentobarbital (Virbac Corporation, Westlake, TX, USA) and transcardially perfused with 350 mL of 1x PBS followed by 300 mL of 4% paraformaldehyde (PFA) (Sigma-Aldrich, Saint Louis, MO, USA). Rat skulls were then submerged in 4% PFA for 48 hours prior to the extraction of the a-SiC devices. Next, the brains were extracted and stored in 1× PBS with 0.1% sodium azide. After 24 hours, the brains were marked with a 20-gauge needle (BD Company, Franklin Lakes, NJ, USA) approximately 3 mm from the presumptive implant site. Tissue sections were then trimmed to a ~ 6 mm x 6 mm region centered about the implant site and the tissue block was embedded in a 4% agarose gel (Sigma-Aldrich, Saint Louis, MO, USA). This tissue-gel block was glued onto the slicing platform of a vibratome (VT 1000S, Leica vibratome, Wetzlar, Germany) and sliced in 100 μm thick sections. Slices were then maintained in PBS with 0.1% (w/v) sodium azide (Sigma-Aldrich, St. Louis, MO, USA) at 4°C until staining was performed. Slices were grouped by depth from the cortical surface: superficial (100–800 μm), and deep (800–1200 μm).
For staining, slices were blocked with 4% (v/v) normal goat serum (Abcam Inc., Cambridge, UK) and permeabilized using 0.3% (v/v) Triton X-100 in 1x PBS with 0.1% sodium azide (Sigma-Aldrich, St. Louis, MO, USA) for an hour. The slices were then incubated overnight at 4°C with primary antibody solutions (supplemented with 3% (v/v) Triton X-100 in 1× PBS) to target astrocytes (GFAP) and neuronal nuclei (NeuN) (Abcam Inc., Cambridge, UK) (Table 1). GFAP staining relied on a 1:500 dilution of the primary antibody. The secondary antibody, goat anti-chicken IgY (Alexa Fluor 647), was prepared at a 1:4000 dilution. NeuN staining also relied on a 1:500 dilution of the primary antibody and a 1:4000 dilution of the secondary antibody, in this case goat anti-rabbit IgG (Alexa Flour 555) (Abcam Inc, USA). After 24 hours, the brain slices were washed thoroughly with 1x PBS, treated with Image-iT fixation/permeabilization kit (Thermo Fisher Scientific), and incubated with a blocking buffer of normal goat serum containing secondary antibodies for 4 hours. The slices were then mounted onto glass slides with Fluoromount aqueous mounting medium (Sigma-Aldrich, St. Louis, MO, USA). Stained slices were imaged using confocal microscope (Model AIR, Nikon Instruments, USA). A maximum intensity projection image was obtained with 5μm Z-steps over a total range of 35 μm using Nikon NIS elements software (Nikon Instruments, USA). Hardware/software settings were conserved across image acquisition. The objective was set to 10x, and images were obtained over a 1300 × 1300 μm viewing window.
Table I -.
Impedance medians and interquartile range (IQR) at different time points at 1 Hz, 1 kHz, and 30 kHz. Lower and Upper IQR ranges are listed in parentheses.
| Impedance (MΩ) | 1 Hz | 1 kHz | 30 kHz |
|---|---|---|---|
| mISF | 10.8 (7.2, 19.1) | 0.23 (0.14, 0.42) | 0.049 (0.032, 0.104) |
| Week 1 | 11.6 (8.2, 20.2) | 1.2 (0.71, 1.6) | 0.11 (0.10, 0.13) |
| Week 16 | 13.5 (9.99, 46.1) | 2.9 (0.74, 3.55) | 0.13 (0.12, 0.15) |
The GFAP intensity of an image was calculated using custom MATLAB code. Briefly, 100 × 50 μm regions-of-interest (ROIs) were created on opposite sides of holes identified as probe locations, with the 100 μm length of the ROI oriented in parallel with respect to the colinear shank orientation. We considered the edge of the identified hole as the 0 μm point for analysis purposes. The intensity within these rectangular regions was then calculated. Each of the regions were then shifted 50 μm away from the previous location, perpendicular to the shank orientation. This extended up to 500 μm away from the holes and was repeated for each hole location. Data were normalized to the intensity measured in the rectangular region at 450–500 μm away from each hole. Next, the GFAP intensity of all the slices for a given distance from the marked implant site within the superficial region (100–800 μm from the surface) and deep region (800–1200 μm from the surface) were averaged for further statistical analysis. To identify neuronal cell bodies in proximity to the implant site, cells with a response to NeuN staining were counted manually in similar 100 × 50 μm rectangular regions. Cell totals for each region were summed up and again normalized to the region at 450–500 μm away from each hole. In total, seven a-SiC implanted brains were processed, with the superficial region consisting of 18 slices and the deep region consisting of 8 slices. In total, 5 sham brains were processed, consisting of 13 slices for the superficial and 10 slices for the deep layers.
There are instances where implantation holes could not be readily identified, especially at depth. These slices were included in the analysis, but the hole location was estimated through corresponding slices from superficial layers. An example of the determination of shank location for a brain with clear and difficult implantation location assessments at depth can be observed in the supplemental figures. Briefly, we examined the large 5000 μm x 5000 μm area of a slice taken from 200 μm below the pial surface to estimate probe location. We identified implantation holes using a bright field image based on the large field image. We then examined the area immediately surrounding the implantation region for easily identifiable objects, such as presumptive blood vessels, that change location minimally with increasing depth. For corresponding deeper slices, we again identified implant location via bright field image. For cases where there was no apparent implantation location, we located features marked in shallower slices and examined the area near that feature for evidence of implant location. If no clear evidence of implantation was observed, we used an assumed region of device location based on shallower slices for implant location for GFAP intensity and NeuN cell count calculations. Since a-SiC probes are flexible it is possible that they deflect on implantation. However, we have observed during bending that these probes have a radius of curvature of approximately 1 mm for the metal traces to remain electrically intact and that devices were largely electrochemically active. Therefore, we would expect all electrochemically active shanks to be in the 5000 μm x 5000 μm viewing area even if histological markers of shank presence were not apparent.
Following the acquisition of brain slice images, we observed an edge effect in fluorescence intensity distribution, with higher intensity in the center of the images. This variation in fluorescence intensity was determined to be primarily due to an imaging artifact rather than a true representation of higher fluorescence intensity in the central regions. We confirmed this observation in two ways: First, the edge effect appeared across all the acquired images. Second, moving the microscope stage and centering the regions near the previously scanned region on the same slice showed the same edge effect. We hypothesize that this edge effect is due to tissue slice thickness. To address this issue, we performed a gradient adjustment by calculating the linear regression for each of the sham images and subtracted it from the original data. Then, we applied the same subtraction to the contralateral images with a-SiC implants to adjust for the observed gradient. To have an accurate analysis of GFAP activation, we corrected the slope and applied the same correction to the contralateral side with a-SiC implants to maintain consistency in our analysis. We confirmed that the gradient adjustment did not alter the ability to detect differences in GFAP intensity close to the implant site. Although the edge effect was observed on both NeuN, and GFAP images, this adjustment was only applied to GFAP images as its analysis was based on intensity, whereas NeuN analysis was based on single cell counting.
Statistical Analysis
Normality of data sets was tested with the Shapiro-Wilk’s normality test and verified using QQ plots. All electrochemical data sets were non-normal (Shapiro-Wilk, p < 0.05), with a skewness toward larger values for both impedance and CSCc values. Consequently, electrochemical data are reported as: median, quartile, and min-max range. To analyze differences in mISF and in vivo impedance and CSCc following implantation, we performed a Mann-Whitney U Test. To assess electrode characteristics over the time-course of implantation, we performed a robust linear regression on the in vivo time series data (Stata 18, College Station, TX, USA) and report the deviation from zero of the resulting slopes of the linear fit. Neural recording data were also non-parametric (Shapiro-Wilk, p < 0.05). Recording data are also presented as median, quartile and range with changes over the 16-week study period assessed by a robust linear regression. Day of surgery recording data were excluded from the linear regression due to possible noise artifacts arising from the surgical suite as well as a difference in anesthesia between implant surgery and subsequent recording sessions. Immunohistochemical data were normally distributed (Shapiro-Wilk, p > 0.05). We report the mean and standard error for each of the IHC measurements. To understand the effect of distance from the implantation site on the two IHC metrics, we performed a two-way ANOVA between a-SiC implanted slices and sham slices for shallow and electrode recording depth for GFAP and NeuN expression. If significant differences were observed for a stain and depth combination, a post-hoc multiple comparisons test was performed to determine the distance away from the implant site where the a-SiC slices were no longer statistically different from the sham slices. A correction for multiple comparisons by controlling the False Discovery Rate was done using the method of Bejnamini, Kreiger, and Yekutieli [53].
Results
Electrochemistry
EIS measurements of implanted MEAs demonstrated marked consistency over the chronic implantation period. A representative example of the changes in impedance modulus from one electrode site prior to implantation (mISF) and then at 1 week, 6 weeks, 12 weeks, and 16 weeks post-implantation is shown in Figure 2A. For all animals, trendlines of median, quartiles, and ranges for impedance magnitudes at frequencies of 1 Hz, 1 kHz, and 30 kHz are shown in Figures 2B, 2C, and 2D, respectively. Pre-implantation median mISF impedance is plotted and shown as a grey box and whisker plot. The median impedance in mISF was 10.8 MΩ (7.2 MΩ, 19.1 MΩ) (1st quartile, 3rd quartile) at 1 Hz, 0.23 MΩ (0.14 MΩ, 0.42 MΩ) at 1 kHz, and 0.049 MΩ (0.032 MΩ, 0.104 MΩ) at 30 kHz. Post-implantation, the median 1 Hz impedance of 11.6 MΩ (8.2 MΩ, 20.2 MΩ) was essentially unchanged from the pre-implantation level in mISF and did not show a significant difference between mISF and cortex (p = 0.556, Mann-Whitney U Test). Median 1 kHz and 30 kHz impedance showed a significant increase in impedance between mISF and week 1 of implantation. This increase in impedance is expected due to the higher impedance of the tissue compared with mISF [54]. The week 1 median impedance at 1 kHz was 1.2 MΩ (0.71 MΩ, 1.6 MΩ) and was significantly different (p < .0001, Mann-Whitney U Test) from mISF. Likewise, the week 1 median 30 kHz impedance was 0.11 MΩ (0.10 MΩ, 0.13 MΩ) and significantly different from mISF (p < .0001, Mann-Whitney U Test). In vivo, median 1 Hz impedance increased moderately over 16 weeks to 13.5 MΩ (9.99 MΩ, 46.1 MΩ). The median impedance at 1 kHz increased to 2.9 MΩ (0.74 MΩ, 3.55 MΩ) and median 30 kHz impedance increased to 0.13 MΩ (0.12 MΩ, 0.15 MΩ) at week 16. Overall, the observed changes in impedance post-implantation were modest, although, as shown in figure 2A, there was variability, particularly in the mid-frequency range (102-104 Hz). A robust linear regression analysis did not reveal a time-dependent change in the 1 Hz impedance over 16 weeks (p = 0.421, slope = −0.034 MΩ/week, 95% CI = (−0.11 MΩ/week, 0.049 MΩ/week)). For the 1 kHz data, we observed a small but significant positive trend (p < 0.001, slope = 0.059 MΩ/week, 95% CI = (0.043 MΩ/week, 0.073 MΩ/week)); however, it is not expected that the magnitude of the change would compromise the recording performance of the electrodes. Likewise, we observed a small but significant positive trend in the 30 kHz impedance (p < 0.001, slope = 0.001 MΩ/week, 95% CI = (0.0008 MΩ/week, 0.0015 MΩ/week)). While the 1 kHz and 30 kHz trendlines are significant, the small magnitude of the slope of the best fit line is indicative of the stability of these probes over time while in vivo.
Figure 2 –

(A) Representative impedance modulus traces from a single SIROF electrode site on a single array in mISF and at 1-, 6-, 12-, and 16-weeks post implantation. (B, C, D) Median, quartiles, and range for impedance magnitude trends at frequencies of 1 Hz (B), 1 kHz (C), and 30 kHz (D). Each point represents the median of all available electrodes across all arrays for every week. The grey box and whisker plot at week 0 represents the results from mISF measurements. Note the scale break in the |Z| axis for B. A robust linear regression was fitted to each of the data sets. p values for the slope’s deviation from 0, calculated slope, and 95% CI are as follows: 1 Hz impedance: p = 0.421, slope = −0.034 MΩ/week, 95% CI = (−0.11 MΩ/week, 0.049 MΩ/week). 1 kHz impedance: p < 0.001, slope = 0.059 MΩ/week, 95% CI = (0.043 MΩ/week, 0.073 MΩ/week. 30 kHz impedance: p < 0.001, slope = 0.001 MΩ/week, 95% CI = (0.0008 MΩ/week, 0.0015 MΩ/week).
CV measurements also revealed chronic stability similar to the impedance data. Representative CV curves from a single SIROF electrode at 50 mV/s and 50,000 mV/s sweep rates are shown in figures 3A and 3B, respectively, noting the difference in current scales between 50 mV/s and 50,000 mV/s. Figures 3C and 3D shows the median CSCc for each sweep rate over 16 weeks, including a robust regression fit to the data. Median and quartile CSCc values in mISF were 53.2 mC/cm2 (37.3 mC/cm2, 71.5 mC/cm2) at 50 mV/s and 7.22 mC/cm2 (4.12 mC/cm2, 11.1 mC/cm2) at 50,000 mV/s. On the first week following implantation, the median CSCc at 50 mV/s increased to 58.1 mC/cm2 (35.8 mC/cm2, 76.2 mC/cm2). At 16 weeks post-implantation, the median 50 mV/s CSCc was 55.9 mC/cm2 (49.1 mC/cm2, 64.2 mC/cm2). The mISF and week 1 50 mV/s CSCc were not significantly different (p = 0.574, Mann-Whitney U Test). Like the impedance data, we fit a robust linear regression model to the in vivo CSCc data. A robust linear regression showed no significant trend in 50 mV/s CSCc over 16 weeks (p = 0.112, slope = 0.237 mC/cm2-week, 95% CI = (−0.055 mC/cm2-week, 0.528 mC/cm2-week)). At one-week post-implantation, the 50,000 mV/s CSCc declined to 4.27 mC/cm2 (2.97 mC/cm2, 6.61 mC/cm2), which was significant (p < .0001, Mann-Whitney U Test). Subsequently, the median 50,000 mV/s CSCc showed a slight but significant increase reaching 5.93 mC/cm2 (4.01 mC/cm2, 7.72 mC/cm2) by week 16. We observed a significant positive slope in the 50,000 mV/s sweep CSCc (p < 0.001, slope = 0.063 mC/cm2-week, 95% CI = (0.028 mC/cm2-week, 0.098 mC/cm2-week)). These changes in CSCc over 16 weeks, are extremely small and suggest that the SIROF electrode coatings and encapsulation are generally stable in vivo over this implantation period. Overall, these electrochemical observations suggest relatively consistent stability for chronically implanted a-SiC devices.
Figure 3 –

Representative CV curves at 50 mV/s (A) and 50,000 mV/s (B) sweep rate of a SIROF electrode site in mISF and at weeks 1, 6, 12, and 16 post implantation. (C, D) Median, quartiles, and range for CSCc at 50 mV/s (C) and 50,000 mV/s (D). Box and whisker plots show the median CSCc of all available electrodes across all arrays for that week. Note the scale break in the CSCc axis for C and D. A robust linear regression is fitted to the data and plotted with a 95% confidence interval. Pre-implantation mISF data were omitted from the regression analysis. The grey box and whisker plot at week 0 is from mISF measurements. p values for the slope’s deviation from 0, calculated slope, and 95% CI are as follows: 50 mV/s sweep rate: p = 0.112, slope = 0.237 mC/cm2-week, 95% CI = (−0.055 mC/cm2-week, 0.528 mC/cm2-week. 50,000 mV/s sweep rate: p < 0.001, slope = 0.063 mC/cm2-week, 95% CI = (0.028 mC/cm2-week, 0.098 mC/cm2-week).
Neural Recordings
A-SiC devices recorded neural activity over the 16 weeks of implantation in rat motor cortex. Figure 4C shows the AEY from all a-SiC MEAs. Each point represents the collection of all recordings taken each week post-implantation, across all functional electrode channels in all animals. On the day of surgery for each animal, all 112 electrode channels appeared functional, and 92% recorded single unit activity. There was an overall decline in the AEY over time. 16-weeks post-implantation, the AEY declined to ~51% of the 80 remaining functioning channels, indicating that single units could still be detected on a small majority of these channels. A linear regression was performed to quantify the general downward trend in AEY. We found that the slope of the regression line significantly deviated from 0 in the negative direction, reflecting the downward trend. (p < 0.001, slope = −0.02 %/week, 95% CI = (−0.030 %/week, −0.013%/week)). To assess if the week-to-week transitions in the AEY were significant versus the continuous trend over the implantation period, we calculated the standard deviation of week-to-week differences in AEY. We reasoned that a transition in AEY that constituted more than 1.96 standard deviations (p > 0.05) would indicate a noteworthy event between weekly recordings. None of the transitions in AEY from week to week exceeded more than 1.96 standard deviations suggesting that the week-to-week changes observed in AEY are part of continuous decreasing trend over the implantation period. Furthermore, we observed that there was only one event, week 13 to week 14, where the change in AEY was greater than 1 standard deviation.
Figure 4 –

Representative single unit neuronal recordings, unit identification, and AEY over time. (A) representative 30 s epoch of band-pass filtered neural activity (300–3000 Hz) with a corresponding raster plot showing spikes associated with two representative single units in the epoch from weeks 1 (left) and 12 (right) and (B) their corresponding averaged neuronal waveforms, classified as fast spiking (blue) and slow spiking (pink). (C) AEY for each week following implantation.
Immunohistochemistry
A schema showing the approximate placement of the electrodes with respect to the cortical layers is shown in Figure 7A. Representative stained slices of brains from depths of 100–800 μm and 800–1200 μm for a-SiC devices and contralateral brain slices with no implant (sham) are shown in Figure 7B. These depths were chosen to highlight differences in tissue response in the superficial layer, where there are no electrode recording sites, (100 to 800 μm deep) and recording depths where electrode sites reside (800–1200 μm deep). Figure 7C displays the average relative GFAP intensity as a function of distance from the implant site (or sham implant site) for GFAP and averaged normalized count for NeuN at the superficial and electrode site depths. The data presented in Figure 7C were derived from a cohort of seven a-SiC implanted brains, where the superficial depth comprised 18 slices and the deep region comprised 8 slices. For the analysis of sham brains data, a total of 5 brains were processed, consisting of 13 superficial slices and 10 deep slices. For GFAP staining around the implantation sites, the a-SiC device exhibited an average relative GFAP intensity of 1.72 ± 0.29 (mean ± standard error) for superficial depths between 0–50 μm from the implant site. We observed that the GFAP response decreased to 1.01 ± 0.02 between 450–500 μm from the implant site. Sham slices had a mean relative GFAP intensity of 0.98 ± 0.02 between 0–50 μm and 1.02 ± 0.02 between 450–500 μm from the implant site. A two-way ANOVA found that there was a significant difference between a-SiC and sham GFAP expression at shallow depth (p < 0.001, two-way ANOVA). At 200 μm from the implant site, we observed that there was no longer a significant difference between a-SiC slices and sham slices (p = 0.107). At recording electrode site depths, we observed that the mean relative GFAP intensity of a-SiC slices was 1.02 ± 0.02 at 0–50 μm from the implant site, decreasing to 0.93 ± 0.01 at 450–500 μm. For the deep layer (800–1200 μm) sham slices were found to have a mean relative GFAP intensity of 0.97 ± 0.02 at 0–50 μm from the implant site and 0.93 ± 0.02 at 450–500 μm. A two-way ANOVA found that there was a significant difference between a-SiC and sham GFAP expression at electrode recording depth (p < 0.001, two-way ANOVA). We found that at 150 μm away from the implant site, there was no significant difference between a-SiC slices and sham slices for recording electrode depths (p = 0.126). These results indicate a depth-dependent astrocytic response that is more prominent at superficial depths, consistent with prior work [52]. The GFAP intensity and spatial extent from the probe site both decreased in the deeper layers.
Figure 7 –

(A) Diagram of one shank of a MEA showing the superficial and recording-depth regions. (B) Representative IHC staining for brains implanted with a-SiC devices from the region surrounding the implant and from the contralateral sham (un-implanted) hemisphere. Images at a superficial region (100–800 μm, left) and deeper (800–1200 μm, right) below the surface of the cortex are shown for GFAP, NeuN, and bright field images. Bright field images were used to identify implant hole locations. (C) Mean and standard error for normalized counts of NeuN and relative intensity of GFAP staining. Normalized NeuN count and GFAP intensity taken from the 100–800 μm depth (left) and from 800–1200 μm depth (right).
As evidenced by NeuN staining, neural cell counts were not different between implant sites and sham controls for both the superficial and deep depths. At superficial depths, we found that the mean normalized cell count of a-SiC implanted slices was 0.92 ± 0.04 at 0–50 μm away from the implant locations and 1.02 ± 0.06 at 450–500 μm. Sham slices were found to have a mean cell count of 0.97 ± 0.02 at 0–50 μm and 1.02 ± 0.03 at 450–500 μm. At recording depths, the averaged cell count of a-SiC implanted devices was 0.95 ± 0.05 at 0–50 μm and 1.01 ± 0.04 at 450–500 μm. Similarly, sham slices had a mean cell count of 1.01 ± 0.02 at 0–50 μm and 1.05 ± 0.01 at 450–500 μm from the pseudo implant location. For both depths, when comparing normalized cell counts at similar distances away from the implant location we found no statistically significant difference between the a-SiC implanted slices and the sham slices (superficial layers, p = 0.484; recording depth layers, p = 0.675, two-way ANOVA). From these data we conclude that while a-SiC electrode arrays may cause some astroglial response, there appears to be no statistically significant difference of cortical neurons between cortices with a-SiC devices and sham brains after a 16-week implantation period. Altogether, the results from electrochemistry, neural recordings and immunohistochemistry show stability of the neural interface enabling 16-week chronic single neuron recordings with a tissue response that appears to preserve neurons in the proximity of the implanted MEAs.
Discussion
In this work, we have demonstrated for the first time that a-SiC devices created using thin film fabrication processes can be used to record neural activity in rat motor cortex up to 16 weeks. In addition, in vivo measurements of electrode impedance and cyclic voltammetry were stable over this time period. The regression fit for the 1 Hz impedance data did not have a significant deviation from 0, indicating that the a-SiC insulation is stable over time. However, we did observe that the 1 kHz and 30 kHz impedance values did have a slope deviating positively from 0. This increase in the mid and high frequency impedance could be indicative of the formation of tissue encapsulation around the electrode sites [46]. When normalized to the geometric surface area of the electrode sites, the impedance magnitudes at 1 kHz in this study are similar to iridium or iridium oxide electrode sites reported on polyimide and single shank Si based microelectrode arrays, approximately 1 MΩ [55], [56]. These other studies also observed an increase in the 1 kHz impedance over 16 weeks post implantation. Given that the linear regression trendline in slow sweep CSCc measurements was not significantly different from zero, breakdown of the insulating a-SiC is not suspected. The generally flat trend in CSCc for both low (50 mV/s) and high (50,000 mV/s) sweep rates also indicates that there is no exposure of underlying metallization or development of leakage pathways between channels. At the end of the 16-week period, 24% of electrodes were observed to have an EIS and CV profile associated with a disconnected channel. Although we are unable to make a definitive assessment of the cause for disconnected channels, we hypothesize that disconnection at the backend connector is a possible candidate, as the observed CVs were associated with an open circuit measurement. Given that both the EIS and CV measurements observed in this study remained relatively consistent over time, a-SiC is a good candidate for electrical insulation and bulk construction of neural interface devices.
Overall, we observed a decline in the AEY, with 51% of connected electrode channels recording single unit activity at the end of the 16-week study. Previous observations have reported on the AEY of single shank Si-based electrode arrays with a similar general decline in single unit recordings over time [56]. Other studies have demonstrated a decline to less than 10% within 8 weeks post-implantation, when using multi-shank devices [26], [52]. It is important to note that prior work [52] revealed a significant difference in the rate of decline between single- and multi-shank planar Si-based electrode arrays, where multi-shank devices can experience up to a 90% decline within 8 weeks post-implantation. These observations suggest that the surgical impact of multi-shank implantation and indwelling presence may accelerate the neuroinflammatory response, leading to a decline of neural recordings. A follow-up study examining single shank a-SiC devices with similar geometries used in this study may reveal more about the impact of multi-shank probes on the neuroinflammatory response and would provide the ability to directly compare with larger Si-based arrays. Additionally, a study examining the spacing between shanks or staggering the length of shanks on a multi-shank array may reveal information about the role of the neuroinflammatory response in observed declines in neural recording performance. Although our AEY declined over 16 weeks, we note that the decline was variable with transient decreases and recoveries. The processes underlying the overall decline and the variability in AEY were not elucidated in this study. A more comprehensive assessment of tissue response, including performing immunohistochemistry at several time points and staining for markers for BBB leakage, could uncover a possible explanation.
Other measures of recording capability also showed stability over the course of the study. The recording performance of the a-SiC devices was comparable to that of the Si based devices of similar colinear shank design presently used in many neural recording studies [13], [57]. The SNR of recordings made using Si devices has been observed to decline from 8 to 6.8 in a 16-week study [39]. At week 16, recordings made using a-SiC devices had a median SNR of 8.9. We also attempted to distinguish neuron types and examine the relative stability of these neuron types based on the trough-to-peak durations of single unit waveforms. The ability to distinguish neuron types may offer insights into any differential stability of single units as a function of different array geometries or modifications [58]. The number of fast- and slow-repolarizing neurons per functioning electrode channel declined over time, consistent with the decline in AEY. However, the difference in the rate of decline between fast- and slow-repolarizing neurons was not statistically significant, indicating both groups were similarly impacted by the implant.
Furthermore, we have demonstrated that a-SiC based probes exhibited minimal changes in reactive astrocyte and neuronal nuclei expression, especially at depths 800 μm below the pial surface. The astroglial scar around a neural implant can begin to form as early as 48 hours post-implantation [21], [59], and the recording performance can diminish with increasing separation between electrodes and presumptive neuronal source [24], [25]. Overall, a-SiC based probes exhibited a reduced tissue response as compared to Si based arrays when examined qualitatively with a previously reported study that showed significant astroglial response and decline in local neuronal cell bodies near the implant site at depths 1400 μm below the pial surface [24]. We have also found that the changes in reactive astrocyte and neuronal nuclei expression are similar to that of ultra flexible devices, such as the StimNET, which demonstrated a 10% increase in GFAP expression at 50 μm from the implanted array versus a control and no significant difference at 100 μm from the implant location [55]. In this work, we observed a 20% increase over a sham control and no significant difference in GFAP expression at 150 μm from the implant location. NeuN expression was similar in both studies, with no significant difference between implanted and control slices [55]. In the future, a more complete assessment of tissue response would examine additional parameters, including BBB leakage and microglia expression. Additionally, a-SiC MEA in this work had a calculated stiffness of 0.8 mN/m. When compared to the stiffness of devices examined in a meta-analysis by Stiller et al. [60], the stiffness of a-SiC devices are comparable to other devices associated with reduced GFAP expression.
Anecdotally, recovered a-SiC probes were found to have minimal tissue adhesion on explanation. At most we observed a 5 μm thick encapsulation on a probe and observed minimal encapsulation on others. We were also able to easily identify metallization, electrode sites, and via features on arrays with minimal encapsulation. However, a-SiC probes were difficult to consistently retrieve from the cortex to analyze tissue adhesion. Superficial layers of the tissues implanted with a-SiC probes have a higher concentration of activated astrocytes compared to the deeper layers, which may be associated with a length-dependent reduced flexibility of the shanks close to the pial surface of the brain. The shanks are more flexible at greater depths due to decreased flexural rigidity as the implanted shank length increases [33]. Based on the NeuN staining data in Figure 7C, no difference in the normalized count of neurons between the implant and sham sites with either depth or distance from the implant was observed. There was, however, a significantly larger astrocytic response to the implant at superficial layers versus deeper layers. Similar depth-dependent differential expressions of GFAP and NeuN was reported by Usoro et al. [52]. Although cortical inhomogeneity may play a role in the increased astroglial response in superficial layers [61], there was a reduced GFAP expression in recording layers where the a-SiC MEAs have lower flexural stiffness.
The thin-film fabrication techniques used for a-SiC neural interface devices offer several potential benefits. The thin film deposition methods used to fabricate a-SiC allow for uniform and precise deposition of a-SiC layers onto a variety of substrates. This, along with the photolithographic patterning techniques, provides flexibility in device geometries to meet the needs of the study of interest. Additionally, thin film a-SiC devices are amenable to manipulation and integration with existing electronic systems. The compatibility of a-SiC with traditional silicon-based microfabrication techniques may allow for future active electronic circuitry to be incorporated in the device architecture.
Conclusion
In this work, we demonstrated that multi-shank a-SiC MEAs have a stable electrochemical profile and can record single unit action potentials chronically over 16 weeks in rat cortex. The recordings maintain a high signal-to-noise ratio and preserve both fast-repolarizing and slow-repolarizing units. We have demonstrated that the astroglial response to the a-SiC arrays is modest and extends, depth-dependently, with less response at depths containing electrode sites. Neuronal cell body counts were not statistically different between implant and sham controls at either superficial or deep depths. Overall, amorphous silicon carbide may provide a platform for the development of robust MEA devices for chronic neural recording and stimulation. Future challenges include the development of robust interconnects to preserve electrical connectivity between recording sites and external connectors and to better understand the decline in AEY. It will be useful to examine correlations between the AEY, including other measures of neural recording performance, and the tissue response using a broader suite of IHC assessments.
Supplementary Material
Figure 5 –

Summary of weekly neural recording data of all functional electrodes across all arrays for day-of-surgery and weeks 1–16: (A) peak-to-peak voltage, (B) RMS noise, (C) signal-to-noise ratio, and (D) spike rate. Boxes represent the 1st and 3rd quartiles, the horizontal line inside each box represents the median, and the whiskers show the range of values from minimum to maximum after removal of outliers. A robust linear regression, omitting day-of-surgery data with 95% confidence intervals is included in pink. Here week 0 represents the neural recording during the day of surgery, but because of the potential effects of surgical anesthesia, it has been excluded from regression analysis.
As shown in Figure 5, we observed a decline in the average peak-to-peak voltage (p < 0.05, slope = −1.35 μV/week, 95% CI = (−1.85, −0.85)), beginning at 141 μV on the day of surgery, 114 μV 1-week post implantation and a final amplitude of 85 μV at the end of the study. The median signal-to-noise ratio at week 1was 12.3. These results showed a small decline in SNR beginning at 12.5 and declining at a rate of 0.19 per week that was significant (p < 0.001, slope = −0.19/week, 95% CI = (−0.24, −0.14)). The spike rate also exhibited a significant decrease (p < 0.001, slope = −0.35 Hz/week, 95% CI = (−0.43, −0.26)).
Figure 6 –

(A) Representative fast (left) and slow (right) repolarizing units, which are putatively inhibitory and excitatory respectively. (B) Histograms showing the units per active channel classified as fast and slow repolarizing on week 1 (left) and week 12 (right). The dashed vertical line represents the threshold identified using otsuthresh as described above. (C) the units per active channel each week classified as fast (blue) and slow (pink) repolarizing and linear regression for the change of both. There is no statistically significant difference in the rate of decline of either type of unit. (D) the proportion of fast (blue) and slow (pink) repolarizing units each week.
Figure 6 shows examples of a fast-repolarizing, or putative inhibitory, neuron and a slow-repolarizing, or putative excitatory, neuron, defined by having a trough-to-peak times of less than 0.4 ms and greater than 0.4 ms, respectively [40]. The histograms in figure 6B show the number of units in each time bin. The broken line indicates the 0.4 ms threshold at one week and twelve weeks post-implantation. The graph in figure 6C shows the average units per active channel (defined in the section on electrochemistry) that were classified as either excitatory or inhibitory, as well as a robust linear regression line for both putative excitatory (p = 0.026, slope = −0.022 units/channel, 95% CI = (−0.041, −0.0030)) and inhibitory (p = 0.0024, slope = −0.046 units/channel, 95% CI= (−0.073, −0.019)). Both slopes were significantly different from zero, but they were not statistically different from one another (p = 0.13).
Table II -.
CSCc medians and IQR values at different time points at 50 mV/s and 50,000 mV/s. Lower and Upper IQR ranges are listed in parentheses.
| CSCc (mC/cm2) | 50 mV/s | 50,000 mV/s |
|---|---|---|
| mISF | 53.2 (37.3, 71.5) | 7.22 (4.12, 11.1) |
| Week 1 | 58.1 (35.8, 76.2) | 4.27 (2.97, 6.61) |
| Week 16 | 55.9 (49.1, 64.2) | 5.93 (4.01, 7.72) |
Acknowledgements
This research was supported by the National Institute of Neurological Disorders and Stroke of the National Institutes of Health grant R01NS104344. The content is solely the responsibility of the authors and does not necessarily represent the official views of the National Institutes of Health.
We thank Shishir Waghray and Arya Raju for their assistance with immunohistochemical analysis.
Declaration of interests
Stuart F. Cogan reports financial support was provided by National Institutes of Health. Stuart F. Cogan has patent Method of manufacturing a neural interface probe employing amorphous silicon carbide pending to Boston University, University of Texas System. If there are other authors, they declare that they have no known competing financial interests or personal relationships that could have appeared to influence the work reported in this paper.
Footnotes
Publisher's Disclaimer: This is a PDF file of an unedited manuscript that has been accepted for publication. As a service to our customers we are providing this early version of the manuscript. The manuscript will undergo copyediting, typesetting, and review of the resulting proof before it is published in its final form. Please note that during the production process errors may be discovered which could affect the content, and all legal disclaimers that apply to the journal pertain.
Institutional Review Board Statement
The study was conducted according to the guidelines approved by the Institutional Animal Care and Use Committee of The University of Texas at Dallas (Protocol 18–13 approved 26 September, 2018).
Conflicts of Interest
The authors declare no conflict of interest.
Data Availability
The raw data required to reproduce these findings are available upon reasonable request.
References
- [1].Velliste M, Perel S, Spalding MC, Whitford AS, and Schwartz AB, “Cortical control of a prosthetic arm for self-feeding,” Nature, vol. 453, no. 7198, pp. 1098–1101, Jun. 2008, doi: 10.1038/nature06996. [DOI] [PubMed] [Google Scholar]
- [2].Flesher SN et al. , “A brain-computer interface that evokes tactile sensations improves robotic arm control,” Science, vol. 372, no. 6544, pp. 831–836, May 2021, doi: 10.1126/science.abd0380. [DOI] [PMC free article] [PubMed] [Google Scholar]
- [3].Towle VL, Pham T, McCaffrey M, Allen D, and Troyk PR, “Toward the development of a color visual prosthesis,” J. Neural Eng, vol. 18, no. 2, p. 023001, Apr. 2021, doi: 10.1088/1741-2552/abd520. [DOI] [PubMed] [Google Scholar]
- [4].Berger TW et al. , “A Hippocampal Cognitive Prosthesis: Multi-Input, Multi-Output Nonlinear Modeling and VLSI Implementation,” IEEE Trans. Neural Syst. Rehabil. Eng, vol. 20, no. 2, pp. 198–211, Mar. 2012, doi: 10.1109/TNSRE.2012.2189133. [DOI] [PMC free article] [PubMed] [Google Scholar]
- [5].Homer ML, Nurmikko AV, Donoghue JP, and Hochberg LR, “Sensors and Decoding for Intracortical Brain Computer Interfaces,” Annu. Rev. Biomed. Eng, vol. 15, no. 1, pp. 383–405, Jul. 2013, doi: 10.1146/annurev-bioeng-071910-124640. [DOI] [PMC free article] [PubMed] [Google Scholar]
- [6].Harris KD and Mrsic-Flogel TD, “Cortical connectivity and sensory coding,” Nature, vol. 503, no. 7474, pp. 51–58, Nov. 2013, doi: 10.1038/nature12654. [DOI] [PubMed] [Google Scholar]
- [7].Normann RA and Fernandez E, “Clinical applications of penetrating neural interfaces and Utah Electrode Array technologies,” J. Neural Eng, vol. 13, no. 6, p. 061003, Dec. 2016, doi: 10.1088/1741-2560/13/6/061003. [DOI] [PubMed] [Google Scholar]
- [8].Kipke DR, Vetter RJ, Williams JC, and Hetke JF, “Silicon-substrate intracortical microelectrode arrays for long-term recording of neuronal spike activity in cerebral cortex,” IEEE Trans. Neural Syst. Rehabil. Eng, vol. 11, no. 2, pp. 151–155, Jun. 2003, doi: 10.1109/TNSRE.2003.814443. [DOI] [PubMed] [Google Scholar]
- [9].Armenta Salas M et al. , “Proprioceptive and cutaneous sensations in humans elicited by intracortical microstimulation,” eLife, vol. 7, p. e32904, Apr. 2018, doi: 10.7554/eLife.32904. [DOI] [PMC free article] [PubMed] [Google Scholar]
- [10].Bouton CE et al. , “Restoring cortical control of functional movement in a human with quadriplegia,” Nature, vol. 533, no. 7602, pp. 247–250, May 2016, doi: 10.1038/nature17435. [DOI] [PubMed] [Google Scholar]
- [11].Flesher SN et al. , “Intracortical microstimulation of human somatosensory cortex,” Sci. Transl. Med, vol. 8, no. 361, Oct. 2016, doi: 10.1126/scitranslmed.aaf8083. [DOI] [PubMed] [Google Scholar]
- [12].Kozai TDY et al. , “Comprehensive chronic laminar single-unit, multi-unit, and local field potential recording performance with planar single shank electrode arrays,” J. Neurosci. Methods, vol. 242, pp. 15–40, Mar. 2015, doi: 10.1016/j.jneumeth.2014.12.010. [DOI] [PMC free article] [PubMed] [Google Scholar]
- [13].Chestek CA et al. , “Long-term stability of neural prosthetic control signals from silicon cortical arrays in rhesus macaque motor cortex,” J. Neural Eng, vol. 8, no. 4, p. 045005, Aug. 2011, doi: 10.1088/1741-2560/8/4/045005. [DOI] [PMC free article] [PubMed] [Google Scholar]
- [14].Barrese JC, Aceros J, and Donoghue JP, “Scanning electron microscopy of chronically implanted intracortical microelectrode arrays in non-human primates.,” J Neural Eng, vol. 13, no. 2, Art. no. 2, 2016, doi: 10.1088/1741-2560/13/2/026003. [DOI] [PMC free article] [PubMed] [Google Scholar]
- [15].Patel PR et al. , “Utah array characterization and histological analysis of a multi-year implant in non-human primate motor and sensory cortices,” J. Neural Eng, vol. 20, no. 1, p. 014001, Feb. 2023, doi: 10.1088/1741-2552/acab86. [DOI] [PMC free article] [PubMed] [Google Scholar]
- [16].Anderson JM, Rodriguez A, and Chang DT, “Foreign body reaction to biomaterials,” Semin. Immunol, vol. 20, no. 2, pp. 86–100, Apr. 2008, doi: 10.1016/j.smim.2007.11.004. [DOI] [PMC free article] [PubMed] [Google Scholar]
- [17].Lecomte A, Descamps E, and Bergaud C, “A review on mechanical considerations for chronically-implanted neural probes,” pp. 0–12, 2017, doi: 10.1088/1361-6579/aa9828. [DOI] [PubMed]
- [18].Turner JN et al. , “Cerebral Astrocyte Response to Micromachined Silicon Implants,” Exp. Neurol, vol. 156, no. 1, pp. 33–49, Mar. 1999, doi: 10.1006/exnr.1998.6983. [DOI] [PubMed] [Google Scholar]
- [19].Polikov VS, Tresco PA, and Reichert WM, “Response of brain tissue to chronically implanted neural electrodes,” J. Neurosci. Methods, vol. 148, no. 1, Art. no. 1, 2005, doi: 10.1016/j.jneumeth.2005.08.015. [DOI] [PubMed] [Google Scholar]
- [20].Black BJ et al. , “Chronic recording and electrochemical performance of Utah microelectrode arrays implanted in rat motor cortex,” J. Neurophysiol, p. jn.00181.2018, 2018, doi: 10.1152/jn.00181.2018. [DOI] [PubMed] [Google Scholar]
- [21].Kozai TDY, Vazquez AL, Weaver CL, Kim SG, and Cui XT, “In vivo twophoton microscopy reveals immediate microglial reaction to implantation of microelectrode through extension of processes,” J. Neural Eng, vol. 9, no. 6, Art. no. 6, 2012, doi: 10.1088/1741-2560/9/6/066001. [DOI] [PMC free article] [PubMed] [Google Scholar]
- [22].Wellman SM et al. , “Cuprizone-induced oligodendrocyte loss and demyelination impairs recording performance of chronically implanted neural interfaces,” Biomaterials, vol. 239, p. 119842, May 2020, doi: 10.1016/j.biomaterials.2020.119842. [DOI] [PMC free article] [PubMed] [Google Scholar]
- [23].Marblestone AH et al. , “Physical principles for scalable neural recording,” Front. Comput. Neurosci, vol. 7, 2013, doi: 10.3389/fncom.2013.00137. [DOI] [PMC free article] [PubMed] [Google Scholar]
- [24].McConnell GC, Rees HD, Levey AI, Gutekunst C-A, Gross RE, and Bellamkonda RV, “Implanted neural electrodes cause chronic, local inflammation that is correlated with local neurodegeneration,” J. Neural Eng, vol. 6, no. 5, p. 056003, Oct. 2009, doi: 10.1088/1741-2560/6/5/056003. [DOI] [PubMed] [Google Scholar]
- [25].Nolta NF, Christensen MB, Crane PD, Skousen JL, and Tresco PA, “BBB leakage, astrogliosis, and tissue loss correlate with silicon microelectrode array recording performance,” Biomaterials, vol. 53, pp. 753–762, Jun. 2015, doi: 10.1016/j.biomaterials.2015.02.081. [DOI] [PubMed] [Google Scholar]
- [26].Seymour JP and Kipke DR, “Neural probe design for reduced tissue encapsulation in CNS,” Biomaterials, vol. 28, no. 25, pp. 3594–3607, Sep. 2007, doi: 10.1016/j.biomaterials.2007.03.024. [DOI] [PubMed] [Google Scholar]
- [27].Zhang A, Mandeville ET, Xu L, Stary CM, Lo EH, and Lieber CM, “Ultraflexible endovascular probes for brain recording through micrometer-scale vasculature,” Science, vol. 381, no. 6655, pp. 306–312, Jul. 2023, doi: 10.1126/science.adh3916. [DOI] [PMC free article] [PubMed] [Google Scholar]
- [28].Letner JG et al. , “Post-explant profiling of subcellular-scale carbon fiber intracortical electrodes and surrounding neurons enables modeling of recorded electrophysiology,” J. Neural Eng, vol. 20, no. 2, p. 026019, Apr. 2023, doi: 10.1088/1741-2552/acbf78. [DOI] [PMC free article] [PubMed] [Google Scholar]
- [29].Kozai TDY et al. , “Ultrasmall implantable composite microelectrodes with bioactive surfaces for chronic neural interfaces,” Nat. Mater, vol. 11, no. 12, pp. 1065–1073, Dec. 2012, doi: 10.1038/nmat3468. [DOI] [PMC free article] [PubMed] [Google Scholar]
- [30].Luan L et al. , “Ultraflexible nanoelectronic probes form reliable, glial scar–free neural integration,” Sci. Adv, vol. 3, no. 2, p. e1601966, Feb. 2017, doi: 10.1126/sciadv.1601966. [DOI] [PMC free article] [PubMed] [Google Scholar]
- [31].Brassard D and Khakani MAE, “Dielectric properties of amorphous hydrogenated silicon carbide thin films grown by plasma-enhanced chemical vapor deposition,” J. Appl. Phys, vol. 93, no. 7, Art. no. 7, 2003, doi: 10.1063/1.1555676. [DOI] [Google Scholar]
- [32].Knaack GL, Charkhkar H, Cogan SF, and Pancrazio JJ, Amorphous SiliconCarbide for Neural Interface Applications. 2016. doi: 10.1016/B978-0-12-802993-0.00010-1. [DOI]
- [33].Geramifard N, Dousti B, Nguyen C, Abbott J, Cogan SF, and Varner VD, “Insertion mechanics of amorphous SiC ultra-micro scale neural probes,” J. Neural Eng, vol. 19, no. 2, p. 026033, Apr. 2022, doi: 10.1088/1741-2552/ac5bf4. [DOI] [PMC free article] [PubMed] [Google Scholar]
- [34].Cogan SF, Edell DJ, Guzelian AA, Liu YP, and Edell R, “Plasma-enhanced chemical vapor deposited silicon carbide as an implantable dielectric coating,” J. Biomed. Mater. Res. - Part A, vol. 67, no. 3, Art. no. 3, 2003, doi: 10.1002/jbm.a.10152. [DOI] [PubMed] [Google Scholar]
- [35].Lei X et al. , “SiC protective coating for photovoltaic retinal prosthesis,” J. Neural Eng, vol. 13, no. 4, p. 046016, Aug. 2016, doi: 10.1088/1741-2560/13/4/046016. [DOI] [PMC free article] [PubMed] [Google Scholar]
- [36].Kalnins U, Erglis A, Dinne I, Kumsars I, and Jegere S, “Clinical outcomes of silicon carbide coated stents in patients with coronary artery disease,” Med Sci Monit, vol. 8, no. 2, Art. no. 2, 2002. [PubMed] [Google Scholar]
- [37].Deku F, Cohen Y, Joshi-Imre A, Kanneganti A, Gardner TJ, and Cogan SF, “Amorphous silicon carbide ultramicroelectrode arrays for neural stimulation and recording,” J. Neural Eng, vol. 15, no. 1, Art. no. 1, 2018, doi: 10.1088/1741-2552/aa8f8b. [DOI] [PMC free article] [PubMed] [Google Scholar]
- [38].Jeakle EN et al. , “Chronic Stability of Local Field Potentials Using Amorphous Silicon Carbide Microelectrode Arrays Implanted in the Rat Motor Cortex,” Micromachines, vol. 14, no. 3, p. 680, Mar. 2023, doi: 10.3390/mi14030680. [DOI] [PMC free article] [PubMed] [Google Scholar]
- [39].Vetter RJ, Williams JC, Hetke JF, Nunamaker EA, and Kipke DR, “Chronic Neural Recording Using Silicon-Substrate Microelectrode Arrays Implanted in Cerebral Cortex,” IEEE Trans. Biomed. Eng, vol. 51, no. 6, pp. 896–904, Jun. 2004, doi: 10.1109/TBME.2004.826680. [DOI] [PubMed] [Google Scholar]
- [40].Frank LM, Brown EN, and Wilson MA, “A Comparison of the Firing Properties of Putative Excitatory and Inhibitory Neurons From CA1 and the Entorhinal Cortex,” J. Neurophysiol, vol. 86, no. 4, pp. 2029–2040, Oct. 2001, doi: 10.1152/jn.2001.86.4.2029. [DOI] [PubMed] [Google Scholar]
- [41].Stice P, Gilletti A, Panitch A, and Muthuswamy J, “Thin microelectrodes reduce GFAP expression in the implant site in rodent somatosensory cortex,” J. Neural Eng, vol. 4, no. 2, pp. 42–53, Jun. 2007, doi: 10.1088/1741-2560/4/2/005. [DOI] [PubMed] [Google Scholar]
- [42].Thelin J et al. , “Implant Size and Fixation Mode Strongly Influence Tissue Reactions in the CNS,” PLoS ONE, vol. 6, no. 1, p. e16267, Jan. 2011, doi: 10.1371/journal.pone.0016267. [DOI] [PMC free article] [PubMed] [Google Scholar]
- [43].Skousen JL and Tresco PA, “The Biocompatibility of Intracortical Microelectrode Recording Arrays for Brain Machine Interfacing,” in Series on Bioengineering and Biomedical Engineering, 2nd ed., vol. 8, World Scientific, 2017, pp. 259–299. doi: 10.1142/9789813207158_0011. [DOI] [Google Scholar]
- [44].Maeng J et al. , “High-charge-capacity sputtered iridium oxide neural stimulation electrodes deposited using water vapor as a reactive plasma constituent,” J. Biomed. Mater. Res. B Appl. Biomater, vol. 108, no. 3, pp. 880–891, Apr. 2020, doi: 10.1002/jbm.b.34442. [DOI] [PubMed] [Google Scholar]
- [45].Khalaji I, Hadavand M, Asadian A, Patel RV, and Naish MD, “Analysis of needletissue friction during vibration-assisted needle insertion,” in 2013 IEEE/RSJ International Conference on Intelligent Robots and Systems, Tokyo: IEEE, Nov. 2013, pp. 4099–4104. doi: 10.1109/IROS.2013.6696943. [DOI] [Google Scholar]
- [46].Krukiewicz K, “Electrochemical impedance spectroscopy as a versatile tool for the characterization of neural tissue: A mini review,” Electrochem. Commun, vol. 116, p. 106742, Jul. 2020, doi: 10.1016/j.elecom.2020.106742. [DOI] [Google Scholar]
- [47].Merrill DR and Tresco PA, “Impedance Characterization of Microarray Recording Electrodes in Vitro,” IEEE Trans. Biomed. Eng, vol. 52, no. 11, pp. 1960–1965, Nov. 2005, doi: 10.1109/TBME.2005.856245. [DOI] [PubMed] [Google Scholar]
- [48].Cogan SF, “Neural Stimulation and Recording Electrodes,” Annu. Rev. Biomed. Eng, vol. 10, no. 1, Art. no. 1, 2008, doi: 10.1146/annurev.bioeng.10.061807.160518. [DOI] [PubMed] [Google Scholar]
- [49].Rolston JD, Gross RE, and Potter SM, “Common median referencing for improved action potential detection with multielectrode arrays,” in 2009 Annual International Conference of the IEEE Engineering in Medicine and Biology Society, Minneapolis, MN: IEEE, Sep. 2009, pp. 1604–1607. doi: 10.1109/IEMBS.2009.5333230. [DOI] [PubMed] [Google Scholar]
- [50].Chen K, Cambi F, and Kozai TDY, “Pro-myelinating Clemastine administration improves recording performance of chronically implanted microelectrodes and nearby neuronal health,” Neuroscience, preprint, Feb. 2023. doi: 10.1101/2023.01.31.526463. [DOI] [PMC free article] [PubMed] [Google Scholar]
- [51].Stiller A et al. , “Mechanically Robust, Softening Shape Memory Polymer Probes for Intracortical Recording,” Micromachines, vol. 11, no. 6, p. 619, Jun. 2020, doi: 10.3390/mi11060619. [DOI] [PMC free article] [PubMed] [Google Scholar]
- [52].Usoro JO et al. , “Influence of Implantation Depth on the Performance of Intracortical Probe Recording Sites,” Micromachines, vol. 12, no. 10, p. 1158, Sep. 2021, doi: 10.3390/mi12101158. [DOI] [PMC free article] [PubMed] [Google Scholar]
- [53].Benjamini Y, Krieger AM, and Yekutieli D, “Adaptive linear step-up procedures that control the false discovery rate,” Biometrika, vol. 93, no. 3, pp. 491–507, Sep. 2006, doi: 10.1093/biomet/93.3.491. [DOI] [Google Scholar]
- [54].Grill WM, Thomas Mortimer J Electrical properties of implant encapsulation tissue. Ann Biomed Eng 22, 23–33 (1994). 10.1007/BF02368219 [DOI] [PubMed] [Google Scholar]
- [55].Lycke R et al. , “Low-threshold, high-resolution, chronically stable intracortical microstimulation by ultraflexible electrodes,” Cell Rep, vol. 42, no. 6, p. 112554, Jun. 2023, doi: 10.1016/j.celrep.2023.112554. [DOI] [PMC free article] [PubMed] [Google Scholar]
- [56].Kozai TDY et al. , “Effects of caspase-1 knockout on chronic neural recording quality and longevity: Insight into cellular and molecular mechanisms of the reactive tissue response,” Biomaterials, vol. 35, no. 36, pp. 9620–9634, Dec. 2014, doi: 10.1016/j.biomaterials.2014.08.006. [DOI] [PMC free article] [PubMed] [Google Scholar]
- [57].Okun M, Lak A, Carandini M, and Harris KD, “Long Term Recordings with Immobile Silicon Probes in the Mouse Cortex,” PLOS ONE, vol. 11, no. 3, p. e0151180, Mar. 2016, doi: 10.1371/journal.pone.0151180. [DOI] [PMC free article] [PubMed] [Google Scholar]
- [58].Zeng H and Sanes JR, “Neuronal cell-type classification: challenges, opportunities and the path forward,” Nat. Rev. Neurosci, vol. 18, no. 9, pp. 530–546, Sep. 2017, doi: 10.1038/nrn.2017.85. [DOI] [PubMed] [Google Scholar]
- [59].Savya SP et al. , “In vivo spatiotemporal dynamics of astrocyte reactivity following neural electrode implantation,” Biomaterials, vol. 289, p. 121784, Oct. 2022, doi: 10.1016/j.biomaterials.2022.121784. [DOI] [PMC free article] [PubMed] [Google Scholar]
- [60].Stiller A et al. , “A Meta-Analysis of Intracortical Device Stiffness and Its Correlation with Histological Outcomes,” Micromachines, vol. 9, no. 9, p. 443, Sep. 2018, doi: 10.3390/mi9090443. [DOI] [PMC free article] [PubMed] [Google Scholar]
- [61].Beaulieu C, “Numerical data on neocortical neurons in adult rat, with special reference to the GABA population,” Brain Res, vol. 609, no. 1–2, pp. 284–292, Apr. 1993, doi: 10.1016/0006-8993(93)90884-P. [DOI] [PubMed] [Google Scholar]
Associated Data
This section collects any data citations, data availability statements, or supplementary materials included in this article.
Supplementary Materials
Data Availability Statement
The raw data required to reproduce these findings are available upon reasonable request.