

Abstract
Adhesion to and clearance of the mesothelial monolayer are key early events in metastatic seeding of ovarian cancer. ROR2 is a receptor tyrosine kinase that interacts with Wnt5a ligand to activate non-canonical Wnt signaling and has been previously shown to be upregulated in ovarian cancer tissue. However, no prior study has evaluated the mechanistic role of ROR2 in ovarian cancer. Through a cellular high throughput genetic screen, we independently identified ROR2 as a driver of ovarian tumor cell adhesion and invasion. ROR2 expression in ovarian tumor cells serves to drive directed cell migration preferentially towards areas of high Wnt5a ligand, such as the mesothelial lined omentum. Additionally, ROR2 promotes ovarian tumor cell adhesion and clearance of a mesothelial monolayer. Depletion of ROR2, in tumor cells, reduces metastatic tumor burden in a syngeneic model of ovarian cancer. These findings support the role of ROR2 in ovarian tumor cells as a critical factor contributing to the early steps of metastasis. Therapeutic targeting of the ROR2/Wnt5a signaling axis could provide a means of improving treatment for patients with advanced ovarian cancer.
Introduction
Ovarian cancer is the leading cause of gynecologic malignancy related deaths in the United States. Unique from other malignancies of epithelial origin, the metastatic cascade of epithelial ovarian tumors commonly occurs via peritoneal exfoliation, and most metastases are confined within the abdominal peritoneal cavity1. Ovarian tumor cells or spheroids, after detaching from sites of primary development, spread or metastasize to sites within the peritoneal cavity. These disseminated ovarian cancer cells must adhere to and then clear the mesothelial cell monolayer lining these sites for successful attachment to the sub-mesothelial extracellular matrix (ECM)2. Metastatic implants form on the intraperitoneal surface of bowel, diaphragm, omentum and other peritoneal sites2,3.
A unique attribute of ovarian cancer is the accumulation of ascites fluid within the peritoneal cavity. This ascitic fluid is rich in both non-tumor cellular components (fibroblasts, immune cells), as well as acellular components such as ECM proteins, matrix-modifying enzymes, cytokines, and growth factors4,5. In this regard, the ascites can serve as a reservoir for mediators of ovarian cancer cell progression and growth. When establishing secondary tumors, ovarian spheroids must first migrate within this ascites to the various sites within the peritoneal cavity. Whether this migration is driven by active processes, or passive bulk fluid flow is largely understudied. After arriving at the secondary site, ovarian tumor cells must then attach to the mesothelium, a process driven, in part, by integrin-ECM interactions4,6. To form successful metastatic implants, the cells must clear the mesothelial surface and degrade the underlying ECM of the basement membrane. This is an active process requiring myosin-generated forces to drive the clearance of the mesothelial layer2, and expression of various cell adhesion molecules and matrix degrading enzymes to successfully invade7,8. Therefore, an increased understanding of the cellular and molecular targets important for one or more of these steps has the potential to drive new therapeutic strategies directed at preventing or treating metastatic ovarian cancer by preventing tumor invasion and spread.
ROR2, a member of the receptor tyrosine kinase orphan receptor (ROR) family, belongs to the receptor tyrosine kinase (RTK) superfamily. Previously an orphan receptor, ROR2 is now known to interact with Wnt5a ligand to activate non-canonical Wnt signaling activity9. ROR2 expression is developmentally regulated and exhibits roles in a wide variety of tissues during early embryonic development. For example, ROR2 and non-canonical Wnt signaling regulates planar cell polarity (PCP) and collective migration of developing tissues such as elongation of the limb bud10. In a variety of tumors, core Wnt/PCP components are dysregulated and implicated in promoting tumor cell migration and metastasis11. Roles of ROR2 in normal adult tissues are largely unknown, however ROR2 expression has been shown to be upregulated in a large number of human tumors (osteosarcoma, melanoma, renal cell carcinoma, prostate, colorectal) and associated with higher risk disease9. A previous study revealed higher levels of ROR2 by immunostaining in ovarian cancer tissue sections as compared to benign controls, with no differences in expression between the four main subtypes of epithelial ovarian cancer: serous, endometrioid, clear cell and mucinous12. Further work illustrated an upregulation of ROR2 in a platinum resistant, high grade serous ovarian cancer cohort as compared to platinum sensitive samples in that cohort13. Additionally, Wnt5a, the ligand for ROR2, has been shown to be expressed by peritoneal mesothelial cells and adipocytes of the ovarian tumor microenvironment and to promote ovarian cancer metastasis14.
In this study, we developed a multicellular assay incorporating tumor and microenvironment interactions to carry out an unbiased, high throughput genetic screen using a human kinome siRNA library to identify drivers of ovarian tumor cell adhesion and invasion. This screen identified ROR2 in ovarian tumor cells as critical for these functions. Herein, we show that ROR2 promotes the adhesion of ovarian tumor cells to, and subsequent clearance of, the mesothelial cell monolayer. These behaviors are driven by response to the Wnt5a ligand, but do not appear to involve ROR2 receptor-intrinsic tyrosine kinase signaling. Additionally, we demonstrate that Wnt5a drives directional migration of ovarian cancer cells in a ROR2-dependent manner. Wnt5a polarizes the localization of ROR2 to the leading edge of migrating cells which leads directional migration. Our findings reveal that the Wnt5a/ROR2 signaling pathway drives the directed migration of ovarian tumor cells to the metastatic niche and promotes the early steps of ovarian cancer metastasis. Targeting of this signaling axis may be an effective strategy for blocking the spread of ovarian cancer.
Materials and methods
Antibodies
The antibodies and sources are as listed in Supplementary Table S1
qRTPCR primers
Ror2 primer set 1: forward: ggttgtgcaagagccacga, reverse: ccgttggtagccacacactg
Ror2 primer set 2: forward: aagtggaagattcggaggcaa, reverse: cttcagccaccgcacattg
Gapdh: forward: aggtcggtgtgaacggatttg, reverse: tgtagaccatgtagttgaggtca
Cell Culture
Established ovarian cancer cell lines A2780 (purchased from ATCC), OVCAR3 (purchased from ATCC), OVCAR8 (purchased from National Cancer Institute), and OVCAR5 (National Cancer Institute) were maintained in RPMI Medium (GIBCO) supplemented with 10% heat inactivated fetal bovine serum and 1% penicillin and streptomycin. ES2 cells were maintained in McCoy’s 5A (modified) medium (Life Technologies) supplemented with 10% heat inactivated fetal bovine serum and 1% penicillin and streptomycin. ID8 Trp53−/− BRCA2 −/− GFP/luc cells (from Iain McNeish15), were cultured in DMEM supplemented with 4% heat inactivated fetal bovine serum, 1% penicillin and streptomycin and ITS (5 μg/mL insulin, 5μg/mL transferrin and 5ng/mL sodium selenite).
Cell lines were maintained at 37°C in a 5% CO2 incubator. Mycoplasma testing was also performed using MycoAlert Mycoplasma Detection Kit prior to performing experiments (Lonza).
Primary Ovarian Cancer Cell Culture
Ascites from patients with ovarian cancer (POV) were obtained and plated in a 1:1 ratio in RPMI 20% FBS, 1% pen-strep. After 7–14 days, attached and proliferating cells were passaged and used for experiments. Primary ovarian cancer cells were all obtained from patients with advanced stage, high-grade serous ovarian or fallopian tube cancer. All the patients who participated in this study provided written informed consent for the collection and research use of their materials, and the use of these samples was approved by the Washington University Institutional Review Board (IRB 201309050).
High Throughput Screen Methods
The lentiviral vector pRRL-GFP was used to transduce and label ovarian cancer cell lines with GFP. Following viral transduction, cells were sorted for GFP+ population, and expanded. Primary fibroblasts were cultured from human omentum (NOF) per previously published protocols16. 25k NOFs per well of a 96 well plate was plated with media containing 2.5 μg/mL each of collagen I and fibronectin and incubated for 48 hours. An arrayed small interfering RNA (siRNA, Qiagen) panel targeting genes encoding kinases was used. For each kinase, a pool of 4 unique siRNAs per target is included in the panel. Individual screens were carried out in triplicate of the three GFP-labeled ovarian cancer cell lines: ES2, A2780 and OVCAR8. Following exposure to siRNA for 72 hours, ovarian cancer cells are overlaid upon the mixed sub-mesothelial (NOFs, collagen I, and fibronectin) matrix. 30K cancer cells were added to each well and after 24 hours, washed 3x with PBS and then fluorescence measured. Cell death was controlled for by measuring resazurin dye reduction immediately after GFP fluorescence determination. Controls included on each plate (in at least duplicate) included: NOF only, RNAiMAX (Invitrogen) mock transfection, siRNA negative control (Qiagen), Integrin β1siRNA (known mediator of cell attachment), 10μM Cantharadin (small molecule cell death induction), AllStars Cell Death siRNA (Qiagen). Final fluorescence values were presented as the median of absolute deviation (MAD) relative to non-specific siRNA controls on each plate and the median value of all siRNAs in the library.
Adhesion Assay
Screen method was adapted to 6 well format where NOFs were plated with media containing 2.5 μg/mL each of collagen I and fibronectin and incubated for 48 hours. GFP labeled cells were treated with pooled siRNA targeting gene of interest or negative siRNA control (Dharmacon). After 72 hours, the siRNA treated cells were overlaid on the mixed sub-mesothelial (NOFs, collagen I, and fibronectin) matrix and after 24 hours, washed 3x with PBS and then fluorescence measured.
Plasmids
ROR2 cDNA from pDONR223-ROR2 was purchased from Addgene (plasmid #23927), the ROR2 cDNA was subcloned into pcDNA3.1-myc plasmid (Thermo Fisher). For mutation studies of full-length receptor, overlapping PCR was used to introduce point mutations and then subcloned back into pcDNA3.1. pRRL-GFP plasmid used for GFP labeling of cells was a gift from Sheila Stewart.
For confocal analysis and device localization studies, fluorescent tagged ROR2 was created by subcloning ROR2 cDNA into Emerald-N1 plasmid (Addgene #54588), which introduced an Emerald fluorescent fusion tag on the C-terminus of the protein.
All mutations and cloning were verified by sequencing.
Genetic Knockdown and Overexpression
The following siRNAs were used: siControl-ON-TARGETplus Non-targeting pool (Dharmacon, Lafayette, CO, USA), siROR2-human ON-TARGETplus ROR2 siRNA SMARTpool (Dharmacon, Lafayette, CO, USA), siEphA4-ON-TARGETplus Human EphA4 siRNA SMARTpool (Dharmacon, Lafayette, CO, USA), and siRYK4-ON-TARGETplus Human Ryk4 siRNA SMARTpool (Dharmacon, Lafayette, CO, USA).
See Supplementary Table S2 for shRNAi sequences. A panel of 5 shRNAi for ROR2 in the pLKO vector were purchased from Sigma Aldrich. Infected cells were selected with puromycin (Sigma, St. Louis MO)
For rescue experiments, shROR2 directed at the 3’ UTR (shROR2 #5) was used to allow for expression of rescue constructs.
Two previously validated oligos for GSK-3β shRNA and shSCR control sequence were used17.
For all genetic knockdown and re-expression experiments, cell populations were tested for protein expression levels by immunoblot analysis.
Immunoprecipitation
Cells were lysed with a non-denaturing lysis buffer. Five hundred micrograms of whole-cell lysate, as determined by Bradford analysis (BioRad), was used for immunoprecipitation with anti-c-Myc agarose (Thermo). After overnight incubation, protein was eluted from agarose with SDS sample buffer.
Western blot analyses
Cells were lysed in 1X RIPA buffer supplemented with 1 mM PMSF, 1 mM sodium vanadate, 1 mM sodium fluoride, and 10 ug/ml each aprotinin and leupeptin. Lysates were sonicated twice for 30s and centrifuged at 14,000 RPM, 10 min. the Bradford Assay was used to quantify protein lysates. For Western blot analyses, 50–100μg of protein as determined by Bradford analysis (BioRad), was subjected to reducing SDS/PAGE using standard methods. Blots were probed with indicated antibodies, followed by corresponding horseradish peroxidase-conjugated secondary antibodies. Detection was preformed using SuperSignal Chemiluminescent substrate (Thermo Scientific) on a ChemiDoc 11 XRS+(BioRad). Integrated relative densities of individual bands were quantified using ImageLab software. All quantification was performed under conditions of linear signal response.
Real-time PCR with reverse transcription
The RNAEasy plus mini kit (Qiagen, Hilden, Germany) was used to isolate total cellular RNA, 1 μg of which was used to make cDNA by using the SuperScript IV system (ThermoFisher) according to the manufacturer’s directions. An Applied Biosystems 7500 detection system and SYBR-green master mix (ThermoFisher) were used to perform quantitative RT-PCR. mRNA expression was normalized with respect to glyceraldehyde-3-phosphate dehydrogenase, and fold change was calculated by the 2^(−ΔΔCT) method.
Spheroid-induced mesothelial clearance assay
Mesothelial cells were cultured on 6-well plastic plates (MidSci) and used in the clearance assay once a confluent monolayer was formed (approximately 72 hours). Mesothelial cells were labeled 18 hours prior with CMFDA-green (Molecular Probes), washed with PBS and incubated with fresh culture medium until use. Spheroids were prepared 18 hours in advance. Tumor cells were labeled with CMTPX-red (Molecular Probes), washed with PBS, dissociated by trypsinization and resuspended in culture medium. Labeled cells were then counted and plated at 200 cells/well in ultra-low attachment multiwell plates (Corning) with 10ug/mL of soluble bovine fibronectin for increased cohesion. Spheroids were placed onto the monolayer of mesothelial cells at the microscope and images captured at hourly intervals for 16 hours. Experiment replicated 3 independent times. Normalized clearance value is determined by measuring the total mesothelial cell area cleared by the spheroid in ImageJ and normalizing to the size of the spheroid at time 0. Data presented as normalized clearance relative to SCR control.
Microfluidic Devices
Single cell migration in microfluidic device
ES2 cells were genetically modified and cultured as described above, stained with red membrane dye (CMTPX), and loaded into the middle tissue chamber of a previously published microfluidic device18,19. Briefly, the device generates a stable gradient of Wnt5a across adhered ES2 cells for 24 hours. The ability to form a stable gradient was verified using fluorescent FITC-Dextran (40kDa, 5μg/mL) over 24 hours. A cut line analysis was performed by taking a vertical cross-section of the interrogation chamber (middle) and quantifying FITC-Dextran mean fluorescent intensity (MFI) to compare to the COMSOL model and ensure the device functions as intended (Supplemental Fig. S4b, c).
Cells were cultured for 1 hour within the device at which time Wnt5a (5μg/mL Wnt5a R&D systems) was loaded into the upper fluidic line and base media was delivered through the bottom fluidic line to generate a stable, linear gradient of Wnt5a (Supplemental Fig. S4a, b).
Live-cell time-lapse imaging (Nikon Ti2, 10x or 40x, controlled temperature, humidity and 5% carbon dioxide) was performed by taking images every 20 minutes for a maximum of 20 hours. After imaging, analysis was performed by tracking red membrane signal using NIS-elements analysis software, cell movement and velocity vectors were plotted via rose plots. Displacement between each time point (μm), average velocity (μm/20 min), and instantaneous velocity between each time point (μm/20 min) was quantified.
For single cell ROR2 localization studies, after inducing expression of the ROR2-Emerald fusion protein, images were collected using the same live-cell time-lapse imaging setup as described above. ROR2 was quantified by identifying total green fluorescent intensity within each individual cell area (identified via brightfield). Cell migration vector between the centroids of two time points (20-minute interval) was used to generate a normal bisection of the cell area. The vector was then rotated by 45 degrees to identify the leading quadrant of the migrating cells. Green intensity at the leading quadrant was divided by the total green intensity to identify the change in Emerald ROR2 at the leading edge.
Immunofluorescence
Glass coverslips were coated with fibronectin (1μg/mL in DI water) for 1 hr at room temperature, followed by washing in PBS and UV treatment for 20min.
Cells were transfected with ROR2-Emerald fluorescent tagged protein using Transit LT1 transfection reagent (Mirius). 48hr after transfection, cells were serum starved overnight and the next morning they were then sparsely plated (1 × 10⁴ per coverslip) and allowed to adhere and spread for 4 hours on glass coverslip coated with fibronectin in the presence or absence of Wnt5a. After rinsing with PBS, cells were then fixed in 4% paraformaldehyde for 15 min at room temperature. Cells were washed again with PBS. Coverslips were mounted in Vectashield with DAPI mounting medium. Cells were imaged by confocal microscopy on NIS-Elements software (Nikon Ti2). Z-stacks were taken with a step size of 0.2 um with a 40X objective. For each slice within the Z-stack, the edge of the cells was identified by using GFP signal above background in ImageJ. Briefly, background was subtracted using a rolling ball correction (25 μm), GFP signal threshold was used to create an outline of the cell to identify total area of the cell. The same threshold was then eroded 0.54 μm to create a second outline defined as the inner portion of the cell. Subtracting these two outline results in only the edge. GFP was quantified along the edge of the cell region and within the total area of the cell.
CRISPR
The mROr2 KO lines were created by the Genome Engineering & Stem Cell Center (GESC@MGI) at Washington University in St. Louis. Briefly, synthetic gRNA targeting the sequence, 5’-AGCGCGCACAAGCGATCCCTNGG, was purchased from IDT, complexed with Cas9 recombinant protein, and then transfected into ID8 Trp53−/−; Brca2−/− cells. The transfected cells were then single cell sorted into 96-well plates, and single cell clones were identified using NGS to analyze the out-of-frame indels for knock-out.
Proliferation assay
Cells were seeded at 5 x10³ cells per well in triplicate in 24 well plates in 500μL growth medium on day 0. Cells were trypsinized, resuspended in a total volume of 500μL of medium and counted with a hemacytometer at the intervals shown.
Syngeneic Model of Ovarian Cancer
All procedures involving animals and their care were performed in accordance with the guidelines of the American Association for Accreditation for Laboratory Animal Care and the U.S. Public Health Service Policy on Human Care and Use of Laboratory Animals. All animal studies were also approved and supervised by the Washington University Institutional Animal Care and Use Committee in accordance with the Animal Welfare Act, the Guide for the Care and Use of Laboratory Animals and NIH guidelines (Protocol 19-1042). Mice were injected with either control ID8 Trp53−/−; Brca2−/− cells or ID8 Trp53−/−; Brca2−/− Ror2 −/− cells as described above. Cells were injected intraperitoneally (i.p.) with 5×10⁶ cells in 0.5 ml of PBS into female 8-week-old (n=5 per group) C57bl6 (Jackson labs). BLI imaging was used to follow tumor growth at the time points indicated. For all BLI, mice were anaesthetized with isoflurane and imaged using the IVIS 100 bioluminescent imaging system (Perkin Elmer) following an intraperitoneal injection of d-luciferin (150 mg/kg).
Mice were monitored for adverse events and sacrificed with CO2 exposure at 60 days after i.p. injection. Necropsy with tumor burden assessment was performed by a blinded investigator. At the completion of each experiment, aggregate tumor weight and location were recorded for each group.
Statistical Analysis
Statistical analysis was performed utilizing Prism 9.5.1. Figures are presented as mean +/− standard error of the mean. Microfluidic device assays were measured using two-tailed unpaired t-test. For remainder of figures, p-values were calculated using either Student’s unpaired, two-tailed t-test or ANOVA as noted in figure legends. P-values below 0.05 were considered significant. All data was generated from at least three independent experiments.
Data Availability
The data generated in this study are available within the article and its supplementary data files.
Results
A cellular screen to identify ovarian tumor cell-intrinsic regulators of adhesion and invasion
To identify biologically relevant molecules and signaling pathways present in ovarian tumor cells and important for ovarian tumor cell adhesion and invasion, we developed a functional cellular assay amenable to high throughput genetic screening. To recapitulate the ovarian tumor environment (TME) we made use of a mixed “sub-mesothelial” matrix that consisted of primary human omental fibroblasts (NOFs) plated with collagen I and fibronectin; two ECM proteins particularly prevalent in the sub-mesothelial omental environment and important for ovarian cancer metastasis2,7,8. To this matrix various human ovarian tumor cell lines, that stably expressed GFP, were allowed to attach. After washing, remaining bound GFP fluorescence was determined and used as a measure of tumor cell adhesion (Fig 1a).
Figure 1.
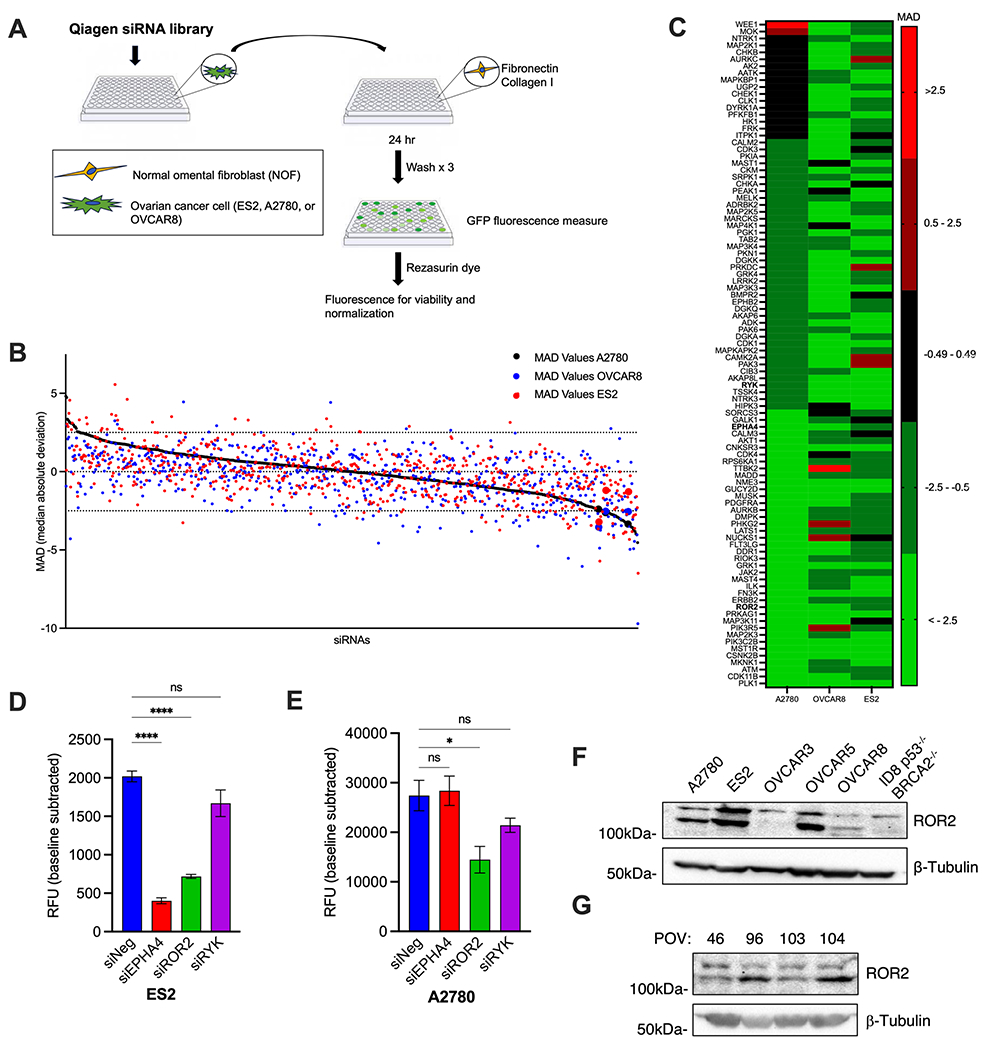
A. Schematic diagram of siRNA screen
B. A multicellular human kinome RNAi screen (Qiagen) for proteins that influence ovarian cancer adhesion, as described in materials and methods. Individual RNAi values are presented as Median Average Deviation (MAD) fluorescence from the median of the complete library and non-specific siRNA controls on each plate. Values for A2780 (black circles), OVCAR8 (blue circles), ES2 (red circles) cells are plotted. Data points of chosen candidates for study enlarged for emphasis. The RNAi library results represent triplicate average for each RNAi. The black broken lines identify ±2.5 MAD
C. Heat map of top candidates from the screen (defined as MAD ≤ −2.5 in any cell line). Candidates chosen for further study denoted in bold.
D,E: Cell adhesion assay. Normal omental fibroblasts (NOFs) were plated with media containing collagen I and fibronectin and incubated for 48 hours. GFP labeled ES2 (D) or A2780 cells (E) were siRNA depleted of indicated proteins and then overlaid on the mixed submesothelial (NOFs,collagen I, and fibronectin) matrix and fluorescence measured. Data presented as RFU (relative fluorescence units). One-way ANOVA. ns, not significant, *p<0.05, ****p<0.0001
F. Western blot of a panel of established ovarian cancer cell lines for expression of ROR2
G. Western blot of patient derived primary ovarian tumor (POV) cells for expression of ROR2
We then performed a selective siRNA genetic screen for the contribution of ovarian tumor cell protein kinases to adhesion to this sub-mesothelial matrix. An arrayed small interfering RNA (siRNA) library (Qiagen) that targeted 658 genes encoding protein kinases was used. In this library there were 4 different siRNAs pooled per target. Individual screens were carried out in triplicate with each of three GFP-labeled human ovarian tumor cell lines: ES2, A2780 and OVCAR8. Cell death was controlled for by measuring resazurin dye reduction immediately after GFP fluorescence determination and GFP fluorescent values were normalized to viable cell number (Fig 1a). Final fluorescence values were presented as the median of absolute deviation (MAD) relative to non-specific siRNA controls present on each plate, and the median value of all siRNAs in the library (Fig. 1b and c; Supplementary Tables S3 and S4). siRNA depleted targets that increased adhesion +2.5 from the median were considered potential negative regulators of adhesion while siRNA depleted targets that decreased adhesion −2.5 from the median were considered potential positive regulators of adhesion. To be considered for further evaluation, concordant results in at least 2 of the 3 cell lines were required. Twenty nine of the 658 genes screened met these criteria (Supplementary Table S3). We chose three for further study: receptor tyrosine kinase like orphan receptor 2 (ROR2), receptor-like tyrosine kinase (RYK), and EPH receptor A4 (EPHA4). All were putative positive regulators of adhesion, there is a paucity of existing literature implicating them in ovarian cancer biology, and all were cell surface proteins making them good candidates for potential therapeutic intervention.
Confirmatory adhesion assays with new siRNA oligonucleotides (different from those present in the library) were done for all three candidates in ES2, A2780, and OVCAR8 ovarian tumor cell lines. Of the three candidates, only ROR2 siRNAs inhibited adhesion in all cell lines (Fig. 1d, e; Supplementary Fig. S1a–d). Western blot analyses of five human and one mouse ovarian tumor cell lines revealed ROR2 expression in all, at variable levels (Fig. 1f). We also analyzed four primary human ovarian cancer (POV) samples derived from abdominal ascites of patients with advanced stage, high grade ovarian cancer. All expressed ROR2 (Fig. 1g). We therefore chose ROR2 for further study.
The presence of ROR2 in ovarian tumor cells promotes mesothelial cell clearance
Ovarian tumor spheroids, after detaching from sites of primary development, spread (metastasize) to the abdominal omentum and peritoneum. To do so they must first adhere to and then clear the mesothelial monolayer lining these structures for successful attachment to the sub-mesothelial matrix2. We therefore asked whether the presence of ROR2 in ovarian tumor cells impacted mesothelial cell clearance. Using a previously reported ovarian tumor spheroid mesothelial cell clearance assay3, we utilized 3 ovarian tumor cell lines that readily clear a mesothelial (Human Peritoneal Mesothelial Cells (HPMC)) monolayer: ES2, OVCAR3, and OVCAR8. Compared to control tumor spheroids, siRNA-mediated depletion of ROR2 in all three ovarian tumor cell lines reduced mesothelial cell clearance ability (Fig. 2a–d; Supplementary Fig. S1e, S2a, b). As HPMCs are primary cells derived from a single patient, this result was confirmed with an additional HPMC line (Supplementary Fig. S2c, d). These results indicated that the presence of ROR2 in ovarian tumor cells promoted their capacity to adhere to and clear a mesothelial cell monolayer, a key step in ovarian cancer metastatic colonization.
Figure 2.

A. Representative images of ES2 ovarian cancer spheroids treated with either negative control or siRNA targeting ROR2 labeled with CMTPX dye (red) were added to a confluent monolayer of primary mesothelial cells that were labeled with CMFDA dye (green) and monitored over 8 hours. Images show representative mesothelial clearance at 0 and 8 hours. White dashed line outlines cleared area.
B-D. Quantification of clearance experiments experiment described in A for ES2 (B), OVCAR3 (C), and OVCAR8 (D) cell lines. n>5 spheroids averaged per condition. Data presented as cleared area normalized to initial spheroid size, relative to siNeg control. arbitrary units (AU). Error bars denote SEM. *p<0.05, **p<0.01, ****p<0.0001, upaired student’s t-test.
Tyrosine kinase function of ROR2 in tumor cells is not required for mesothelial cell clearance
ROR2 is a receptor tyrosine kinase of the receptor tyrosine kinase orphan receptor (ROR) family and a Wnt co-receptor9. There are conflicting reports as to whether Wnt signals induce ROR2 intrinsic Tyr phosphorylation, versus Ser/Thr phosphorylation by cytoplasmic protein kinases, as a means of initiating downstream intracellular signal transduction20. To distinguish between these two possibilities in the process of mesothelial cell clearance by ovarian tumor cells , we generated mutant ROR2 isoforms that; (a) are inhibited in tyrosine kinase activation by substituting a critical lysine in the ATP binding kinase domain (ROR2K507A), or (b) cannot be serine phosphorylated at S864, a site proposed to be phosphorylated by GSK3β and required for non-canonical receptor activation by Wnt5a (ROR2S864A)20 (Supplementary Fig. S3a). Endogenous ROR2 was depleted from ES2 cells using lentiviruses expressing ROR2 shRNA that targeted the 3’ UTR of ROR2. The mutant ROR2 (Myc-tagged) isoforms, as well as wild type (WT) ROR2, were then re-expressed in these shRNA-depleted ES2 cells (Supplementary Fig. S3b). WT ROR2 re-expression rescued mesothelial clearance (Fig. 3a, quantified in b). When ROR2-depleted ES2 tumor cells were rescued with ROR2K507A, mesothelial cell clearance ability was also restored, however, when rescued with ROR2S864A mesothelial cell clearance remained impaired (Fig. 3a, quantified in b).
Figure 3.
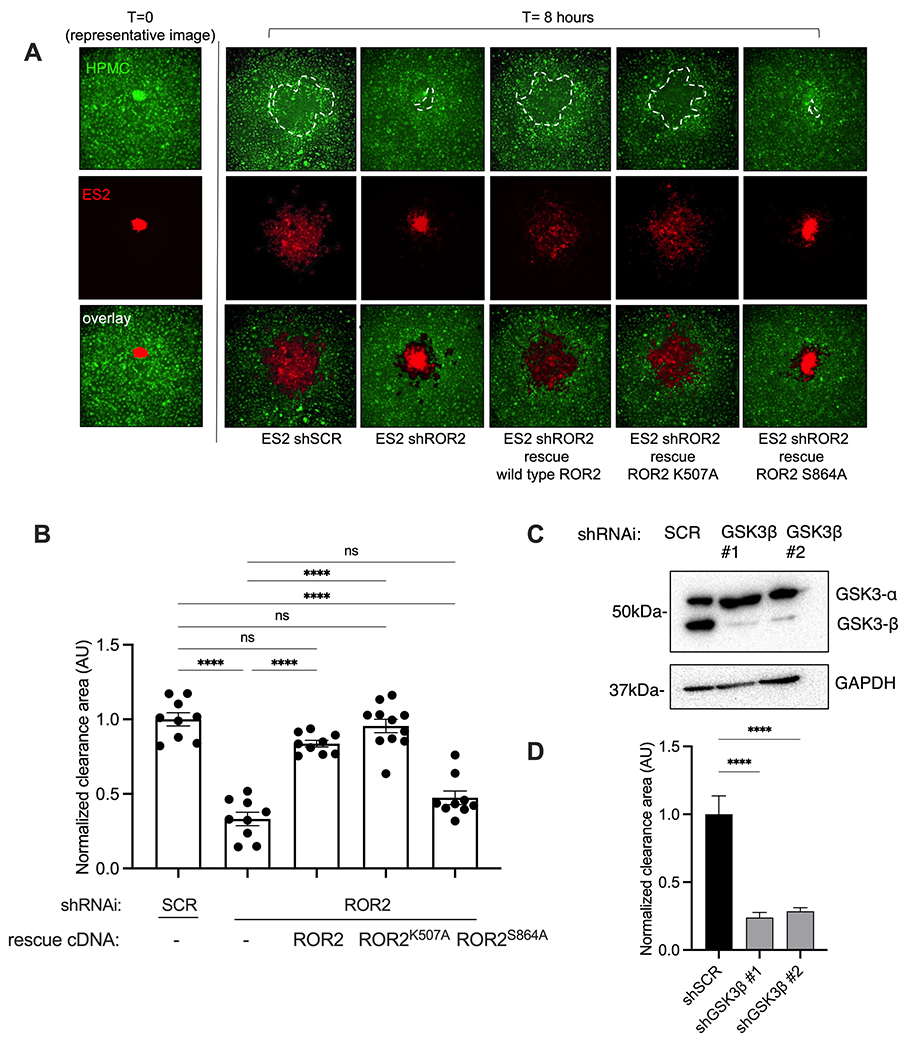
A. Representative images of clearance assay. ES2 shSCR, shROR2, or shROR2 rescued with indicated ROR2 constructs. Spheroids labeled with CMTPX dye (red) added to a confluent monolayer of primary mesothelial cells that were labeled with CMFDA dye (green) and monitored over 8 hours. Images show representative mesothelial clearance at 0 and 8 hours. White dashed line outlines cleared area.
B. Quantification of clearance experiments experiment described in A. Data presented as cleared area normalized to initial spheroid size, relative to shSCR control. Arbitrary units (AU) n>5 spheroids averaged per condition. Error bars denote SEM. ns, not significant. ****p<0.0001, One-way ANOVA
C. Western blot of ES2 ovarian cancer cell lines were transduced with lentivirus expressing the indicated shRNAi. Western blotting preformed using the indicated antibodies.
D. Quantification of clearance experiments of shSCR or shGSK3B cells (images Supp Fig S3C)). n>5 spheroids averaged per condition. Error bars denote SEM. ****p<0.0001, One-way ANOVA
Since S864 is proposed to be phosphorylated by GSK3β, in response to Wnt5a, and this activates the ROR2 receptor, we asked whether GSK3β was required for mesothelial cell clearance by ovarian tumor cells. GSK3β was shRNAi depleted from ES2 cells using previously validated shRNA hairpin sequence17 (Fig 3c). Like shROR2 and ROR2S864A expressing cells, mesothelial clearance by ES2 shGSK3β cells were severely impaired (Fig. 3d and Supplementary Fig. S3c), supporting a role for S864 phosphorylation of ROR2 as important for ovarian tumor cell clearance of mesothelial cells.
Taken together, these results suggested ROR2 serine phosphorylation (S864) by GSK3β in ovarian tumor cells was required to support ovarian tumor cell mediated mesothelial cell clearance.
Mesothelial cell-derived Wnt5a promotes ovarian tumor cell-mediated mesothelial cell clearance in a ROR2-dependent manner
ROR2 is most closely linked to non-canonical Wnt signaling through its interaction with the prototypical ligand Wnt5a9. Wnt5a is present at high levels in ovarian cancer ascites, the production of which is derived from cells within the tumor microenvironment (adipocytes, mesothelial cells), rather than the tumor cells themselves14. To determine if a Wnt5a-ROR2 signaling axis was important for mesothelial cell clearance by ovarian tumor cells, we siRNA depleted ovarian tumor cell ROR2 and mesothelial cell (HPMC) Wnt5a (Fig 4a), in various combinations, and measured the ability of ovarian tumor cells to clear a mesothelial cell monolayer. Depletion of Wnt5a in HPMCs significantly reduced clearance ability of wild type ES2 cells (Fig. 4b, quantified in c). Similarly, depletion of ROR2 in ES2 tumor cells reduced clearance of wild type HPMCs (Fig. 4b, quantified in c). When both were depleted, respectively: ES2 siROR2, HPMC siWnt5a, there was no additive reduction in the mesothelial clearance (Fig. 4b, quantified in c).
Figure 4.

A. Western blot of HPMC cells (left) or ES2 cells (right) treated with siRNA targeting ROR2, Wnt5a, or negative control as indicated
B. Representative images of clearance assay performed with: ES2 ovarian cancer spheroids treated with either negative control, siRNA targeting ROR2, HPMC either treated with negative control or siRNA targeting WNT5a. Ovarian cancer spheriods labeled with CMTPX dye (red) were added to a confluent monolayer of primary mesothelial cells that were labeled with CMFDA dye (green) and monitored over 8 hours. Images show representative mesothelial clearance at 8 hours.
C. Quantification of clearance experiment described in B. Data presented as cleared area normalized to initial spheroid size, relative to siNeg/siNeg control. arbitrary units (AU). n>5 spheroids averaged per condition. Error bars denote SEM. ****p<0.0001, One way ANOVA.
D. Quantification of clearance experiments where ES2 ovarian cancer spheroids plated on HPMC either treated with negative control or siRNA targeting WNT5a in the presence or absence of additional recombinant Wnt5a (200ng/mL). Ovarian cancer spheriods labeled with CMTPX dye (red) were added to a confluent monolayer of primary mesothelial cells that were labeled with CMFDA dye (green) and monitored over 8 hours. (Images in Suppl Fig 3D). Data presented as cleared area normalized to initial spheroid size, relative to HPMC siNeg control. arbitrary units (AU). n>5 spheroids averaged per condition. Error bars denote SEM. ****p<0.0001, One way ANOVA.
We next asked whether addition of recombinant Wnt5a could rescue the defective clearance phenotype of HPMCs depleted of Wnt5a. We again siRNA depleted Wnt5a in HPMCs and confirmed reduced clearance ability by ovarian tumor cells (Fig. 4d, Supplementary Fig. S3d). When recombinant Wnt5a was added to siWnt5a depleted HMPCs, the clearance ability of ovarian cancer cells was restored to levels comparable to HPMC siNeg cells (Fig. 4d, Supplementary Fig. S3d). Interestingly, when recombinant Wnt5a was added to HPMC siNeg cells, no additional clearance ability was conferred, potentially indicating a threshold for Wnt5a mediated clearance ability in this model (Fig. 4d, Supplementary Fig. S3d).
In sum, these data suggested that the presence of ROR2 in ovarian tumor cells promoted mesothelial clearance in response to Wnt5a produced by the mesothelial cells14.
Wnt5a signals polarize ROR2 and influence directional movement of ovarian cancer cells, in a ROR2-dependent manner
Given that intraperitoneal spread of ovarian cancer cells via ascitic fluid represents a unique mode of metastasis among epithelial tumors, we hypothesized that Wnt5a, secreted by cells of the tumor microenvironment, may serve as a directional cue for migrating tumor cells to home to this metastatic niche. To test this possibility, we engineered a microfluidic (MF) device that allowed for the generation of a stable Wnt5a chemical signaling gradient and the capacity to track cell movement in 3D via live cell video imaging in real time (Supplementary Fig. S4 a and b). Using fluorescent dextran that approximates the molecular weight of Wnt5a, we validated that the MF device was indeed capable of creating a stable gradient (Supplementary Fig. S4c). After validation, the MF device was then used to establish a Wnt5a gradient, and ES2 ovarian tumor cells were then introduced into the central chamber of the MF device and exposed to the Wnt5a gradient. In this experimental setup, control tumor cells moved preferentially towards higher levels of Wnt5a, as determined by directional displacement (Fig. 5a, b and Supplementary Fig. S4d), and exhibited increased mean and instantaneous velocity in response to Wnt5a (Fig. 5b). When tumor cells were depleted of ROR2, directional displacement in the Wnt5a gradient was decreased (Fig. 5a and c; Supplementary Fig. 4d). Mean, median, and instantaneous velocity of cellular migration were also decreased upon ROR2 depletion (Fig. 5c).
Figure 5.

A. ES2 cells (control, siNeg, or siROR2 +/− Wnt5a gradient) were loaded into the middle chamber of the gradient generating device and allowed to adhere to surface. Single cell migration was tracked over 20 hours at 20 minute intervals and then plotted in the X and Y planes per device. 5μg/mL Wnt5a was loaded into the upper fluidic line and a gradient is generated across the y-axis. n>20 cells per device, 3 devices, a random selection of representative cells from each device was shown.
B. Single cell displacement (μm), mean velocity across 20 hours (μm/20 min), and instantaneous velocity across each time point (μm/20 min) of ES2 cells +/− Wnt5a gradient. n>20 cells per device, 3 devices, unpaired t-test shows significance (***, p<0.0005; ****, p<0.0001).
C. Single cell displacement (μm), mean velocity across 20 hours (μm/20 min), and instantaneous velocity across each time point (μm/20 min) of ES2 siNeg and siROR2 under the presence of a Wnt5a gradient. n>20 cells per device, 3 devices, unpaired t-test shows significance (*, p<0.05; **, p<0.005; ****, p<0.0001).
These results suggested that ovarian tumor cells migrate preferentially towards areas of high Wnt5a concentration, in a ROR2-dependent manner.
Non-canonical Wnt signals can polarize cell migration through asymmetric segregation of proteins within a plane orthogonal to the apical-basal axis, often referred to as the “leading” and “trailing” edge of the cell10,21. Therefore, we asked whether ROR2 polarized in ovarian tumor cells in response to a Wnt5a gradient. ES2 cells were engineered to express a ROR2 isoform with an Emerald C-terminal fusion (ES2.ROR2-Em). In the absence of Wnt5a, ROR2-Em was diffusely located throughout the cell (Fig. 6a). When cells were placed in media with uniformly distributed Wnt5a (i.e., no gradient), ROR2-Em localized to the periphery of the cell in a uniform manner (Fig. 6a, b). When ES2.ROR2-Em cells were placed in the MF device and exposed to a Wnt5a gradient for 8h, cells preferentially migrated towards high Wnt5a, as anticipated, and ROR2-Em preferentially localized to the cell surface in the direction of migration (i.e., polarizes to the leading edge) (Fig. 6c–e).
Figure 6.

A. Representative confocal slices. ES2 cells expressing ROR2-Emerald (green) on fibronectin coated glass +/− uniform Wnt5a signal. DAPI costain (blue).
B. Quantification of ratio of ROR2-Emerald (images in A) located on periphery of cell as as compared to total from confocal images. Integrated fluorescence intensity (relative fluorescence units (RFU)),n=90 per condition, student’s unpaired t-test, ****p<0.00001
C. ES2 cells expressing ROR2-Emerald loaded into middle chamber of gradient generating device and allowed to adhere to surface. Single cell migration tracked over 20 hours at 20 minute intervals, 40x magnification. Cell area quantified using brightfield imaging (white outline) and then bisected perpendicular to the movement vector. Representative images shown. White arrows represent areas of focal ROR2 intensity.
D,E. ROR2-Emerald (Green) intensity within leading quadrant of the cell was quantified and divided by the total green intensity within the cell to identify changes in ROR2 localization. Schematic of quantification shown in D, data quantified in E. ROR2 distribution within cell was quantified for cells that experience no gradient and those experiencing Wnt5a gradient (max concentration 5μg/mL). n>6 cells per device, 3 devices, unpaired t-test per time point (*, p<0.05; **, p<0.005).
These results indicated that under the influence of Wnt5a, ovarian tumor cell ROR2 polarizes to the leading edge (i.e., the direction of migration) of migrating ovarian tumor cells. This induced polarization could then serve to direct migration towards areas of high Wnt5a (e.g., mesothelial cells).
ROR2 is critical for ovarian tumor metastasis in vivo
To determine whether ovarian tumor cell ROR2 influenced ovarian cancer cell metastasis in vivo, we turned to a syngeneic murine model of ovarian cancer using the ID8 Trp53−/−; Brca2−/− GFP/luciferase (ID8) cell line15. CRISPR/Cas9 gene editing was used to generate derivatives of the ID8 cell line with deletions in the ROR2 gene (Supplementary Fig. S5a). Two clones were selected and ROR2 depletion confirmed (Fig. 7a; Supplementary Figs. S5b and c, S6a). We confirmed that ROR2−/− clones were impaired in mouse peritoneal mesothelial cell monolayer clearance (Fig. 7b; Supplementary Fig. S6b). In proliferation assays, there was no significant difference in proliferation between ID8 cells and ROR2−/− clones (Supplementary Fig S6c)
Figure 7.

A. qRT-PCR determination of mRNA levels for Ror2 in clones following CRISPR/Cas9 mediated Ror2 knockout. Cells were analyzed using two individual primer pairs directed at ROR2 (primer pair 1 darker columns, primer pair 2 lighter columns) and normalized to GAPDH control. Means and SEM are representative data from three independent experiments; triplicate wells of cells were analyzed in each experiment, One way ANOVA, **** p<0.0001.
B. Quantification of ID8 clearance experiments (images Supp Fig S6) of ID8 p53−/−;BRCA2−/− GFP/luc (ID8 control, blue, ID8 p53−/−;BRCA2−/− ROR2 −/− clone 3E3 GFP/luc (ID8 ROR2−/− clone 1, red) or ID8 p53−/−;BRCA2−/− ROR2 −/− clone 4F2 GFP/luc (ID8 ROR2 −/− clone 2, green). Data presented as cleared area normalized to initial spheroid size, relative to ID8 control. arbitrary units (AU). n>5 spheroids averaged per condition. Error bars denote SEM. **p<0.005, one-way ANOVA
C. End point total tumor burden of mice (ID8 control, blue, ID8 ROR2−/− clone 1, red, ID8 ROR2 −/− clone 2, green) at 60 days. Total tumor burden in the peritoneal cavity quantified (weight in grams) and normalized to average ID8 control tumor burden. n = 5 mice for each group. Mean ± SEM, ****P < 0.0001, ***P < 0.001, one-way ANOVA.
D. Tumor burden in mice from C. stratified by tissue analyzed (omentum, bowel mesentery, ovaries (ID8 control, blue, ID8 ROR2−/− clone 1, red, ID8 ROR2 −/− clone 2, green). n = 5 mice for each group. Mean ± SEM, **P < 0.001, **P < 0.005, one-way ANOVA.
E. Representative bioluminescent images of c57/bl6 mice injected IP with 5×10⁶ cells (ID8 control, ID8 ROR2−/− clone 1or ID8 ROR2 −/− clone 2) at day 0 and day 42 post injection. Tumor burden was assessed via bioluminescent imaging every 14 days post injection from day 0-42 in the entire peritoneal cavity.
Control ID8 cells or ID8 ROR2−/− cells (clones 1 & 2) were then injected intraperitoneally into syngeneic C57BL/6 mice. Tumor burden was followed longitudinally with bioluminescence imaging (BLI) until day 42. At end point (60 days), mice were sacrificed, and tumor burden assessed by measuring tumor weight in omentum, mesentery, and ovaries. For both ROR2−/− ovarian tumor cell clones, injected mice had less tumor burden as assessed by both BLI and end point tumor weight (Fig. 7c–e, Supplementary Fig. S6d). Given the equivalent proliferation profiles of these cells in vitro, these results suggested that the presence of ROR2 in ovarian tumor cells was critical for the efficient establishment of ovarian tumor metastasis in vivo.
Discussion
A previously published study highlighted increased ROR2 expression in patient derived epithelial ovarian cancer specimen as compared to benign controls12, the functional consequences of which were not extensively studied. In an unbiased functional genetic screen, we identified ROR2 as a regulator of ovarian tumor cells attachment to and invasion of the mesothelium. We elucidate the potential functional consequences of ROR2 expression in ovarian tumor cells. In response to Wnt5a, likely secreted by abdominal mesothelial and adipocyte cells14, ovarian tumor cells migrate towards Wnt5a, adhere to and clear the mesothelial cell layer—all in a ROR2-dependent manner.
During formation of the primary tumor, others have shown that Wnt5a is upregulated in the putative tumor microenvironment14. Once tumor cells exfoliate from sites of primary growth, Wnt5a could serve to asymmetrically localize ROR2 in ovarian tumor cells to their leading edge and direct migration of ovarian tumor cells to these high Wnt5a areas. Upon reaching secondary sites, ROR2 within the tumor spheroids would promote the mesothelial cell clearance necessary to gain access to the sub-mesothelial matrix. Of note, this clearance process does not appear to be dependent on the intrinsic tyrosine kinase function of ROR2 but could involve GSK3β-mediated S864 phosphorylation. Functionally, the presence of ROR2 in ovarian tumors cells impacted disease progression and metastasis in vivo.
The role of the ROR2 tyrosine kinase domain in non-canonical Wnt signaling is controversial22. Herein we demonstrate that tyrosine kinase domain function is dispensable for ROR2-mediated mesothelial cell clearance by ovarian tumor cells. Rather, we find that Ser 864, a site predicted to be phosphorylated by GSK3β, appears to be crucial for the pro-metastatic behaviors conferred by ROR2. Precisely which signals activate GSK3b and what ROR2-downstream signaling pathways are required for these functions remain to be determined.
One intriguing possibility is that phosphorylation of ROR2 allows for the coupling of the receptor to other PCP components. ROR2 has been shown to complex with well-known members of the PCP pathway such as FZD723 and Vangl210,21,24. A potential role of ROR2 as a necessary co-receptor to mediate these pathways and their contribution in ovarian cancer warrants further study. We found that in response to Wnt5a, ROR2 asymmetrically localizes to the leading edges of migrating tumor cells. It remains to be determined how this asymmetric localization of ROR2 mediates its migratory phenotype. PCP components and non-canonical Wnt signaling are known to reorganize the actomyosin cytoskeleton and promote cell migration11,24. Previous reports have demonstrated that ROR2 action can reorient the microtubule organizing center and actin cytoskeleton25,26. Given that rearrangements of microtubule and actin cytoskeletons25,26 are necessary for directional migration, and that these events can occur locally, ROR2 may serve similar roles in migrating ovarian cancer cells. Additionally, both cell migration and mesothelial cell clearance by ovarian cancer cells are force dependent processes2,27,28, and it is possible that ROR2 mediated signals and function contribute to mechanotransduction regulation in ovarian tumor cells.
While the influence of Wnt5a on cancer cell motility has been described, the notion that Wnt5a may be serving as a chemotactic cue has not been described and could contribute to ovarian tumor cell homing to the mesothelial cell lined metastatic niches of the omentum, bowel, and peritoneum. Increase in expression of Wnt5a in these sites has previously been demonstrated14. We propose that, although Wnt5a is present in bulk ascites, as tumor cells or tumor cell clusters come into closer proximity to the mesothelial cell surface, an increased local gradient of mesothelial secreted factors, such as Wnt5a, likely exists, and drives directed tumor cell migration.
In conclusion, ROR2 expression in ovarian cancer cells serves to drive directed cell migration in response to Wnt5a secreted by the ovarian tumor microenvironment. ROR2 action in ovarian cancer cells also promotes mesothelial cell clearance and adhesion to a sub-mesothelial matrix, all critical steps in successful metastatic colonization by ovarian cancer cells. Clinical trials studying ROR2 directed therapies in the setting of various malignancies are currently underway29, and our data suggests that therapeutic targeting of the ROR2/Wnt5a signaling axis in advanced ovarian cancer could provide a means of improving treatment or prevention of disease progression in these patients.
Supplementary Material
Implications.
This study demonstrates that ROR2 in ovarian cancer cells is important for directed migration to the metastatic niche and provides a potential signaling axis of interest for therapeutic targeting in ovarian cancer.
Acknowledgements:
We thank GESC@MGI at Washington University in St. Louis for creating the mROR2 KO ID8 lines. We thank the High Throughput Screening Center at Washington University in St. Louis for assistance with the siRNA screen. This project was funded in part by the Washington University Ovarian Cancer Research Innovation Fund (W. Grither, K. Fuh), the Foundation for Women’s Cancer SLOCA award (K. Fuh), NIH R01:CA234553 (K. Fuh). This project was funded in part by the Alvin J. Siteman Cancer Center, Barnes-Jewish Hospital and the Washington University Institute of Clinical and Translational Sciences, which is, in part supported by an NCATS Clinical and Translational Sciences Award, #UL1TR002345. The Siteman Cancer Center is supported in part by an NCI Cancer Center Support Grant #P30CA091842.
Footnotes
Conflict of Interest: G. Longmore receives funding from Centene Corporation, St. Louis MO.
References
- 1.Yeung TL, Leung CS, Yip KP, Au Yeung CL, Wong ST, Mok SC. Cellular and molecular processes in ovarian cancer metastasis. A Review in the Theme: Cell and Molecular Processes in Cancer Metastasis. Am J Physiol Cell Physiol. Oct 01 2015;309(7):C444–56. doi: 10.1152/ajpcell.00188.2015 [DOI] [PMC free article] [PubMed] [Google Scholar]
- 2.Iwanicki MP, Davidowitz RA, Ng MR, et al. Ovarian cancer spheroids use myosin-generated force to clear the mesothelium. Cancer Discov. Jul 2011;1(2):144–57. doi: 10.1158/2159-8274.CD-11-0010 [DOI] [PMC free article] [PubMed] [Google Scholar]
- 3.Davidowitz RA, Iwanicki MP, Brugge JS. In vitro mesothelial clearance assay that models the early steps of ovarian cancer metastasis. Journal of visualized experiments : JoVE. Feb 17 2012;(60)doi: 10.3791/3888 [DOI] [PMC free article] [PubMed] [Google Scholar]
- 4.Dhaliwal D, Shepherd TG. Molecular and cellular mechanisms controlling integrin-mediated cell adhesion and tumor progression in ovarian cancer metastasis: a review. Clinical & experimental metastasis. Apr 2022;39(2):291–301. doi: 10.1007/s10585-021-10136-5 [DOI] [PMC free article] [PubMed] [Google Scholar]
- 5.Ahmed N, Stenvers KL. Getting to know ovarian cancer ascites: opportunities for targeted therapy-based translational research. Frontiers in oncology. Sep 25 2013;3:256. doi: 10.3389/fonc.2013.00256 [DOI] [PMC free article] [PubMed] [Google Scholar]
- 6.Lengyel E. Ovarian cancer development and metastasis. Am J Pathol. Sep 2010;177(3):1053–64. doi: 10.2353/ajpath.2010.100105 [DOI] [PMC free article] [PubMed] [Google Scholar]
- 7.Kenny HA, Kaur S, Coussens LM, Lengyel E. The initial steps of ovarian cancer cell metastasis are mediated by MMP-2 cleavage of vitronectin and fibronectin. The Journal of clinical investigation. Apr 2008;118(4):1367–79. doi: 10.1172/JCI33775 [DOI] [PMC free article] [PubMed] [Google Scholar]
- 8.Grither WR, Divine LM, Meller EH, et al. TWIST1 induces expression of discoidin domain receptor 2 to promote ovarian cancer metastasis. Oncogene. Mar 2018;37(13):1714–1729. doi: 10.1038/s41388-017-0043-9 [DOI] [PMC free article] [PubMed] [Google Scholar]
- 9.Debebe Z, Rathmell WK. Ror2 as a therapeutic target in cancer. Pharmacol Ther. Jun 2015;150:143–8. doi: 10.1016/j.pharmthera.2015.01.010 [DOI] [PMC free article] [PubMed] [Google Scholar]
- 10.Gao B, Song H, Bishop K, et al. Wnt signaling gradients establish planar cell polarity by inducing Vangl2 phosphorylation through Ror2. Dev Cell. Feb 15 2011;20(2):163–76. doi: 10.1016/j.devcel.2011.01.001 [DOI] [PMC free article] [PubMed] [Google Scholar]
- 11.VanderVorst K, Dreyer CA, Konopelski SE, Lee H, Ho HH, Carraway KL 3rd. Wnt/PCP Signaling Contribution to Carcinoma Collective Cell Migration and Metastasis. Cancer Res. Apr 15 2019;79(8):1719–1729. doi: 10.1158/0008-5472.CAN-18-2757 [DOI] [PMC free article] [PubMed] [Google Scholar]
- 12.Henry C, Llamosas E, Knipprath-Meszaros A, et al. Targeting the ROR1 and ROR2 receptors in epithelial ovarian cancer inhibits cell migration and invasion. Oncotarget. Nov 24 2015;6(37):40310–26. doi: 10.18632/oncotarget.5643 [DOI] [PMC free article] [PubMed] [Google Scholar]
- 13.Veskimae K, Scaravilli M, Niininen W, et al. Expression Analysis of Platinum Sensitive and Resistant Epithelial Ovarian Cancer Patient Samples Reveals New Candidates for Targeted Therapies. Transl Oncol. Oct 2018;11(5):1160–1170. doi: 10.1016/j.tranon.2018.07.010 [DOI] [PMC free article] [PubMed] [Google Scholar]
- 14.Asem M, Young AM, Oyama C, et al. Host Wnt5a Potentiates Microenvironmental Regulation of Ovarian Cancer Metastasis. Cancer Res. Mar 1 2020;80(5):1156–1170. doi: 10.1158/0008-5472.CAN-19-1601 [DOI] [PMC free article] [PubMed] [Google Scholar]
- 15.Walton J, Blagih J, Ennis D, et al. CRISPR/Cas9-Mediated Trp53 and Brca2 Knockout to Generate Improved Murine Models of Ovarian High-Grade Serous Carcinoma. Cancer research. Oct 15 2016;76(20):6118–6129. doi: 10.1158/0008-5472.CAN-16-1272 [DOI] [PMC free article] [PubMed] [Google Scholar]
- 16.Kenny HA, Krausz T, Yamada SD, Lengyel E. Use of a novel 3D culture model to elucidate the role of mesothelial cells, fibroblasts and extra-cellular matrices on adhesion and invasion of ovarian cancer cells to the omentum. Int J Cancer. Oct 01 2007;121(7):1463–72. doi: 10.1002/ijc.22874 [DOI] [PubMed] [Google Scholar]
- 17.Zhang K, Corsa CA, Ponik SM, et al. The collagen receptor discoidin domain receptor 2 stabilizes SNAIL1 to facilitate breast cancer metastasis. Nat Cell Biol. Jun 2013;15(6):677–87. doi: 10.1038/ncb2743 [DOI] [PMC free article] [PubMed] [Google Scholar]
- 18.Hwang PY, Brenot A, King AC, Longmore GD, George SC. Randomly Distributed K14(+) Breast Tumor Cells Polarize to the Leading Edge and Guide Collective Migration in Response to Chemical and Mechanical Environmental Cues. Cancer research. Apr 15 2019;79(8):1899–1912. doi: 10.1158/0008-5472.CAN-18-2828 [DOI] [PMC free article] [PubMed] [Google Scholar]
- 19.Shirure VS, George SC. Design considerations to minimize the impact of drug absorption in polymer-based organ-on-a-chip platforms. Lab Chip. Feb 14 2017;17(4):681–690. doi: 10.1039/c6lc01401a [DOI] [PMC free article] [PubMed] [Google Scholar]
- 20.Grumolato L, Liu G, Mong P, et al. Canonical and noncanonical Wnts use a common mechanism to activate completely unrelated coreceptors. Genes Dev. Nov 15 2010;24(22):2517–30. doi: 10.1101/gad.1957710 [DOI] [PMC free article] [PubMed] [Google Scholar]
- 21.Zhang K, Yao E, Lin C, et al. A mammalian Wnt5a-Ror2-Vangl2 axis controls the cytoskeleton and confers cellular properties required for alveologenesis. Elife. May 12 2020;9 doi: 10.7554/eLife.53688 [DOI] [PMC free article] [PubMed] [Google Scholar]
- 22.Green JL, Kuntz SG, Sternberg PW. Ror receptor tyrosine kinases: orphans no more. Trends in cell biology. Nov 2008;18(11):536–44. doi: 10.1016/j.tcb.2008.08.006 [DOI] [PMC free article] [PubMed] [Google Scholar]
- 23.Nishita M, Itsukushima S, Nomachi A, et al. Ror2/Frizzled complex mediates Wnt5a-induced AP-1 activation by regulating Dishevelled polymerization. Mol Cell Biol. Jul 2010;30(14):3610–9. doi: 10.1128/MCB.00177-10 [DOI] [PMC free article] [PubMed] [Google Scholar]
- 24.VanderVorst K, Hatakeyama J, Berg A, Lee H, Carraway KL 3rd. Cellular and molecular mechanisms underlying planar cell polarity pathway contributions to cancer malignancy. Semin Cell Dev Biol. Sep 2018;81:78–87. doi: 10.1016/j.semcdb.2017.09.026 [DOI] [PMC free article] [PubMed] [Google Scholar]
- 25.Nomachi A, Nishita M, Inaba D, Enomoto M, Hamasaki M, Minami Y. Receptor tyrosine kinase Ror2 mediates Wnt5a-induced polarized cell migration by activating c-Jun N-terminal kinase via actin-binding protein filamin A. The Journal of biological chemistry. Oct 10 2008;283(41):27973–27981. doi: 10.1074/jbc.M802325200 [DOI] [PubMed] [Google Scholar]
- 26.Nishita M, Yoo SK, Nomachi A, et al. Filopodia formation mediated by receptor tyrosine kinase Ror2 is required for Wnt5a-induced cell migration. J Cell Biol. Nov 20 2006;175(4):555–62. doi: 10.1083/jcb.200607127 [DOI] [PMC free article] [PubMed] [Google Scholar]
- 27.Zaoui K, Boudhraa Z, Khalife P, Carmona E, Provencher D, Mes-Masson AM. Ran promotes membrane targeting and stabilization of RhoA to orchestrate ovarian cancer cell invasion. Nat Commun. Jun 17 2019;10(1):2666. doi: 10.1038/s41467-019-10570-w [DOI] [PMC free article] [PubMed] [Google Scholar]
- 28.Ip CK, Cheung AN, Ngan HY, Wong AS. p70 S6 kinase in the control of actin cytoskeleton dynamics and directed migration of ovarian cancer cells. Oncogene. May 26 2011;30(21):2420–32. doi: 10.1038/onc.2010.615 [DOI] [PubMed] [Google Scholar]
- 29.Ho AL, Adkins D, Lorch JH, Thomas JS, Grewal JS. A phase 2 open-label study of conditionally active biologic ozuriftamab vedotin (BA3021) in failed PD-1/L1 treatment of patients with recurrent or metastatic squamous cell carcinoma of the head and neck. Journal of Clinical Oncology. 2023;41(16_suppl):TPS6107–TPS6107. doi: 10.1200/JCO.2023.41.16_suppl.TPS6107 [DOI] [Google Scholar]
Associated Data
This section collects any data citations, data availability statements, or supplementary materials included in this article.
Supplementary Materials
Data Availability Statement
The data generated in this study are available within the article and its supplementary data files.