

Abstract
Background:
Mural cells are an essential perivascular cell population that associate with blood vessels and contribute to vascular stabilization and tone. In the embryonic zebrafish vasculature, pdgfrb and tagln are commonly used as markers for identifying pericytes and vascular smooth muscle cells (vSMCs). However, the overlapping and distinct expression patterns of these markers in tandem have not been fully described.
Results:
Here, we used the Tg(pdgfrb:Gal4FF; UAS:RFP) and Tg(tagln:NLS-EGFP) transgenic lines to identify single- and double-positive perivascular cell populations on the cranial, axial, and intersegmental vessels between 1 and 5 days post-fertilization. From this comparative analysis, we discovered two novel regions of tagln-positive cell populations that have the potential to function as mural cell precursors. Specifically, we found that the hypochord—a reportedly transient structure—contributes to tagln-positive cells along the dorsal aorta. We also identified a unique mural cell progenitor population that resides along the midline between the neural tube and notochord and contributes to intersegmental vessel mural cell coverage.
Conclusion:
Together, our findings highlight the variability and versatility of tracking both pdgfrb and tagln expression in mural cells of the developing zebrafish embryo and reveal unexpected embryonic cell populations that express pdgfrb and tagln.
Keywords: mural cell progenitor, vSMC, pericyte, perivascular cells, hypochord, sclerotome, zebrafish
Introduction:
In vertebrate development, early blood vessels are comprised of a single layer of endothelial cells that recruit mural cells to assist in basement membrane deposition, vessel contractility, and cellular communication.1 Mural cells can vary widely in morphology and gene expression patterns depending on vessel type, vascular bed, tissue origin, differentiation status, developmental stage, and more.2–4 Types of mural cells include pericytes—which are associated with smaller vessels such as capillaries—and vascular smooth muscle cells (vSMCs) on larger vessels. vSMCs accumulate on arteries and, to a lesser extent, on veins during vascular development to provide tensile strength to vessels and promote basement membrane deposition.5 Due to the diverse properties of mural cells, different gene expression profiles can be used to identify mural cell types along various regions of the vasculature. Therefore, characterization of appropriate mural cell markers at distinct developmental stages is necessary for the study of vessel stabilization.
In the embryonic zebrafish, platelet-derived growth factor receptor beta (pdgfrb) and transgelin (tagln) are commonly used as markers to identify pericytes and vSMCs. However, the temporal expression patterns of these markers used in tandem has not been fully described. Pdgfrb—a surface receptor for the chemoattractant ligands of the Pdgf family—is used as a marker for pericytes and immature vSMCs.1,6,7 Pdgfrb has been shown to be required for mural cell expansion both embryonically and postnatally.7–9 Cranial and cardiac neural crest cells also express Pdgfrb and have the capacity to become mural cells in addition to giving rise to other mesenchymal cell populations.10–12 Some mature mural cells—such as pericytes—continue to express Pdgfrb, though less than 1% of Pdgfrb-positive cells in a zebrafish larvae at 5 days post-fertilization (dpf) are pericytes.13 This suggests that most Pdgfrb-positive cells in early development are progenitors for a diverse range of cell populations.
Tagln (or SM22)—an actin-binding protein from the calponin family—is commonly used to identify mature, contractile vSMCs.14,15 Tagln and other actin-binding proteins confer contractile function to mature mural cells, allowing them to regulate vascular tone and blood pressure.16 During development, Tagln is also expressed in intestinal smooth muscle, cardiac muscle, and skeletal muscle cells,17,18 though these muscle cells can be distinguished from vSMCs by cellular morphology and proximity to the vasculature. Together, this suggests that the pdgfrb and tagln reporters can be used to identify mural cells and their differentiation status by tracking single- versus double-positive cells in discrete vascular beds over the course of early development.
In this report, we use Tg(pdgfrb:Gal4FF; UAS:RFP) and Tg(tagln:NLS-EGFP) transgenic lines to identify single- and double-positive pericytes/vSMCs in the cranial, axial, and intersegmental vessels (ISVs) at 1 to 5 dpf. Through this study, we have uncovered two novel sites of tagln-positive cell populations that have the potential to function as mural cell precursors in the zebrafish trunk. First, we found that the hypochord—a reportedly transient structure present in fish and amphibians—contributes to tagln-positive cells along the dorsal aorta. Second, we identified a mural cell progenitor population—likely sclerotome-derived—that resides along the midline at the notochord-neural tube interface and contributes to ISV mural cell coverage. These findings highlight unexpected and nuanced gene expression patterns across perivascular cell maturation.
Results and Discussion:
pdgfrb and tagln transgenic reporter lines
To visualize mural cells in the zebrafish embryo, we crossed the established transgenic lines TgBAC(pdgfrb:Gal4FF)ncv24, Tg(5xUAS:RFP)zf83, and Tg(tagln:NLS-EGFP-2A-CFP-FTASE)y450 to generate embryos that were hemizygous carriers for each transgene. Expression of both pdgfrb and tagln were notable at all embryonic stages analyzed—with the brightest signal for pdgfrb visible in the anterior and cranial regions, and tagln in the skeletal muscle of the trunk and later in the intestinal compartment (Fig. 1).
Figure 1. pdgfrb and tagln fluorescent transgenic reporter lines.

Lateral view confocal images of Tg(tagln:NLS-EGFP-2A-CFP-FTASE); TgBAC(pdgfrb:Gal4FF); Tg(5xUAS:RFP) triple transgenic zebrafish embryos from 1–5 dpf. tagln expression (green) becomes increasingly evident in the trunk skeletal muscle and the intestinal compartment over time. pdgfrb expression (magenta) is primarily visible in the anterior trunk and cranial regions. Scale bars: 500 μm.
The tagln reporter line—designated as Tg(tagln:NLS-EGFP) in this report—contains a nuclear localization signal (NLS) that allows for GFP to be concentrated in the nucleus,5 a modification that facilitates the identification of individual tagln-positive cells in regions with dense tagln expression. For example, using cytosolic-GFP tagln reporters with high tagln expression evident in skeletal muscle would make it difficult to explore tagln expression patterns in cell populations near the skeletal muscle. However, use of this tagln nuclear reporter allows us to reveal cells with tagln expression that were previously hidden.
The pdgfrb reporter line utilizes the Gal4/UAS system12 and is designated as Tg(pdgfrb:Gal4FF; UAS:RFP). This line displayed occasional mosaic RFP fluorescence, though embryos with the least mosaicism were screened and selected for use. Due to this, there is likely some underrepresentation of pdgfrb-positive cells quantified in this study, particularly cells that express low levels of pdgfrb. However, despite potential mosaicism issues, the expression patterns that we visualized over time and in various regions were consistent across all samples.
In addition to mural cells, a subset of endothelial cells and non-vascular parenchymal cells are pdgfrb-positive in early cranial development
Development of the zebrafish cranial vasculature has been thoroughly mapped through numerous studies. This process involves the formation of the primordial mid- and hindbrain channels (PHBC/PMBC) and the lateral dorsal aorta (LDA) by 1 dpf, the growth of the middle cerebral vein (MCeV), metencephalic artery (MtA), basilar artery (BA), and Circle of Willis (CoW) by 1.5 dpf, and the sprouting and fusion of various central arteries (CtAs) from the PHBC to the BA by 2 dpf.19–21 These vessels continue to remodel, grow, and stabilize into adulthood, though the patterning remains mostly intact beyond 6 dpf.21
Neural crest-derived pdgfrb-positive pericytes are currently considered to be the predominant mural cell in the mid- and hindbrain prior to 5 dpf.12,22–24 Interestingly, Ando et al have shown that a subset of mural cells in the hindbrain are derived from mesoderm—specifically, pdgfrb-positive cells surrounding the PHBC at 1 dpf. Subsequently, these cells increase pdgfrb expression, migrate to CtAs, and eventually acquire vSMC markers—such as tagln—at 5 dpf.12,23 Prior to 5 dpf, vSMC markers are sparse in the cranial vessels, with less than 10% of mural cells on the CtAs expressing tagln by 5 dpf.22
In our Tg(tagln:NLS-EGFP); Tg(pdgfrb:Gal4FF; UAS:RFP) embryos, as expected, pdgfrb was the predominant marker of cranial mural cells between 1 and 5 dpf (Fig. 2A–J). At 1 dpf, a subset of pdgfrb-positive cells were loosely associated with the PHBC (Fig. 2B), corroborating previous data.12,23 After 1 dpf, pdgfrb-positive cells slowly accumulate on the CoW and CtAs until 5 dpf, the latest stage analyzed (Fig. 2C–J). Infrequent pdgfrb/tagln double-positive cells were observed beginning at 4 dpf on the CoW and CtAs; however, no tagln single-positive cells were detected at the time points assessed. These findings are consistent with previous reports that vSMC markers such as tagln are not prevalent in cranial mural cells prior to 4 dpf.22,25 These results indicate that pdgfrb is the predominant mural cell marker along embryonic cranial vessels, though a small proportion of these cells—particularly on the arteries—can mature into pdgfrb/tagln double-positive vSMCs by 5 dpf.
Figure 2: Coronal imaging of Tg(tagln:NLS-EGFP); Tg(pdgfrb:Gal4FF; UAS:RFP) zebrafish brains with vascular-injected Evans Blue dye from 1 to 5 dpf.

Evans Blue dye was injected into the sinus venosus of zebrafish embryos at the indicated time point to label the vasculature, then the mid- and hindbrain region was imaged. (A) Schematic diagram illustrating the orientation for imaging brain coronal sections: lower middle region (yellow) and upper middle region (purple). (B-J) Maximum intensity projection images of pdgfrb and tagln in the mid- and hindbrain from 1 to 5 dpf. (B’-J’) Images include the Cy5 channel to visualize the vasculature (cyan). At 1 dpf (B) pdgfrb-positive cells are present throughout the brain parenchyma. At 2 dpf (C,D) pdgfrb-positive cells accumulate around the CoW—while still prevalent in the lower parenchyma (C)—and on the CtAs (D). pdgfrb-positive cells continue to accumulate on the CoW and CtAs from 3 to 5 dpf (E-J). Though tagln expression is sparse in the brain at these stages, infrequent pdgfrb/tagln double-positive cells are detectable starting around 4 dpf on the CtAs (though not present in these selected images). Schematic created with BioRender.com. The Fiji “subtract background” function was used for the Cy5 channel to clarify the vasculature. Images are representative of n=16 (1 dpf), n=10 (2 dpf), n=12 (3 dpf), n=12 (4 dpf), and n=10 (5 dpf) for a total of 60 embryos analyzed. AMCtA, anterior mesencephalic central artery. BA, basilar artery. CaDI, caudal division of the internal carotid artery. CCtA, cerebellar central artery. CoW, Circle of Willis. MMCtA, middle mesencephalic central artery. MtA, metencephalic artery. OpV, ophthalmic vein. PHBC, primordial hindbrain channel. PMCtA, posterior mesencephalic central artery. Scale bars: 50 μm.
Of note—vascular-associated mural cells represented a minor fraction of the total pdgfrb-positive cells present in the mid- and hindbrain during early cranial development. Endothelial cells in the MCeV, PHBC, and PMBC were noted to be pdgfrb-positive at 1 dpf (Fig. 3A–E). By 2 dpf, endothelial-specific pdgfrb signal disappeared from the MCeV and slightly decreased in the PHBC and PMBC, though it was detectable in the newly formed CtAs (Fig. 3F–J). Prior research has shown that early endothelial cells can express pdgfrb,26 and that it is involved in the maturation of hemangioprecursor cells into endothelial cells.27 Consequently, care needs to be taken when using pdgfrb reporters in embryonic cranial mural cell studies in order to distinguish pdgfrb signal between mural cells and endothelial cells.
Figure 3. pdgfrb expression is present in kdrl-positive cranial endothelial cells and predominantly does not overlap with sox10 expression during early brain development.

(A) Schematic diagram illustrating the orientation for imaging sagittal (yellow) and coronal (purple) sections of the mid- and hindbrain. (B-J) Single-plane images of blood vessels in the Tg(kdrl:mCherry-CAAX); Tg(pdgfrb:Gal4FF; UAS:EGFP) mid- and hindbrain at 1 and 2 dpf with pdgfrb-positive cells in magenta and endothelium (kdrl) in green. At 1 dpf (B-E), endothelial cells of the MCeV, PHBC, and PMBC are pdgfrb-positive (white arrows in coronal sections). At 2 dpf (F-J), fewer endothelial cells are pdgfrb-positive; however, expression is still detectable in the CtAs, PHBC, and PMBC (white arrows in coronal sections). Asterisks indicate the blood vessel lumen. (K,L) Single-plane images of cells positive for neural crest marker sox10 in the Tg(sox10:mRFP); Tg(pdgfrb:Gal4FF; UAS:EGFP) mid- and hindbrain at 1 dpf with pdgfrb in magenta and sox10 in green. The majority of pdgfrb-positive cells in the brain parenchyma are sox10-negative at 1 dpf, suggesting that these particular cells are not derived from the neural crest. The pdgfrb/sox10 double-positive structure in panel K is the facial placode. Schematic created with BioRender.com. Images are representative of n=7 (1 dpf; kdrl), n=9 (2 dpf; kdrl), and n=7 (1 dpf; sox10) for a total of 23 embryos analyzed. CtA, central artery. FP, facial placode. MCeV, middle cerebral vein. PHBC, primordial hindbrain channel. PMBC, primordial midbrain channel. Scale bars: 25 μm.
Further, pdgfrb-positive parenchymal cells were abundant in 1 to 2 dpf mid- and hindbrains (Fig. 2B,C). While previous reports suggest that cranial neural crest is a major source of pdgfrb-positive cells in early brains, these cells were predominantly negative for neural crest marker SRY-box transcription factor 10 (sox10; Fig. 3K,L). While it is possible that a portion of pdgfrb-positive cranial neural crest cells decrease sox10 expression by 1 dpf and now present as sox10-negative, the data suggest that the predominant pdgfrb-positive populations in 1 to 2 dpf brains are non-vascular parenchymal cells.
The hypochord is a source of tagln-positive cells on the dorsal aorta
The main axial vessels—i.e. dorsal aorta (DA) and posterior cardinal vein (PCV) in the anterior trunk and the caudal artery (CA) and caudal vein (CV) in the tail—are some of the first vessels to form prior to the onset of circulation at 1 dpf.21 The mural cells that accumulate on the ventral side of the DA have been well-described; pdgfrb-positive cells begin to accumulate at 1.5 dpf and then acquire the vSMC marker tagln at 3 dpf.5,12,23 Approximately 25% of vSMCs on the ventral side of the DA are reported to be pdgfrb/tagln double-positive by 5 dpf.22
The mural cells that cover the dorsal side of the zebrafish DA are not as well-defined. Intriguingly, in mice, the mural cells that accumulate on the dorsal and ventral sides of the DA are initially derived from different mesodermal origins.28 This lineage difference has not been definitively shown in zebrafish. However, there are clear distinctions between the cells that initially populate the dorsal versus ventral sides of the DA in zebrafish embryos—with the mural cells on the dorsal side of the DA reported to express tagln but not pdgfrb.12
To begin, we analyzed pdgfrb and tagln expression in mural cells of the anterior DA and PCV in Tg(tagln:NLS-EGFP); Tg(pdgfrb:Gal4FF; UAS:RFP) embryos between 1 to 5 dpf (Fig. 4A–I). We identified the hypochord at 1 dpf as the pdgfrb/tagln-positive structure immediately dorsal to the DA that runs along the midline (Fig. 4A). The hypochord is a reportedly transient, rod-like structure—only one cell in width and height—that resides beneath the notochord and assists in the formation and patterning of the DA.29–31 Once the DA is formed, the hypochord cells are reported to delaminate and degenerate—in part due to apoptosis30,31—then by 2.5 dpf either disappear or become indistinguishable from the cells that surround the DA in the zebrafish embryo.29
Figure 4: tagln and pdgfrb expression along the dorsal aorta and cardinal vein of the zebrafish from 1 to 5 dpf.

(A-E) Maximum intensity projection images of the DA and PCV in Tg(tagln:NLS-EGFP); Tg(pdgfrb:Gal4FF; UAS:RFP) zebrafish from 1 to 5 dpf. (A’-E’) The images from A-E without the brightfield overlay. (F-G) Quantitation of the number of single- and double-positive cells on the dorsal side of the DA (F), the ventral side of the DA (G), and the PCV (H). (I) Schematic diagram illustrating the imaged region. Schematic created with BioRender.com. Images and graphs are representative of n=6 (1 dpf), n=6 (2 dpf), n=6 (3 dpf), n=6 (4 dpf), and n=6 (5 dpf) for a total of 30 embryos analyzed. DA, dorsal aorta. HC, hypochord. NC, notochord. PCV, posterior cardinal vein. Scale bars: 50 μm. Scale bars in insets: 10 μm.
pdgfrb expression in the hypochord has been previously reported, in addition to pdgfrb expression in the floor plate—the structure that sits on the ventral side of the neural tube.12,22,32 We found that in addition to pdgfrb, the hypochord also expresses tagln at 1 dpf (Fig. 4A,F). At 2 dpf, the hypochord cells begin to elongate, as evidenced by the change in shape of tagln-positive nuclei (Fig. 4B). At 3 dpf, when the hypochord has been reported to be absent from the anterior trunk,29 we observed that the tagln-positive cells persist and begin to decrease pdgfrb expression (Fig. 4C,F). By 4 dpf, many of these cells were tagln single-positive (Fig. 4D,F; Movie 1). However, a portion of elongated tagln-positive cells were still present at 5 dpf (Fig. 4E,F), and Ando et al reports observing these tagln single-positive cells above the DA as late as 7 dpf.12
To confirm that these hypochord-derived cells are maintained—and that they are not ventral vSMCs that have migrated to the dorsal side of the DA—we used a twist family bHLH transcription factor 1a (twist1a) transgenic line to distinguish sclerotome cells.5,33 The hypochord—in addition to the notochord and floor plate—has been shown to be derived from the multipotent midline progenitor cells in the dorsal organizer or the tailbud.34,35 Thus, hypochord cells maintain distinct origins from sclerotome cells, which emerge from a sub-compartment of the somites derived from the paraxial mesoderm.36 Upon analysis, we found that the tagln single-positive cells on the dorsal side of the DA are twist1a-negative, however the vSMCs on the ventral side of the DA are twist1a-positive (Fig. 5A–F). These results suggest that the hypochord is the source of the tagln single-positive cells that reside on the dorsal side of the DA.
Figure 5. tagln single-positive cells on the dorsal side of the DA do not express the sclerotome marker twist1a.

Single-plane images of the DA in Tg(tagln:NLS-EGFP); Tg(Ola.Twist:GAL4; UAS:RFP) zebrafish at 2 dpf (A,D) and 4 dpf (B,E). (A-C) Sagittal view. tagln-positive nuclei derived from the hypochord are apparent at 2 dpf and do not express twist1a at the 2 or 4 dpf timepoints (solid white arrows), unlike vSMCs on the ventral side of the DA that do express twist1a (open arrows). The weak twist1a signal that is visible on the dorsal side of the DA in these images is from the cells sitting adjacent to the tagln-positive hypochord population. These cells can be seen from coronal views. (D-F) Coronal view. tagln single-positive nuclei of the hypochord on the dorsal side of the DA are twist1a-negative at both 2 and 4 dpf (solid white arrows), with twist1a-positive cells adjacent to the DA in this region. These data suggest that the tagln-single positive hypochord cells on the dorsal side of the DA are not replaced by sclerotome-derived vSMCs after 2 dpf when the hypochord has been previously reported to disappear. (C,F) Schematic diagrams illustrating the orientation for imaging sagittal (C) or coronal (F) sections of the DA. Schematics created with BioRender.com. Images are representative of n=6 (2 dpf) and n=6 (4 dpf) for a total of 12 embryos analyzed. DA, Dorsal Aorta. Scale bars: 50 μm.
Time-lapse imaging revealed that hypochord cells infrequently underwent apoptosis or mitosis—and neither appreciably affected hypochord cell number between 1 to 4 dpf (Movie 2). From 1.5 to 2 dpf, apoptosis occurred in 1.7% of cells and mitosis occurred in 2.6% of cells (n=6, average duration of time-lapse=13.3 hours). From 2.5 to 3 dpf, apoptosis was not observed while mitosis occurred in 1.4% of cells (n=6, average duration of time-lapse=10.9 hours). From 3.5 to 4 dpf, apoptosis occurred in 0.8% of cells while mitosis was not observed (n=6, average duration of time-lapse=12.0 hours). These percentages indicate that hypochord cells persist, with negligible loss to hypochord cell number over time. Due to their proximity to the dorsal aorta, we propose these cells may undertake a mural cell role; however, further research is needed to determine whether these cells function similarly to other vSMC populations. This also indicates that the cells of the hypochord are not entirely transient as previously assumed, but instead reprogram their cellular function and morphology after the DA has been appropriately oriented.
As the hypochord is present exclusively in fish and amphibians, we questioned whether there is an analogous mammalian structure that could contribute to Tagln-positive cells on the DA of amniotes. Previous reports speculate that the dorsal endoderm—a midline structure that originates from the midline precursor cell population and forms ventral to the notochord37—may play a role in angioblast and DA formation,38 similar to the hypochord. However, while the endoderm gives rise to the intestines, lung, liver, and other organs,39 there are no known reports of endoderm contributing to mural cell populations in amniotes.4
In the mouse embryo, the dorsal and ventral sides of the DA are populated by vSMCs from different sources: the ventral side is first populated by cells from the lateral plate mesoderm, with dorsal vSMCs originating from the somites. Over time, the vSMCs from the lateral plate mesoderm disappear, and the ventral side then becomes populated with somitic vSMCs.28 While this process is not identical on the zebrafish DA—given that somitic vSMCs are the initial populators of the ventral side of the DA in zebrafish—it does indicate that dorsal and ventral vSMCs can arise from divergent origins and supports that this could be a conserved process.
Mural cells mature in an anterior to posterior manner along the axial vessels
We next observed the development of the mural cells on the ventral side of the DA. While the hypochord cells on the dorsal side of the DA flattened and elongated over time, the vSMCs on the ventral side were more globular (Fig. 4A–E). pdgfrb single-positive vSMCs were observed beginning at 2 dpf, where they then expanded in number and increased expression of tagln (Fig. 4A–E,G). By 5 dpf, pdgfrb/tagln double-positive cells accounted for approximately 60% of ventral vSMCs, and no tagln single-positive cells were detected. These data are consistent with previous reports of vSMCs on the ventral side of the DA, though we observe a higher percentage of double-positive vSMCs (60% versus 25%) by 5 dpf.12,22,23
Furthermore, we detected pdgfrb single-positive cells associated with the PCV as early as 1 dpf—though these cells were sparse—followed by the slow and sporadic accumulation of pdgfrb-positive cells until 5 dpf (Fig. 4A–E,H). This timing is earlier than suggested in previous reports where pdgfrb expression was undetectable in cells around the PCV prior to 7 dpf.12 Stratman et al describes a small number of tagln-positive cells on the PCV around 4 dpf.5 Similarly, we saw low numbers of weak tagln-positive cells beginning at 3 dpf, though these cells were less common than pdgfrb single-positive cells (Fig. 4H). These data indicate that mural cells of the PCV associate and mature at later developmental stages than vSMCs on the DA.
In the posterior trunk region, mural cells of the CA and CV associate with vessels and pattern similarly to the anterior mural cells but on a delayed time course (Fig. 6A–I). At 1 dpf, the hypochord cells were block-like, and were still distinguishable as hypochord cells by 2 dpf (Fig. 6A,B,F). This was expected, as the hypochord matures in an anterior to posterior fashion.29 The hypochord cells began to elongate by 3 dpf (Fig. 6C), at which point they appeared comparable to the 2 dpf hypochord cells in the anterior region (Fig. 4B). While the cells then began turning off pdgfrb, only about a third of hypochord cells in the posterior trunk were tagln single-positive by 5 dpf (Fig. 6C–F), indicating a delay in hypochord reprogramming compared to the anterior hypochord.
Figure 6: tagln and pdgfrb expression along the caudal artery and vein of zebrafish from 1 to 5 dpf.

(A-E) Maximum intensity projection images of the CA and CV in Tg(tagln:NLS-EGFP); Tg(pdgfrb:Gal4FF; UAS:RFP) zebrafish from 1 to 5 dpf. (A’-E’) The images from A-E without the brightfield overlay. (F-G) Quantitation of the number of single- and double-positive cells on the dorsal side of the CA (F), the ventral side of the CA (G), and the CV (H). (I) Schematic diagram illustrating the imaged region. Schematic created with BioRender.com. Images and graphs are representative of n=5 (1 dpf), n=6 (2 dpf), n=6 (3 dpf), n=6 (4 dpf), and n=6 (5 dpf) for a total of 29 embryos analyzed. CA, caudal artery. CV, caudal vein. HC, hypochord. NC, notochord. Scale bars: 50 μm. Scale bars in insets: 10 μm.
The ventral side of the CA began acquiring pdgfrb single-positive cells at 2 dpf—similar to the DA—but they did not begin co-expressing tagln until 5 dpf (Fig. 6B–E,G). This amounted to a 2-day delay in mural cell development compared to the anterior region (Fig. 4G). Finally, mural cell coverage of the CV was particularly sparse (Fig. 6A–E,H), with half as many cells associated with the CV compared to the PCV at the same developmental stage (Fig. 4H). These data indicate that association and maturation of vSMCs on the main axial vessels occurs in an anterior to posterior fashion across time. A visual summary of these findings can be found in Figure 7.
Figure 7: Summary of mural cell accumulation on the axial vasculature.

The hypochord—which begins as a pdgfrb/tagln double-positive structure—is a novel source of tagln-positive cells on the dorsal side of the dorsal aorta and caudal artery. At 2 dpf, the hypochord cells start to elongate above the dorsal aorta. At 3 dpf, the pdgfrb/tagln double-positive cells start to decrease pdgfrb expression. By 4 dpf, these cells are predominantly tagln single-positive. In the region of the caudal artery, this hypochord reprogramming event begins 1 day later than the anterior region. On the ventral side of the dorsal aorta and caudal vein, pdgfrb single-positive vSMCs were observed beginning at 2 dpf, then expanded in number and increased expression of tagln over time. By 5 dpf, pdgfrb/tagln double-positive cells accounted for approximately 60% of ventral vSMCs on the dorsal aorta, and no tagln single-positive cells were detected. The vSMCs on the ventral side of the caudal artery accumulated more slowly and did not begin co-expressing tagln until 5 dpf, which amounted to a 2-day delay compared to the anterior region. Finally, we observed a slow accumulation of pdgfrb single-positive cells on the posterior cardinal vein and caudal vein between 1 to 5 dpf. tagln-positive cells were sparse on the veins but visible at later stages on the posterior cardinal vein.
By 1 dpf, the anterior and posterior regions of the main axial vessels have formed, somite segmentation has been completed, and the sclerotome is distinct from other somitic tissues.40 Despite this, DA vSMCs—which are mainly derived from the sclerotome5—mature one to two days earlier than the vSMCs of the CA (Fig. 2). There may be several reasons for this delay, with one hypothesis being that the DA provides earlier signals than the CA to initiate maturation of vSMCs. Alternatively, since somites develop in an anterior to posterior wave,40 the age of the somites from which mural cells are derived could influence the timing of vSMC maturation, even after vSMCs have accumulated on the vessels. More work will be needed in this area to resolve the cues driving this temporal differentiation pattern.
Of note, weak tagln expression can be detected in endothelial cells of the axial vasculature (Fig. 8A,B), which is consistent with previous reports that the endothelium can express low levels of tagln.14,41 Despite this, tagln expression in the endothelial cells was easily distinguishable from vSMCs; therefore, it did not confound quantitation of the tagln-positive mural cell counts of the axial vessels. Additionally, pdgfrb expression was detected in a sporadic subset of endothelial cells of the early posterior cardinal vein (Fig. 8E,F). This is also consistent with previous reports of early endothelial cells expressing pdgfrb.26,27 These cells were more difficult to distinguish from bona fide mural cells, and may be included in the pdgfrb-positive mural cell counts of the posterior cardinal vein.
Figure 8. Low tagln expression is evident in aortic endothelial cells and a subset of perivascular cells on the ISVs, while pdgfrb is present in a portion of venous endothelial cells.

(A-D) Single-plane images of Tg(tagln:NLS-EGFP); Tg(kdrl:mCherry-CAAX) zebrafish at 1 dpf (A,B) and 3 dpf (C,D) where kdrl is used to mark endothelial cells (magenta). (A-C) Low tagln expression is seen in endothelial cells of the aorta and ISVs (white arrows). High (C) and low (D) tagln expression is also visible in perivascular cells on the ISVs (yellow arrows). (E,F) Single-plane images of Tg(pdgfrb:Gal4FF;UAS:EGFP); Tg(kdrl:mCherry-CAAX) zebrafish at 1 dpf with endothelium (kdrl) in green. pdgfrb expression is seen in a portion of endothelial cells of the posterior cardinal vein (white arrows). Images are representative of n=4 (1 dpf; tagln), n=3 (3 dpf; tagln), and n=7 (1 dpf; pdgfrb) for a total of 14 embryos analyzed. ISVs, intersegmental vessels. Scale bars: 10 μm.
Analysis of the intersegmental vessels (ISVs) reveals a subset of early tagln single-positive mural cell precursors
We next analyzed the mural cell populations surrounding the ISVs of the zebrafish trunk. At 1 dpf, arterial ISVs (aISVs) begin to sprout from the DA, grow dorsally between the somites and the notochord/neural tube, then branch laterally to establish the dorsal longitudinal anastomotic vessel (DLAV) that resides above the neural tube.42. At 1.5 dpf, sprouts from the PCV grow dorsally and connect with a subset of arterial ISVs to cause a fate switch to venous ISVs (vISVs).43 By 2 dpf, the arterial and venous ISVs are mostly lumenized and reach from the DA/PCV below the notochord to the DLAV above the neural tube.21
Mural cells of the ISVs have been reported to emerge by either de novo differentiation of nearby mesenchyme followed by subsequent proliferation or through migration from the ventral side of the DA.12 Studies identifying the origin of ISV mural cells show that they are primarily derived from the sclerotome.5,44 Zebrafish have recently been shown to have a dorsal and ventral sclerotome, both of which contribute to the cells that associate with the ISVs: dorsal sclerotome populates the ISV region adjacent to the neural tube while ventral sclerotome populates the full ISV.44–46 However, while dorsal and ventral sclerotome cells can contribute to the development of different regions of the embryo,45,46 it is currently unclear how they differ in gene expression.
Rajan et al recently described a population of sclerotome-derived cells called perivascular fibroblasts that associate with ISVs by 2 dpf and produce collagen matrix, thus providing structural support prior to mural cell migration or differentiation.44 These cells are primarily derived from ventral sclerotome, are evenly distributed between arterial and venous ISVs, remain constant in number on the ISVs from 2 to 4 dpf, and express low levels of pdgfrb.44 At 3 dpf, a subset of perivascular fibroblasts increase pdgfrb expression to become ISV mural cells.44 Ando et al also describes a naïve pdgfrb-low mesenchymal population—likely the same cell type or similar to perivascular fibroblasts—that can mature into pdgfrb-high mural cells on the ISVs starting at approximately 2.5 dpf.12,23 Both studies observe that mural cells with pdgfrb-high expression are more apparent on aISVs than vISVs,12,44 which is in part due to maturation of pdgfrb-low mesenchyme to pdgfrb-high mural cells through Notch signaling in arterial endothelium.22 Ando et al also observes that approximately 15% of mural cells are tagln-positive on ISVs by 5 dpf,22 potentially indicating further maturation of these pdgfrb-positive cells.
In support of these previous studies, we observed pdgfrb-low and -high cell populations surrounding the ISVs up to 5 dpf in Tg(tagln:NLS-EGFP); Tg(pdgfrb:Gal4FF; UAS:RFP) embryos (Figs 9A–F). Unexpectedly, we also detected tagln-low and -high populations on the ISVs as early as 2 dpf (Figs 9E,F), prior to the developmental stages in which ISV mural cells reportedly mature. While a subset of tagln-low cells in this region were endothelial cells, we confirmed that many of the tagln-low and -high cells associated with the early ISVs were perivascular (Fig. 8C,D).
Figure 9. Low and high pdgfrb/tagln expression is evident along arterial and venous ISVs from 2 to 5 dpf.
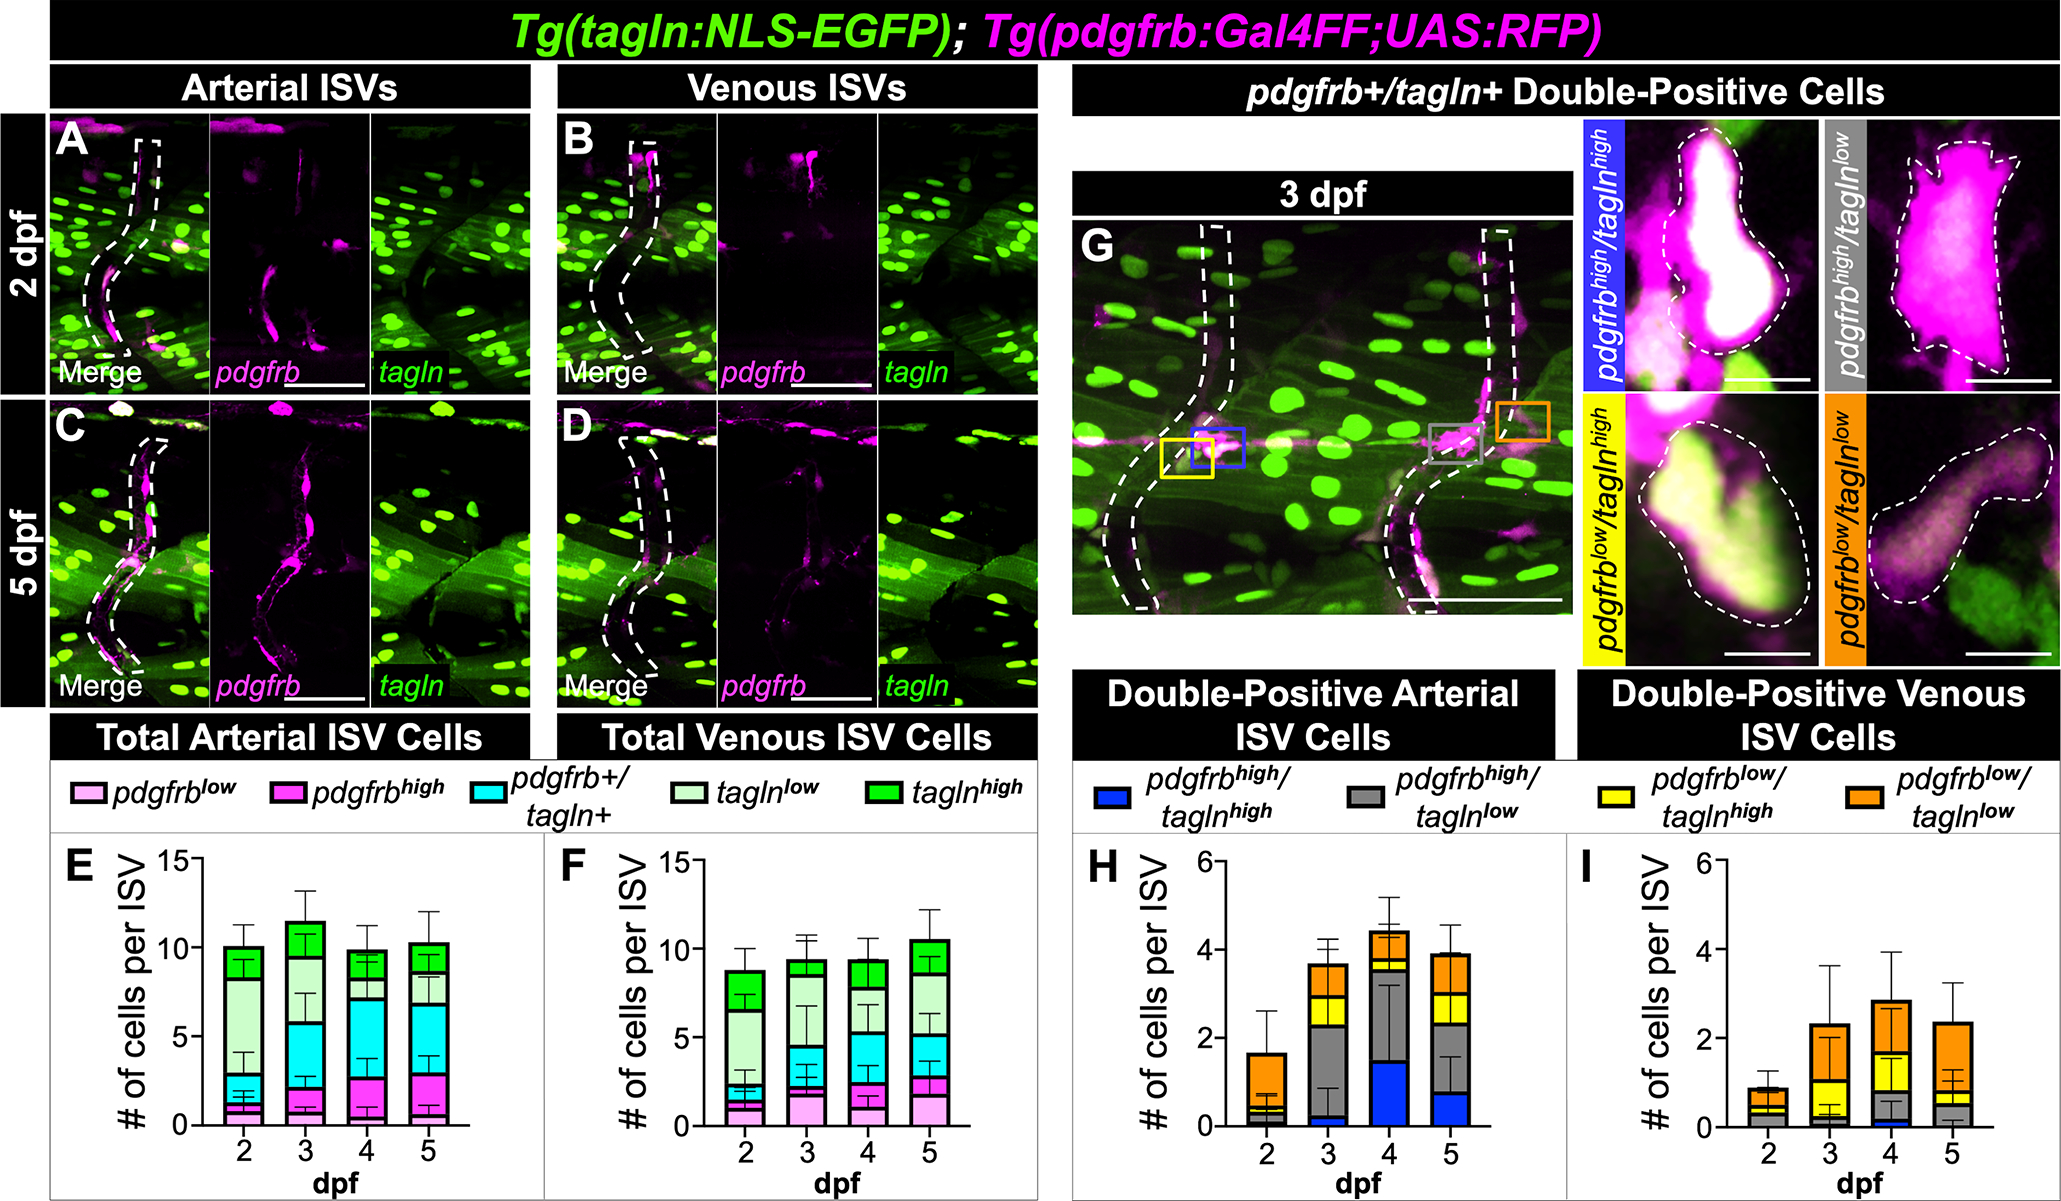
(A-D) Maximum intensity projection images of Tg(tagln:NLS-EGFP); Tg(pdgfrb:Gal4FF; UAS:RFP) arterial and venous ISVs at 2 (A,B) and 5 dpf (C,D). tagln-positive skeletal muscle nuclei are particularly evident in the trunk region near the ISVs, thus requiring frame-by-frame analysis to identify tagln-positive perivascular cells. (E,F) Quantitation of the number of low and high single- and double-positive cells on the arterial (E) and venous (F) ISVs. Arterial ISVs accumulate pdgfrb-high mural cells more robustly than venous ISVs. (G) Representative image of the combinations of pdgfrb/tagln double-positive cells, with insets for enlarged views. Inset panels are rotated for ease of viewing. (H,I) Quantitation of the number double-positive cells on the arterial (H) and venous (I) ISVs. pdgfrb/tagln double-positive cells were more apparent on arterial ISVs. tagln-positive ISV endothelial cells and tagln-low perivascular cells were difficult to distinguish, thus a small number of endothelial cells may be included in the count of tagln-low cells of the ISVs. “Low” versus “high” expression was determined subjectively by comparison of fluorescence intensity to skeletal muscle nuclei intensity. Intensities that were comparable to skeletal muscle were labeled as “high” whereas lower intensities were labeled as “low”. Images and graphs are representative of n=6 (2 dpf), n=6 (3 dpf), n=8 (4 dpf), and n=8 (5 dpf) for a total of 28 embryos analyzed. ISVs are outlined by white dotted lines and their position identified from brightfield images. ISVs, intersegmental vessels. Scale bars for A-D,G: 50 μm; scale bars for G insets: 5 μm.
From our ISV data, we observed findings most similar to that of the perivascular fibroblasts44: the total number of perivascular cells associated with the ISVs remained constant between 2 to 5 dpf, the cells were equally distributed on aISVs and vISVs, and pdgfrb-high cells became more apparent on aISVs than vISVs over time (Figs 9A–F). We were able to identify pdgfrb/tagln double-positive cells with all combinations of high and low expression that increased in proportion from 2 to 4 dpf (Fig. 9G–I). Our data showed that double-positive cells were more common on aISVs than vISVs and, as expected, the double-positive cells on the aISVs were more likely to be pdgfrb-high (Fig. 9G,I). tagln-high mural cells were constant on all ISVs between 2–5 dpf (Fig. 9E,F), suggesting that on ISVs, mural cells may diverge from the typical expression patterns of differentiation that would predict upregulated tagln at late stages in the process of maturation.
tagln-low cells were the most common perivascular cell associated with the ISVs at early timepoints (Fig. 9E,F). We speculated that the identity of these cells would overlap with the sclerotome-derived perivascular fibroblast population. Indeed, when using the twist1a transgenic line as a sclerotome marker, we identified twist1a-positive cells that reside at the notochord-neural tube interface and notochord region as tagln-low, even prior to their association with the ISVs (Fig. 10A,D,E). Interestingly, a subset of cells that likely originated from the dorsal sclerotome—based on their localization adjacent to the neural tube44—were tagln-negative (Fig. 10B,C). These data indicate that the ventral sclerotome may be distinct from dorsal sclerotome by the early and low expression of tagln.
Figure 10. twist1a-positive cells with low tagln expression are predicted to arise from the ventral sclerotome compartment.

(A) Maximum intensity projection image of the ISV region of a Tg(tagln:NLS-EGFP); Tg(Ola.Twist:GAL4; UAS:RFP) zebrafish at 2 dpf. The ISV is outlined with a white dotted line and its position identified from brightfield images. (B-E) Discrete regions of panel A are max projected for better visualization of twist1a-positive cells near the neural tube (B,C), notochord-neural tube interface (D), and notochord (E). The majority of twist1a-positive cells near the neural tube are tagln-negative (B,C; indicated by stars), while all twist1a-positive cells at the notochord-neural tube interface and below are tagln-positive (D,E). Due to the ventral localization of tagln/twist1a double-positive cells, we predict that these cells arise from the ventral sclerotome, with twist1a-single positive cells near the neural tube arising from the dorsal sclerotome. The tagln-positive/twist1a-negative vascular cell in panel E is likely endothelium (white arrow). Images are representative of n=6 embryos (2 dpf). ISVs, intersegmental vessels. Scale bars: 10 μm.
We also observed consistent tagln/pdgfrb expression patterns in mural cells based on their localization on the ISVs. tagln single-positive cells were more apparent on the ISVs in the region adjacent to the notochord (Fig. 11), consistent with previous reports of ventral sclerotome migration to this region.44,45 pdgfrb single-positive cells were highly associated with the ISVs near to the neural tube (Fig. 11), where the ISVs are primarily populated by dorsal sclerotome.44 Finally, pdgfrb/tagln double-positive cells were particularly evident at two sites by 5 dpf—closest to the notochord-neural tube interface (Fig. 11), which could indicate a site-specific maturation event, and near DA/aISV boundaries, which would suggest that these are vSMCs from the ventral side of the DA that have migrated to the aISVs.
Figure 11. Summary of mural cell accumulation along ISVs.

Schematic diagram summarizing the general localization of perivascular cells on the ISVs at 2 and 5 dpf. pdgfrb single-positive cells were more likely to be found on the dorsal ISV region (dorsal to the mid-line of the zebrafish), tagln single-positive cells were found primarily near the notochord ISV region, and double-positive cells were found nearest to the notochord-neural tube interface by 5 dpf. Schematic created with BioRender.com. ISVs, intersegmental vessels.
Together, these data indicate that tagln may not exclusively label mature mural cells, but instead could also label a subset of mural cell precursors in the trunk. These precursors likely overlap with the perivascular fibroblast population described by Rajan et al,44 as they both express sclerotome markers and populate the ISVs prior to reported mural cell maturation.
A twist1a-positive mural cell progenitor population resides along the zebrafish midline
From imaging tagln- and pdgfrb-positive cells near the ISVs in Tg(tagln:NLS-EGFP); Tg(pdgfrb:Gal4FF; UAS:RFP) embryos, we discovered several cell populations with unexpected pdgfrb/tagln expression near the zebrafish midline. Of the structures that reside at or near the midline, the medial floor plate is one of the most recognizable due to its hourglass-like shape.47 Medial floor plate cells (MFP)—which reside at the ventral side of the neural tube and contribute to neuronal differentiation48—have been previously identified as pdgfrb-positive.12,32 Here, we confirmed that medial floor plate cells co-express tagln from 1 to 5 dpf (Fig. 12A–K, cyan arrows in B–J).
Figure 12. A tagln/twist1a double-positive mural cell progenitor population at the notochord-neural tube interface upregulates pdgfrb and contacts the ISVs.

(A-J) Maximum intensity projection images of cell populations near the notochord-neural tube interface in Tg(tagln:NLS-EGFP); Tg(pdgfrb:Gal4FF; UAS:RFP) zebrafish. Sagittal (A,C,E,G,I) and orthogonal (B,D,F,H,J) views of the medial floor plate (MFP) from 1–5 dpf reveal pdgfrb/tagln co-expression (cyan arrows). A separate tagln single-positive population of cells accumulates immediately below the MFP starting at 3 dpf (E-J, open arrows). Finally, an independent tagln single-positive population—hereafter called the mural cell progenitor population—aligns near the notochord-neural tube interface (A’-I’,B,D,F,H,J, yellow arrows) and begins to elongate and upregulate pdgfrb over time. (K) Schematic diagram illustrating the three described cell populations from a sagittal and orthogonal view. (L-O) Maximum intensity projection images of Tg(tagln:NLS-EGFP); Tg(Ola.Twist:GAL4; UAS:RFP) zebrafish showing that the tagln-positive midline cells (open arrows, 4 dpf) and mural cell progenitors (yellow arrows) are twist1a-positive, suggesting that they are derived from the sclerotome unlike the cells of the medial floor plate (magenta arrows). (P-S) Cells from the mural cell progenitor population can be seen extending and making contact with ISVs (white arrows) using both pdgfrb and tagln as markers (P,Q) or twist1a and tagln (R,S). ISVs are outlined and were identified from brightfield images. Schematic created with BioRender.com. Images are representative of n=12 (1 dpf; pdgfrb), n=6 (2 dpf; pdgfrb), n=6 (3 dpf; pdgfrb), n=12 (4 dpf; pdgfrb), n=10 (5 dpf; pdgfrb), n=6 (2 dpf; twist1a), and n=6 (4 dpf; twist1a) for a total of 58 embryos analyzed. ISV, intersegmental vessel. MC, mural cell. MFP, medial floor plate. NC, notochord. NT, neural tube. Scale bars: 10 μm.
The medial floor plate and hypochord—which we also show is tagln-positive—are among the earliest structures in the zebrafish embryo to co-express pdgfrb and tagln. Interestingly, the hypochord, floor plate, and notochord have been shown to be derived from the multipotent midline progenitor cells in the dorsal organizer or the tailbud34,35—a common origin which may, in part, explain how two structures that are dissimilar in function share this unique expression pattern. Furthermore, in the invertebrate Ciona, researchers show that a series of calponin/transgelin family genes (tagln-r.b, tagln-r.c, tagln-r.d, tagln-r.e) are expressed in the Ciona floor plate, notochord, and endodermal strand (the Ciona analogue for the hypochord), indicating that Tagln expression in midline structures may have a conserved role in embryogenesis.49 As Tagln is known primarily as an actin-binding protein in contractile cells, the role of Tagln in these non-contractile, non-muscular, primitive midline structures remains unknown.
Additionally, we note a tagln single-positive population of elongated cells along the midline beginning at 3 dpf that accumulates between the notochord and neural tube—immediately ventral to the medial floor plate cells (Fig. 12E–K, open arrows in F–J). This population appears to organize as a continuous, thin, rod-like structure that is primarily one cell in width and height. We confirmed that this tagln-positive midline cell population likely originates from the sclerotome—unlike the adjacent medial floor plate—as evidenced by twist1a expression (Fig. 12N,O, magenta arrow highlights the MFP, open arrow highlights the midline cell). Though this structure’s function is unknown, its location would suggest that it may exist as a cushion or as structural support at the notochord-neural tube interface.
Finally, we observed a cell population—which we will term a mural cell progenitor population—near the notochord-neural tube interface that borders either side of the midline (Fig. 12A’–I’, yellow arrows in B–J), is twist1a-positive (Fig. 12L’,N’, yellow arrows in M,O) suggesting a sclerotome origin, and makes contact with and aligns along the ISVs (Fig. 12P–S, white arrows). At 1 dpf, these cells expressed tagln, but not pdgfrb (Fig. 12A’), and at 2 dpf, a fraction of these cells began to express pdgfrb (Fig. 12C’). Over the next 3 days these cells elongated and increased pdgfrb expression until approximately half were pdgfrb/tagln double-positive at 5 dpf (Fig. 12E’,G’,I’).
To gain a better understanding of where these cells reside structurally, and due to this mural cell progenitor population’s proximity to the notochord and floor plate, we questioned whether they shared markers with or were located within either of these structures. Using a sonic hedgehog signaling molecule a (shha) transgenic line to label the floor plate,50,51 we were able to visualize the mural cell progenitor population as sitting outside of the neural tube (Fig. 13A,B). Next, we used a procollagen, type IX, alpha 2 (col9a2) transgenic line to visualize notochord sheath cells in relation to the progenitor population.52 Notochord sheath cells are reported to express tagln in the notochord bud during regeneration53; therefore, we wanted to determine if the sheath cells contributed to the mural cell progenitor population. The mural cell progenitor population did not overlap with notochord sheath cells (Fig. 13C,D), though we confirm that sheath cells do express low levels of tagln during development (Fig. 13E). Finally, we used the sox10 transgenic line54 to determine if there were neural crest contributions to this novel mural cell progenitor population. While sox10-positive cells could be seen in the nearby neural tube, the mural cell progenitor population was sox10-negative (Fig. 13F,G). Jointly, these data showed that the mural cell progenitor population abuts the neural tube and notochord, but does not overlap with these structures, and is likely not derived from the neural crest.
Figure 13. The mural cell progenitor population resides between the notochord and neural tube, is sox10-negative, and does not need to contact endothelium to upregulate pdgfrb.

(A,B) Single-plane images of Tg(−2.4shha-ABC:GFP); Tg(pdgfrb:Gal4FF; UAS:RFP) zebrafish to visualize the medial floor plate cells (shha, green) and the MC progenitor population (pdgfrb, magenta) at 5 dpf. The sagittal (A) and orthogonal (B) views show the MC progenitors outside of the neural tube. (B’) Schematic detailing the structures in panel B. (C-E) Single-plane images of Tg(tagln:NLS-EGFP); Tg(col9a2:mCherry) zebrafish to visualize the notochord sheath cells (col9a2, magenta) and the MC progenitor population (tagln, green) at 3 dpf. The sagittal (C) and orthogonal (D) views show the MC progenitors outside of the notochord. (D’) Schematic detailing the structures in panel D. (E,E’) Notochord sheath cells (white arrows) express low levels of tagln. (F,G) Single-plane images of Tg(tagln:NLS-EGFP); Tg(sox10:mRFP) zebrafish to visualize the neural crest marker sox10 (magenta) and the MC progenitor population (tagln, green) at 2 dpf (F) and 5 dpf (G). MC progenitor cells do not express sox10 at early developmental stages, suggesting that they do not arise from neural crest populations. (H) Maximum intensity projection image of Tg(tagln:NLS-EGFP); Tg(kdrl:mCherry-CAAX) zebrafish to visualize endothelial cells (kdrl, magenta) and the MC progenitor population (tagln, green) at 3 dpf. The MC progenitor population (outlined with a white dotted line) is not adjacent or parallel to a blood vessel. (H’) Single-plane image showing the MC progenitor population from panel H without the skeletal muscle. (I,J) Maximum intensity projection images of Tg(tagln:NLS-EGFP); Tg(pdgfrb:Gal4FF; UAS:RFP) zebrafish at 2 dpf (I) and 3 dpf (J). ISVs are outlined with white dotted lines and were identified from brightfield images. MC progenitor cells upregulate pdgfrb expression (magenta, yellow arrows) without contact with the endothelium. Images are representative of n=4 (5 dpf; shha), n=6 (3 dpf; col9a2), n=6 (2 dpf; sox10), n=6 (5 dpf; sox10), n=3 (3 dpf; kdrl), n=6 (2 dpf; tagln/pdgfrb), and n=6 (3 dpf; tagln/pdgfrb) for a total of 37 embryos analyzed. MC, mural cell. MFP, medial floor plate. Scale bars: 50 μm unless otherwise indicated.
In order to further understand the source and migration potential of this mural cell progenitor population, we performed time-lapse imaging. This analysis revealed that tagln-low cells migrate dorsally from 1 to 2 dpf to reach the notochord-neural tube interface and contribute to the mural cell progenitor population at the midline (Movie 3). These cells can then migrate or extend to contact the nearby ISVs, as seen in movies collected from 2 to 3 dpf (Movie 4). Importantly, the mural cell progenitor population is not the exclusive source of mural cells to the ISVs, as other tagln-positive cells from the regions surrounding or adjacent to the notochord are also able to migrate to the ISVs as seen in movies collected from 3 to 4 dpf (Movie 5). However, live imaging of the mural cell progenitor population confirms 1) cell migration, likely from the sclerotome given twist1a co-expression, 2) the assembly and organization of these cells at the notochord-neural tube interface, and 3) their motility to and association with ISVs over time.
Perhaps the most intriguing aspect of the mural cell progenitor population is how it expresses tagln before upregulating pdgfrb. Since Notch signaling from arterial endothelium has been shown to be involved in maturation of mural cell progenitors to pdgfrb-high mural cells,22 we wondered if the mural cell progenitor population could be in contact with a blood vessel along the midline that would induce an increase in pdgfrb expression. However, there is no blood vessel present along the midline at this time point (Fig. 13H), nor do cells that increase pdgfrb expression in the progenitor population necessarily reside near an ISV (Fig. 13I,J). This suggests that the induction of pdgfrb expression in this mural cell progenitor population is not controlled by contact with the arterial vasculature. A visual summary of the structures and results described in this section can be found in Figure 14.
Figure 14: Summary of the midline cell populations at the notochord-neural tube interface.

We identify medial floor plate cells as pdgfrb/tagln double-positive in early zebrafish development (MFP). Additionally, we observe a tagln single-positive population of cells along the midline that accumulates below the medial floor plate cells beginning at 3 dpf (tagln+ Midline Cells). Finally, we describe a mural cell progenitor population near the notochord-neural tube interface that borders either side of the midline. This population—which begins as tagln single-positive cells before acquiring pdgfrb expression—can be observed migrating to the nearby ISVs (MC Progenitor Population). Schematic created with BioRender.com. ISV, intersegmental vessel. MC, mural cell. MFP, medial floor plate. NC, notochord. NT, neural tube.
Validation and Future Considerations
Transgenic lines are some of the most powerful tools currently used in understanding zebrafish biology. Importantly, several factors affect the accuracy and intensity of transgenic reporter lines and should be considered when using these tools. Considerations include the promoter/enhancer region used to drive fluorophore expression, the integration site, and the targeted localization of the fluorophore (i.e. cytosolic vs. nuclear). For example, transgenic lines with different integration sites may experience different transcriptional silencing or enhancing based on nearby genomic regions.55 Thus, discoveries made with new transgenic lines may need to be validated by comparative analysis with previously established lines or through other biochemical methods.
In this study, to rule out whether these novel expression patterns were an artifact of the nuclear-GFP tagln reporter, we sought to confirm tagln expression in the structures we have described using an independently generated cytosolic-GFP tagln reporter, Tg(tagln:EGFP).17 Both tagln reporter lines utilize a 600 bp enhancer fragment of the tagln promoter to drive fluorophore expression.17 Seiler et al shows that this enhancer fragment is sufficient to recapitulate expression patterns of endogenous tagln mRNA in zebrafish embryos.17
While the Tg(tagln:EGFP) transgenic line utilizes the same promoter region as the Tg(tagln:NLS-EGFP) line,5 it has an independent integration site and no nuclear-localization signal. As expected, GFP expression in the skeletal muscle decreased the efficiency and resolution of identifying tagln-positive cells in the trunk, though we were able to visualize GFP expression in the hypochord, ISV mural cells, the novel mural cell progenitor population, the medial floor plate, and tagln-positive midline cells (Fig. 15A–H). Thus, despite high background GFP signal, we validate tagln expression in these structures using the cytosolic-GFP tagln reporter. Of note, the tagln reporter created by Ando et al—which utilizes a 25 kilobase BAC containing the tagln promoter region—also shows tagln expression in the medial floor plate,12 and in the cells on the dorsal side of the DA.23 This line, TgBAC(tagln:EGFP), contains regulatory regions which may not be present within the 600 bp minimal tagln enhancer region, yet expression patterns remain consistent between all three tagln reporter lines.
Figure 15. Visualizing tagln expression using an independent cytosolic-GFP tagln reporter line.

Confocal images of Tg(tagln:eGFP); Tg(pdgfrb:Gal4FF; UAS:RFP) zebrafish at 2 dpf (A-D) and 4 dpf (E-H). tagln expression was evident in the hypochord and vSMC populations of the dorsal aorta (A,E). GFP expression in the skeletal muscle decreases the resolution of tagln-positive cells in the trunk, though we were able to visualize tagln-high mural cells on the ISVs by 4 dpf (B,F). Despite high background, GFP signal was also detectable in the MC progenitor population and the medial floor plate cells (C,D,G,H). We observed intense GFP expression in the tagln-positive midline cells by 4 dpf (H). Thus, we are able to confirm tagln expression in these structures using an independent transgenic line, the cytosolic-GFP tagln reporter. Images are representative of n=4 (2 dpf) and n=4 (4 dpf) for a total of 8 embryos analyzed. ISVs, intersegmental vessels. MC, mural cell. Scale bars: 50 μm.
Since tagln is regarded as a mature vSMC marker and pdgfrb is typically associated with precursor populations, the findings reported here suggest that the expression patterns related to mural cell maturation are more nuanced than previously reported. We initially hypothesized that upregulation of pdgfrb conferred motility cues to the mural cell progenitors to then migrate to blood vessels; however, tagln single-positive cells were observed successfully migrating to ISVs, so pdgfrb upregulation does not appear to be essential for this process. Therefore, we ask: what role could Tagln play prior to Pdgfrb upregulation? Several studies report that Tagln assists in cell motility: loss of Tagln decreases motility,56 whereas overexpression leads to pathological motility in situations such as metastatic cancer.57,58 Since sclerotome cells are inherently migratory as they populate and form various tissues, this could help explain the early expression of Tagln in mural cell precursors during embryogenesis. Further studies are needed to determine the mechanisms behind this seemingly stochastic pdgfrb upregulation and how it may assist in mural cell progenitor migration and function. Understanding how mural cells that express tagln prior to pdgfrb—like in the midline region—differ from those that follow the classical pdgfrb to tagln pattern—such as those in the mid- and hindbrain—will further our understanding of the site-specific and temporal regulation of mural cell biology.
Experimental Procedures:
Zebrafish
Zebrafish (Danio rerio) embryos were raised and maintained as described.59,60 Zebrafish husbandry and research protocols were reviewed and approved by the WUSTL Animal Care and Use Committee (Animal Welfare Assurance #D16–00245, Protocol No. 21–0313). Established transgenic lines that were used in this study are listed in the table below.
| Genotype | Allele | Origin |
|---|---|---|
| Tg(−2.4shha-ABC:GFP) | sb15 | Shkumatava, et al.50 |
| Tg(col9a2:mCherry) | pd1150 | Garcia, et al.52 |
| Tg(kdrl:mCherry-CAAX) | y171 | Fujita, et al.20 |
| Tg(Ola.Twist:GAL4) | sq11 | Lee, et al.33 |
| Tg(sox10:mRFP) | vu234 | Kucenas, et al.54 |
| Tg(tagln:eGFP) | p151 | Seiler, et al.17 |
| Tg(tagln:NLS-EGFP-2A-CFP-FTASE) | y450 | Stratman, et al.5 |
| Tg(5xUAS:EGFP) | zf82 | Asakawa, et al.61 |
| Tg(5xUAS:RFP) | zf83 | Asakawa, et al.61 |
| TgBAC(pdgfrb:Gal4FF) | ncv24 | Ando, et al.12 |
Both the cytoplasmic and nuclear tagln reporter lines utilize approximately 600 base pairs (bp) of the tagln promoter to drive fluorophore expression.5,17 Identified by Seiler et al, this promoter fragment is an evolutionary conserved region located directly upstream of exon 1 in the tagln locus.17 The conserved region acts as a regulatory enhancer element for tagln expression and—when used to drive reporter expression—is sufficient to recapitulate expression patterns of endogenous tagln mRNA in zebrafish.17
To drive Gal4FF expression, the pdgfrb reporter line utilizes a region directly upstream of the start codon in the pdgfrb locus that is approximately 36,000 bp in length.12 Ando et al show that this genomic region is a sufficient driver for labeling pdgfrb-positive cells as determined by mRNA analysis of FACS-isolated cells.12
Image Acquisition and Processing
Embryos and larvae were anesthetized in buffered 0.2 mg/mL Tricaine-S (Western Chemical, Inc; NC0872873) and mounted in 0.8% low-melting point agarose (IBI Scientific; #IB70056) on a 35-mm glass-bottom petri dish (MatTek; #P35G-1.5-20-C). Confocal images were obtained using a 4x or 40x objective with a W1 Spinning Disk confocal microscope, a Fusion camera, and the Nikon Eclipse Ti2-E base. Images were then deconvolved using Nikon’s NIS-Elements software. Fiji image processing software was used for counting number of cells per vessel length and for generating final images. Embryos were consistently imaged in the afternoon hours, thus: ‘1 dpf’ represents embryos between 28–34 hours post-fertilization (hpf); ‘2 dpf’ represents 52–58 hpf; ‘3 dpf’ represents 76–82 hpf; ‘4 dpf’ represents 100–106 hpf; ‘5 dpf’ represents 124–130 hpf.
Evans Blue Dye Injections
Embryos and larvae were anesthetized in buffered 0.2 mg/mL Tricaine-S and mounted in 0.8% low-melting point agarose on a 35-mm glass-bottom petri dish. Evans Blue dye (50 mg/mL in H2O; Fisher Scientific, #E515) was injected into the sinus venosus of zebrafish embryos at time points 1 to 5 dpf to label the vasculature. Confocal images were obtained using a 40x objective with the W1 Spinning Disk confocal microscope within 30 minutes of injection. The Cy5 channel was used to image the Evans Blue. During image processing, the Fiji “subtract background” function was used for the Cy5 channel to clarify the vasculature.
Time-lapse Imaging and Processing
Embryos and larvae were anesthetized in buffered 0.1 mg/mL Tricaine-S and mounted in 0.4% low-melting point agarose on a 35-mm glass-bottom petri dish. Embryos were embedded with their tail freed to facilitate continued growth. Images were acquired every 20 min for the desired time course. Fiji image processing software and Apple iMovie were used for generating final movies.
Embryos were time-lapse imaged overnight for time courses that ranged between 4.5 and 18 hours (the average time-lapse length was 12.1 hours). Apoptotic and mitotic hypochord cells were identified by the division or loss of tagln-positive nuclei. Percentages were calculated by dividing the cell apoptosis/mitosis number by the total number of hypochord cells present in the frame. Each frame encapsulated approximately 500–750 μm of the hypochord.
Rigor and Reproducibility
Embryo sample numbers are indicated in all figure legends. Embryos from at least two independent clutches were used to analyze each developmental timepoint, and embryos were euthanized after imaging and not used for consecutive days. A total of 203 embryos were imaged and used in this study.
Supplementary Material
Movie 1. A 3D view of pdgfrb and tagln expression in the hypochord.
Movie of rotating 3D projections. Projections were made from confocal z-stacks of the hypochord in Tg(tagln:NLS-EGFP); Tg(pdgfrb:Gal4FF; UAS:RFP) zebrafish. pdgfrb expression decreases between 1–4 dpf, while cells of the hypochord elongate along the dorsal aorta. Images are representative of n=12 (1 dpf), n=6 (2 dpf), n=6 (3 dpf), and n=12 (4 dpf), for a total of 36 embryos analyzed. Scale bar: 50 μm.
Movie 2. Hypochord cells infrequently undergo apoptosis and mitosis up to 4 dpf, and do not disappear as previously reported.
Confocal time-lapse movie from Tg(tagln:NLS-EGFP); Tg(pdgfrb:Gal4FF; UAS:RFP) zebrafish shows the hypochord cells from 3 separate embryos between 1 and 4 dpf (38–48 hpf, 62–72 hpf, and 81–89 hpf) with sporadic apoptosis and mitosis events (pdgfrb is magenta, tagln is green). Yellow arrows indicate apoptotic cells, white arrows indicate mitotic cells. Movies are representative of n=6 (1.5 dpf), n=6 (2.5 dpf), and n=6 (3.5 dpf) for a total of 18 embryos analyzed by time-lapse microscopy. Scale bar: 100 μm.
Movie 3. Proliferative tagln-low cells migrate from 1.5 to 2 dpf to the dorsal side of the notochord and adjacent to the medial floor plate to form the MC progenitor population.
Confocal time-lapse movie from Tg(tagln:NLS-EGFP); Tg(pdgfrb:Gal4FF; UAS:RFP) zebrafish shows tagln-low cells that migrate dorsally to the top of the notochord (pdgfrb is magenta, tagln is white, migrating cells are pseudo-colored yellow). Cell A undergoes mitosis, then one daughter cell migrates dorsally. Cell B migrates dorsally then undergoes mitosis to contribute two cells to the MC progenitor population. Cell C resides on the dorsal side of the notochord and undergoes mitosis, increasing the cell number of the MC progenitor population. Movie is representative of n=4 embryos imaged from 1.5 to 2 dpf. MC, mural cell. MFP, medial floor plate. Scale bar: 20 μm.
Movie 4. tagln-positive cells from the MC progenitor population migrate or extend to make contact with nearby ISVs at 2.5 to 3 dpf.
Confocal time-lapse movie from Tg(tagln:NLS-EGFP); Tg(pdgfrb:Gal4FF; UAS:RFP) zebrafish shows tagln-positive cells at the notochord-neural tube interface that migrate or extend to make contact with ISVs (pdgfrb is magenta, tagln is white, moving cells are pseudo-colored yellow). Cell A migrates to the cover the ISV while cell B stretches to make contact with the ISV. Movie is representative of n=6 embryos imaged from 2.5 to 3 dpf. ISV, intersegmental vessel. MC, mural cell. Scale bar: 20 μm.
Movie 5. tagln single-positive and tagln/pdgfrb double-positive cells continue to populate the MC progenitor population in addition to migrating to ISVs at 3.5 to 4 dpf.
Confocal time-lapse movie from Tg(tagln:NLS-EGFP); Tg(pdgfrb:Gal4FF; UAS:RFP) zebrafish shows tagln-positive cells (yellow pseudo-color) and tagln/pdgfrb double-positive cells (cyan pseudo-color) that migrate to the notochord-neural tube interface or to nearby ISVs (pdgfrb is magenta, tagln is white). Cell A undergoes mitosis, and one daughter cell contacts the ISV. Cell B moves to cover the ISV while cell C migrates dorsally to populate the MC progenitor population. Movie is representative of n=2 embryos imaged from 3.5 to 4 dpf. ISV, intersegmental vessel. MC, mural cell. Scale bar: 20 μm.
Acknowledgements:
We thank Tony Tsai’s lab for the Tg(−2.4shha-ABC:GFP) line, Shawn Burgess’s lab for the Tg(col9a2:mCherry) line, and Mayssa Mokalled’s lab for the Tg(sox10:mRFP) line. Figure schematics were generated using BioRender.com.
Grant Sponsor and Number:
This work was supported by grants from the NIH/NIGMS R35 GM137976 (A.N.S.); Children’s Discovery Institute of Washington University and St. Louis Children’s Hospital (A.N.S.); the Washington University Institute of Clinical and Translational Sciences which is, in part, supported by the NIH/National Center for Advancing Translational Sciences (NCATS), CTSA grant #UL1TR002345 (A.N.S.); and American Heart Association Postdoctoral Fellowship Award #906436 (S.C.).
Footnotes
Competing Interests:
The authors declare that they have no conflicts of interest.
References:
- 1.Armulik A, Abramsson A, Betsholtz C. Endothelial/Pericyte Interactions. Circulation Research. 2005;97(6):512–523. 10.1161/01.RES.0000182903.16652.d7. [DOI] [PubMed] [Google Scholar]
- 2.Donadon M, Santoro MM. The origin and mechanisms of smooth muscle cell development in vertebrates. Development. 2021;148(7). 10.1242/dev.197384. [DOI] [PubMed] [Google Scholar]
- 3.Owens GK, Kumar MS, Wamhoff BR. Molecular Regulation of Vascular Smooth Muscle Cell Differentiation in Development and Disease. Physiological Reviews. 2004;84(3):767–801. 10.1152/physrev.00041.2003. [DOI] [PubMed] [Google Scholar]
- 4.Holm A, Heumann T, Augustin HG. Microvascular Mural Cell Organotypic Heterogeneity and Functional Plasticity. Trends in Cell Biology. 2018;28(4):302–316. 10.1016/j.tcb.2017.12.002. [DOI] [PubMed] [Google Scholar]
- 5.Stratman AN, Pezoa SA, Farrelly OM, et al. Interactions between mural cells and endothelial cells stabilize the developing zebrafish dorsal aorta. Development. 2017;144(1):115–127. 10.1242/dev.143131. [DOI] [PMC free article] [PubMed] [Google Scholar]
- 6.Hellstrom M, Kal n M, Lindahl P, Abramsson A, Betsholtz C. Role of PDGF-B and PDGFR-beta in recruitment of vascular smooth muscle cells and pericytes during embryonic blood vessel formation in the mouse. Development. 1999;126(14):3047–3055. [DOI] [PubMed] [Google Scholar]
- 7.Ando K, Shih Y-H, Ebarasi L, et al. Conserved and context-dependent roles for pdgfrb signaling during zebrafish vascular mural cell development. Dev Biol. 2021/November/01/ 2021;479:11–22. 10.1016/j.ydbio.2021.06.010. [DOI] [PMC free article] [PubMed] [Google Scholar]
- 8.Leonard EV, Figueroa RJ, Bussmann J, Lawson ND, Amigo JD, Siekmann AF. Regenerating vascular mural cells in zebrafish fin blood vessels are not derived from pre-existing mural cells and differentially require Pdgfrb signalling for their development. Development. 2022;149(7). 10.1242/dev.199640. [DOI] [PMC free article] [PubMed] [Google Scholar]
- 9.Stratman AN, Burns MC, Farrelly OM, et al. Chemokine mediated signalling within arteries promotes vascular smooth muscle cell recruitment. Commun Biol. Dec 4 2020;3(1):734. 10.1038/s42003-020-01462-7. [DOI] [PMC free article] [PubMed] [Google Scholar]
- 10.Smith CL, Tallquist MD. PDGF function in diverse neural crest cell populations. Cell Adh Migr. Oct-Dec 2010;4(4):561–6. 10.4161/cam.4.4.12829. [DOI] [PMC free article] [PubMed] [Google Scholar]
- 11.Majesky MW. Developmental Basis of Vascular Smooth Muscle Diversity. Arteriosclerosis, Thrombosis, and Vascular Biology. 2007;27(6):1248–1258. 10.1161/ATVBAHA.107.141069. [DOI] [PubMed] [Google Scholar]
- 12.Ando K, Fukuhara S, Izumi N, et al. Clarification of mural cell coverage of vascular endothelial cells by live imaging of zebrafish. Development. 2016;143(8):1328–1339. 10.1242/dev.132654. [DOI] [PMC free article] [PubMed] [Google Scholar]
- 13.Shih Y-H, Portman D, Idrizi F, Grosse A, Lawson ND. Integrated molecular analysis identifies a conserved pericyte gene signature in zebrafish. Development. 2021;148(23). 10.1242/dev.200189. [DOI] [PMC free article] [PubMed] [Google Scholar]
- 14.Chakraborty R, Saddouk FZ, Carrao AC, Krause DS, Greif DM, Martin KA. Promoters to Study Vascular Smooth Muscle. Arteriosclerosis, Thrombosis, and Vascular Biology. 2019;39(4):603–612. 10.1161/ATVBAHA.119.312449. [DOI] [PMC free article] [PubMed] [Google Scholar]
- 15.Santoro MM, Pesce G, Stainier DY. Characterization of vascular mural cells during zebrafish development. Mech Dev. Aug-Sep 2009;126(8–9):638–49. 10.1016/j.mod.2009.06.1080. [DOI] [PMC free article] [PubMed] [Google Scholar]
- 16.Rensen SS, Doevendans PA, van Eys GJ. Regulation and characteristics of vascular smooth muscle cell phenotypic diversity. Neth Heart J. 2007;15(3):100–8. 10.1007/bf03085963. [DOI] [PMC free article] [PubMed] [Google Scholar]
- 17.Seiler C, Abrams J, Pack M. Characterization of zebrafish intestinal smooth muscle development using a novel sm22α-b promoter. Developmental Dynamics. 2010;239(11):2806–2812. 10.1002/dvdy.22420. [DOI] [PMC free article] [PubMed] [Google Scholar]
- 18.Li L, Miano JM, Cserjesi P, Olson EN. SM22α, a Marker of Adult Smooth Muscle, Is Expressed in Multiple Myogenic Lineages During Embryogenesis. Circulation Research. 1996;78(2):188–195. 10.1161/01.RES.78.2.188. [DOI] [PubMed] [Google Scholar]
- 19.Ulrich F, Ma L-H, Baker RG, Torres-Vázquez J. Neurovascular development in the embryonic zebrafish hindbrain. Dev Biol. 2011/September/01/ 2011;357(1):134–151. 10.1016/j.ydbio.2011.06.037. [DOI] [PubMed] [Google Scholar]
- 20.Fujita M, Cha YR, Pham VN, et al. Assembly and patterning of the vascular network of the vertebrate hindbrain. Development. 2011;138(9):1705–1715. 10.1242/dev.058776. [DOI] [PMC free article] [PubMed] [Google Scholar]
- 21.Isogai S, Horiguchi M, Weinstein BM. The Vascular Anatomy of the Developing Zebrafish: An Atlas of Embryonic and Early Larval Development. Dev Biol. 2001/February/15/ 2001;230(2):278–301. 10.1006/dbio.2000.9995. [DOI] [PubMed] [Google Scholar]
- 22.Ando K, Wang W, Peng D, et al. Peri-arterial specification of vascular mural cells from naïve mesenchyme requires Notch signaling. Development. 2019;146(2). 10.1242/dev.165589. [DOI] [PMC free article] [PubMed] [Google Scholar]
- 23.Ando K, Ishii T, Fukuhara S. Zebrafish Vascular Mural Cell Biology: Recent Advances, Development, and Functions. Life (Basel). Oct 3 2021;11(10). 10.3390/life11101041. [DOI] [PMC free article] [PubMed] [Google Scholar]
- 24.Wang Y, Pan L, Moens CB, Appel B. Notch3 establishes brain vascular integrity by regulating pericyte number. Development. 2014;141(2):307–317. 10.1242/dev.096107. [DOI] [PMC free article] [PubMed] [Google Scholar]
- 25.Whitesell TR, Kennedy RM, Carter AD, et al. An α-smooth muscle actin (acta2/αsma) zebrafish transgenic line marking vascular mural cells and visceral smooth muscle cells. PLoS One. 2014;9(3):e90590. 10.1371/journal.pone.0090590. [DOI] [PMC free article] [PubMed] [Google Scholar]
- 26.Ulvmar MH, Martinez-Corral I, Stanczuk L, Mäkinen T. Pdgfrb-Cre targets lymphatic endothelial cells of both venous and non-venous origins. genesis. 2016;54(6):350–358. 10.1002/dvg.22939. [DOI] [PMC free article] [PubMed] [Google Scholar]
- 27.Rolny C, Nilsson I, Magnusson P, et al. Platelet-derived growth factor receptor-β promotes early endothelial cell differentiation. Blood. 2006;108(6):1877–1886. 10.1182/blood-2006-04-014894. [DOI] [PubMed] [Google Scholar]
- 28.Wasteson P, Johansson BR, Jukkola T, et al. Developmental origin of smooth muscle cells in the descending aorta in mice. Development. 2008;135(10):1823–1832. 10.1242/dev.020958. [DOI] [PubMed] [Google Scholar]
- 29.Eriksson J, Löfberg J. Development of the hypochord and dorsal aorta in the zebrafish embryo (Danio rerio). Journal of Morphology. 2000;244(3):167–176. . [DOI] [PubMed] [Google Scholar]
- 30.Cleaver O, Seufert DW, Krieg PA. Endoderm patterning by the notochord: development of the hypochord in Xenopus. Development. 2000;127(4):869–879. 10.1242/dev.127.4.869. [DOI] [PubMed] [Google Scholar]
- 31.Löfberg J, Collazo A. Hypochord, an enigmatic embryonic structure: Study of the axolotl embryo. Journal of Morphology. 1997;232(1):57–66. . [DOI] [PubMed] [Google Scholar]
- 32.Wiens KM, Lee HL, Shimada H, Metcalf AE, Chao MY, Lien C-L. Platelet-Derived Growth Factor Receptor β Is Critical for Zebrafish Intersegmental Vessel Formation. PLoS One. 2010;5(6):e11324. 10.1371/journal.pone.0011324. [DOI] [PMC free article] [PubMed] [Google Scholar]
- 33.Lee RTH, Knapik EW, Thiery JP, Carney TJ. An exclusively mesodermal origin of fin mesenchyme demonstrates that zebrafish trunk neural crest does not generate ectomesenchyme. Development. 2013;140(14):2923–2932. 10.1242/dev.093534. [DOI] [PMC free article] [PubMed] [Google Scholar]
- 34.Row RH, Tsotras SR, Goto H, Martin BL. The zebrafish tailbud contains two independent populations of midline progenitor cells that maintain long-term germ layer plasticity and differentiate in response to local signaling cues. Development. Jan 15 2016;143(2):244–54. 10.1242/dev.129015. [DOI] [PMC free article] [PubMed] [Google Scholar]
- 35.Latimer AJ, Appel B. Notch signaling regulates midline cell specification and proliferation in zebrafish. Dev Biol. 2006/October/15/ 2006;298(2):392–402. 10.1016/j.ydbio.2006.05.039. [DOI] [PubMed] [Google Scholar]
- 36.Tani S, Chung U-i, Ohba S, Hojo H. Understanding paraxial mesoderm development and sclerotome specification for skeletal repair. Experimental & Molecular Medicine. 2020/August/01 2020;52(8):1166–1177. 10.1038/s12276-020-0482-1. [DOI] [PMC free article] [PubMed] [Google Scholar]
- 37.Peyrot SM, Wallingford JB, Harland RM. A revised model of Xenopus dorsal midline development: Differential and separable requirements for Notch and Shh signaling. Dev Biol. 2011/April/15/ 2011;352(2):254–266. 10.1016/j.ydbio.2011.01.021. [DOI] [PMC free article] [PubMed] [Google Scholar]
- 38.Poole TJ, Finkelstein EB, Cox CM. The role of FGF and VEGF in angioblast induction and migration during vascular development. Developmental Dynamics. 2001;220(1):1–17. . [DOI] [PubMed] [Google Scholar]
- 39.Wlizla M, Zorn AM. Chapter 13 - Vertebrate Endoderm Formation. In: Moody SA, ed. Principles of Developmental Genetics (Second Edition). Oxford: Academic Press; 2015:237–253. [Google Scholar]
- 40.Stickney HL, Barresi MJF, Devoto SH. Somite development in zebrafish. Developmental Dynamics. 2000;219(3):287–303. . [DOI] [PubMed] [Google Scholar]
- 41.Tsuji-Tamura K, Morino-Koga S, Suzuki S, Ogawa M. The canonical smooth muscle cell marker TAGLN is present in endothelial cells and is involved in angiogenesis. Journal of Cell Science. 2021;134(15). 10.1242/jcs.254920. [DOI] [PubMed] [Google Scholar]
- 42.Isogai S, Lawson ND, Torrealday S, Horiguchi M, Weinstein BM. Angiogenic network formation in the developing vertebrate trunk. Development. 2003;130(21):5281–5290. 10.1242/dev.00733. [DOI] [PubMed] [Google Scholar]
- 43.Weijts B, Gutierrez E, Saikin SK, et al. Blood flow-induced Notch activation and endothelial migration enable vascular remodeling in zebrafish embryos. Nat Commun. Dec 14 2018;9(1):5314. 10.1038/s41467-018-07732-7. [DOI] [PMC free article] [PubMed] [Google Scholar]
- 44.Rajan AM, Ma RC, Kocha KM, Zhang DJ, Huang P. Dual function of perivascular fibroblasts in vascular stabilization in zebrafish. PLOS Genetics. 2020;16(10):e1008800. 10.1371/journal.pgen.1008800. [DOI] [PMC free article] [PubMed] [Google Scholar]
- 45.Ma RC, Jacobs CT, Sharma P, Kocha KM, Huang P. Stereotypic generation of axial tenocytes from bipartite sclerotome domains in zebrafish. PLoS Genet. Nov 2018;14(11):e1007775. 10.1371/journal.pgen.1007775. [DOI] [PMC free article] [PubMed] [Google Scholar]
- 46.Ma RC, Kocha KM, Méndez-Olivos EE, Ruel TD, Huang P. Origin and diversification of fibroblasts from the sclerotome in zebrafish. Dev Biol. 2023/June/01/ 2023;498:35–48. 10.1016/j.ydbio.2023.03.004. [DOI] [PubMed] [Google Scholar]
- 47.Zheng P, Xie H, Zhu P, Zhao C. Distribution and characteristics of neurons at the nerve base plate of zebrafish. Heredity. 2022-June-20 2022;44(6):510–520. 10.16288/j.yczz.22-074. [DOI] [Google Scholar]
- 48.Strähle U, Lam CS, Ertzer R, Rastegar S. Vertebrate floor-plate specification: variations on common themes. Trends in Genetics. 2004/March/01/ 2004;20(3):155–162. 10.1016/j.tig.2004.01.002. [DOI] [PubMed] [Google Scholar]
- 49.Oonuma K, Yamamoto M, Moritsugu N, et al. Evolution of Developmental Programs for the Midline Structures in Chordates: Insights From Gene Regulation in the Floor Plate and Hypochord Homologues of Ciona Embryos. Front Cell Dev Biol. 2021;9:704367. 10.3389/fcell.2021.704367. [DOI] [PMC free article] [PubMed] [Google Scholar]
- 50.Shkumatava A, Fischer S, Müller F, Strahle U, Neumann CJ. Sonic hedgehog, secreted by amacrine cells, acts as a short-range signal to direct differentiation and lamination in the zebrafish retina. Development. 2004;131(16):3849–3858. 10.1242/dev.01247. [DOI] [PubMed] [Google Scholar]
- 51.Ertzer R, Müller F, Hadzhiev Y, et al. Cooperation of sonic hedgehog enhancers in midline expression. Dev Biol. 2007/January/15/ 2007;301(2):578–589. 10.1016/j.ydbio.2006.11.004. [DOI] [PubMed] [Google Scholar]
- 52.Garcia J, Bagwell J, Njaine B, et al. Sheath Cell Invasion and Trans-differentiation Repair Mechanical Damage Caused by Loss of Caveolae in the Zebrafish Notochord. Current Biology. 2017/July/10/ 2017;27(13):1982–1989.e3. 10.1016/j.cub.2017.05.035. [DOI] [PMC free article] [PubMed] [Google Scholar]
- 53.Sinclair JW, Hoying DR, Bresciani E, et al. The Warburg effect is necessary to promote glycosylation in the blastema during zebrafish tail regeneration. NPJ Regen Med. Sep 13 2021;6(1):55. 10.1038/s41536-021-00163-x. [DOI] [PMC free article] [PubMed] [Google Scholar]
- 54.Kucenas S, Takada N, Park H-C, Woodruff E, Broadie K, Appel B. CNS-derived glia ensheath peripheral nerves and mediate motor root development. Nature Neuroscience. 2008/February/01 2008;11(2):143–151. 10.1038/nn2025. [DOI] [PMC free article] [PubMed] [Google Scholar]
- 55.Wilson C, Bellen HJ, Gehring WJ. Position Effects on Eukaryotic Gene Expression. Annual Review of Cell Biology. 1990;6(1):679–714. 10.1146/annurev.cb.06.110190.003335. [DOI] [PubMed] [Google Scholar]
- 56.Elsafadi M, Manikandan M, Dawud RA, et al. Transgelin is a TGFβ-inducible gene that regulates osteoblastic and adipogenic differentiation of human skeletal stem cells through actin cytoskeleston organization. Cell Death Dis. Aug 4 2016;7(8):e2321. 10.1038/cddis.2016.196. [DOI] [PMC free article] [PubMed] [Google Scholar]
- 57.Zhou H-m, Fang Y-y, Weinberger PM, et al. Transgelin increases metastatic potential of colorectal cancer cells in vivo and alters expression of genes involved in cell motility. BMC Cancer. 2016/February/04 2016;16(1):55. 10.1186/s12885-016-2105-8. [DOI] [PMC free article] [PubMed] [Google Scholar]
- 58.Chen Z, He S, Zhan Y, et al. TGF-b-induced transgelin promotes bladder cancer metastasis by regulating epithelial-mesenchymal transition and invadopodia formation. eBioMedicine. 2019;47:208–220. 10.1016/j.ebiom.2019.08.012. [DOI] [PMC free article] [PubMed] [Google Scholar]
- 59.Westerfield M. The zebrafish book. A guide for the laboratory use of zebrafish (Danio rerio). 4th ed. ed. Eugene: Univ. of Oregon Press; 2000. [Google Scholar]
- 60.Kimmel CB, Ballard WW, Kimmel SR, Ullmann B, Schilling TF. Stages of embryonic development of the zebrafish. Dev Dyn. Jul 1995;203(3):253–310. 10.1002/aja.1002030302. [DOI] [PubMed] [Google Scholar]
- 61.Asakawa K, Suster ML, Mizusawa K, et al. Genetic dissection of neural circuits by Tol2 transposon-mediated Gal4 gene and enhancer trapping in zebrafish. Proceedings of the National Academy of Sciences. 2008;105(4):1255–1260. 10.1073/pnas.0704963105. [DOI] [PMC free article] [PubMed] [Google Scholar]
Associated Data
This section collects any data citations, data availability statements, or supplementary materials included in this article.
Supplementary Materials
Movie 1. A 3D view of pdgfrb and tagln expression in the hypochord.
Movie of rotating 3D projections. Projections were made from confocal z-stacks of the hypochord in Tg(tagln:NLS-EGFP); Tg(pdgfrb:Gal4FF; UAS:RFP) zebrafish. pdgfrb expression decreases between 1–4 dpf, while cells of the hypochord elongate along the dorsal aorta. Images are representative of n=12 (1 dpf), n=6 (2 dpf), n=6 (3 dpf), and n=12 (4 dpf), for a total of 36 embryos analyzed. Scale bar: 50 μm.
Movie 2. Hypochord cells infrequently undergo apoptosis and mitosis up to 4 dpf, and do not disappear as previously reported.
Confocal time-lapse movie from Tg(tagln:NLS-EGFP); Tg(pdgfrb:Gal4FF; UAS:RFP) zebrafish shows the hypochord cells from 3 separate embryos between 1 and 4 dpf (38–48 hpf, 62–72 hpf, and 81–89 hpf) with sporadic apoptosis and mitosis events (pdgfrb is magenta, tagln is green). Yellow arrows indicate apoptotic cells, white arrows indicate mitotic cells. Movies are representative of n=6 (1.5 dpf), n=6 (2.5 dpf), and n=6 (3.5 dpf) for a total of 18 embryos analyzed by time-lapse microscopy. Scale bar: 100 μm.
Movie 3. Proliferative tagln-low cells migrate from 1.5 to 2 dpf to the dorsal side of the notochord and adjacent to the medial floor plate to form the MC progenitor population.
Confocal time-lapse movie from Tg(tagln:NLS-EGFP); Tg(pdgfrb:Gal4FF; UAS:RFP) zebrafish shows tagln-low cells that migrate dorsally to the top of the notochord (pdgfrb is magenta, tagln is white, migrating cells are pseudo-colored yellow). Cell A undergoes mitosis, then one daughter cell migrates dorsally. Cell B migrates dorsally then undergoes mitosis to contribute two cells to the MC progenitor population. Cell C resides on the dorsal side of the notochord and undergoes mitosis, increasing the cell number of the MC progenitor population. Movie is representative of n=4 embryos imaged from 1.5 to 2 dpf. MC, mural cell. MFP, medial floor plate. Scale bar: 20 μm.
Movie 4. tagln-positive cells from the MC progenitor population migrate or extend to make contact with nearby ISVs at 2.5 to 3 dpf.
Confocal time-lapse movie from Tg(tagln:NLS-EGFP); Tg(pdgfrb:Gal4FF; UAS:RFP) zebrafish shows tagln-positive cells at the notochord-neural tube interface that migrate or extend to make contact with ISVs (pdgfrb is magenta, tagln is white, moving cells are pseudo-colored yellow). Cell A migrates to the cover the ISV while cell B stretches to make contact with the ISV. Movie is representative of n=6 embryos imaged from 2.5 to 3 dpf. ISV, intersegmental vessel. MC, mural cell. Scale bar: 20 μm.
Movie 5. tagln single-positive and tagln/pdgfrb double-positive cells continue to populate the MC progenitor population in addition to migrating to ISVs at 3.5 to 4 dpf.
Confocal time-lapse movie from Tg(tagln:NLS-EGFP); Tg(pdgfrb:Gal4FF; UAS:RFP) zebrafish shows tagln-positive cells (yellow pseudo-color) and tagln/pdgfrb double-positive cells (cyan pseudo-color) that migrate to the notochord-neural tube interface or to nearby ISVs (pdgfrb is magenta, tagln is white). Cell A undergoes mitosis, and one daughter cell contacts the ISV. Cell B moves to cover the ISV while cell C migrates dorsally to populate the MC progenitor population. Movie is representative of n=2 embryos imaged from 3.5 to 4 dpf. ISV, intersegmental vessel. MC, mural cell. Scale bar: 20 μm.