

Abstract
Purpose
This study aims to explore the role of circ_0032704 in sorafenib‐resistant hepatocellular carcinoma (HCC).
Methods
The expression of circ_0032704, miR‐514a‐3p, and programmed death‐ligand 1 (PD‐L1) mRNA was detected by quantitative real‐time PCR (qPCR). The expression of multidrug resistant‐related proteins, migration/invasion‐related proteins, exosome‐related proteins, and PD‐L1 protein was detected by western blot. Cell viability was detected by CCK‐8 assay. Cell proliferation, migration, and invasion were assessed by EdU assay, wound healing assay, and transwell assay. The binding between miR‐514a‐3p and circ_0032704 or PD‐L1 was verified by RIP assay, pull‐down assay, and dual‐luciferase reporter assay. Cell‐ or serum‐derived exosomes were isolated and identified by TEM and NTA. Xenograft models were established to determine the effect of circ_0032704 on drug resistance in vivo.
Results
Circ_0032704 was overexpressed in sorafenib‐resistant HCC tissues and cells. Circ_0032704 knockdown reduced sorafenib resistance in HCC cells and inhibited cell proliferation, migration, and invasion of sorafenib‐resistant HCC cells, while these effects were reversed by PD‐L1 overexpression. We found that circ_0032704 positively regulated PD‐L1 expression via targeting miR‐514a‐3p. Exosomes with circ_0032704 inhibition reduced sorafenib resistance in HCC cells and inhibited cell proliferation, migration, and invasion of sorafenib‐resistant HCC cells. Exosomes with circ_0032704 inhibition also inhibited tumor growth in vivo. The expression of circ_0032704 in exosomes was stable and possessed diagnostic value.
Conclusion
Circ_0032704 enhanced sorafenib resistance in HCC and promoted the malignant development of sorafenib‐resistant HCC. Circ_0032704 could be transported by exosomes, and exosomal circ_0032704 had diagnostic value.
Keywords: circ_0032704, exosomes, HCC, miR‐514a‐3p, PD‐L1, sorafenib
Circ_0032704 was overexpressed in sorafenib‐resistant tumor tissues and cells of HCC. The knockdown of circ_0032704 reduced sorafenib resistance, inhibited cell proliferation, migration, and invasion, and enhanced the function of CD8+ T cells. Our study proposed a novel mechanism that circ_032704 exerted these effects by positively regulating PD‐L1 via competitively targeting miR‐514a‐3p. In addition, exosomal circ_0032704 was a promising biomarker in the prediction of sorafenib resistance in HCC development.

1. INTRODUCTION
Hepatocellular carcinoma (HCC) is one of the most common lethal tumors, causing over 0.78 million deaths worldwide every year. 1 The prognosis of HCC patients is still poor, with a 5‐year overall survival rate of <15%. 2 Most HCC deaths are caused by a high proportion of postoperative metastasis and drug resistance. 3 Sorafenib is a multi‐target tyrosine kinase inhibitor (TKI) and currently used to treat advanced HCC not suitable for surgery or locoregional treatment. 4 Furthermore, it can also be used as a postoperative adjuvant therapy to reduce the risk of postoperative recurrence. 5 , 6 Unfortunately, long‐term exposure to sorafenib often causes drug resistance in tumor cells, leading to poor therapeutic outcomes. 7 Molecular biomarkers can effectively predict recurrence, metastasis, and the efficacy of specific therapy, and have become the focus of extensive research. 8 Therefore, the identification of reliable biomarkers to deepen our understanding of the underlying mechanisms of HCC resistance development will help formulate better therapeutic strategies and improve prognosis.
Circular RNAs (circRNAs) involving in cancer initiation and development have been widely documented in cancer research. 9 CircRNAs represent a class of endogenous non‐coding RNAs, with loop‐closed structures from “back‐splicing” events. CircRNAs are known for their high stability due to the lack of 3′ and 5′ ends and can be widely detected in various body fluids, including urine, saliva, and serum. 10 Therefore, circRNAs are regarded as promising biomarkers in cancer management. 9 Exosomes are extracellular vesicles and characterized by representative lipid bilayer structure. 11 Exosomes exist in all types of body fluids and are actively produced in tumor cells, which makes exosomes major cancer hallmarks and biomarkers. 12 , 13 In clinical practice, exosomes‐based nanoparticle drug delivery strategies are developed to strengthen cancer therapy. 12 Numerous studies have demonstrated that circRNAs can be transported by exosomes, and exosomal circRNAs function as diagnostic and prognostic biomarkers for cancer. 14 CircRNAs expression profiles provide masses of circRNAs that are aberrantly expressed in tumor tissues and cell lines. 15 , 16 By analyzing the data from public GEO datasets (GSE78520, GSE94508, and GSE97332), we obtained numerous circRNAs dysregulated in HCC tissues. Circ_0032704 was shown to be highly expressed in HCC tissues, which was documented in all three datasets, hinting that circ_0032704 dysregulation was involved in HCC development. However, the role of circ_0032704 in HCC progression was still unclear.
MicroRNAs (miRNAs) regulate the expression of oncogenes or tumor‐suppressor genes by interacting with their 3′ untranslated region (3′UTR). 17 However, circRNAs mechanically serve as microRNA (miRNA) sponge and thus relieve the inhibition of miRNA on target genes. 18 Recently, circRNAs‐mediated miRNA/mRNA regulatory networks have been widely reported. However, the related regulatory networks of circ_0032704 were not addressed and needed further exploring.
The present study obtained circ_0032704 from the public GEO datasets and for the first time investigated the expression and function of circ_0032704 in HCC with sorafenib resistance. Our study partially addressed the functional mechanism of circ_0032704 by establishing miRNA/mRNA pathway, and further study proposed that exosomal circ_0032704 was a promising biomarker in the monitor of sorafenib resistance in HCC development.
2. MATERIALS AND METHODS
2.1. Data collection
CircRNAs expression data were collected from the public database GEO (GSE78520, GSE94508, and GSE97332).
2.2. Sample collection
Patients with HCC (n = 60) received postoperative sorafenib treatment at the First Affiliated Hospital, Hengyang Medical School, University of South China. According to the outcomes judged by the Response Evaluation Criteria in Solid Tumors (RECIST), 19 patients were divided into sorafenib‐sensitive group (n = 25) and sorafenib‐resistant group (n = 35). Tumor tissues and adjacent normal tissues were excised from HCC patients by surgery and diagnosed by dedicated pathologists. Tissue samples were frozen and stored at −80°C until use. Besides, venous blood from each patient was collected and centrifuged to obtain serum. Serum supernatant was transferred into RNase‐free tubes and stored at −80°C until use. Written informed consent was obtained from each participant prior to sample collection. The study protocol was permitted by the Ethics Committee of the First Affiliated Hospital, Hengyang Medical School, University of South China.
2.3. Cell lines
HCC cell lines, Huh‐7 and SK‐HEP‐1, were purchased from BeNa (Beijing, China) and cultured in 90% DMEM containing 10% FBS. Huh‐7 and SK‐HEP‐1 cells were exposed to sorafenib at increasing concentrations (0.1–1 μM; for over 6 months) to construct sorafenib‐resistant Huh‐7 and SK‐HEP‐1 cells (Huh‐7/SR and SK‐HEP‐1/SR). Huh‐7/SR and SK‐HEP‐1/SR cells were exposed to 1 μM sorafenib to maintain drug resistance.
2.4. Quantitative real‐time PCR (qPCR)
Total RNA was extracted by TRIzol reagent (Invitrogen, Carlsbad, CA, USA) and scrambled into cDNA using the PrimeScript™ RT Master Mix Kit (Takara, Dalian, China) or MicroRNA first‐strand synthesis kit (Takara). Then, the FastStart Universal SYBR Green Master Kit (Roche, Mannheim, Germany) was applied for qPCR amplification assay. The internal parameters used in this study were β‐actin and U6. The 2−∆∆Ct method was utilized to calculate the data. The primer sequences were: circ_0032704, F: 5′‐AGTTGTGACGATCCAGAAGTG‐3′ and R: 5′‐AGGGAGATCTGGTTTGGCAA‐3′; PD‐L1, F: 5′‐TGCAGGGCATTCCAGAAAGA‐3′ and R: 5′‐TAGGTCCTTGGGAACCGTGA‐3′; β‐actin, F: 5′‐CTGGAACGGTGAAGGTGACA‐3′ and R: 5′‐CGCATCTCATATTTGGAATGACT‐3′; miR‐514a‐3p, F: 5′‐GCGCGATTGACACTTCTGTG‐3′ and R: 5′‐AGTGCAGGGTCCGAGGTATT‐3′; U6, F: 5′‐CTCGCTTCGGCAGCACATATACT‐3′ and R: 5′‐ACGCTTCACGAATTTGCGTGTC‐3′
2.5. CircRNAs identification
Genomic DNA (gDNA) was extracted from Huh‐7/SR and SK‐HEP‐1/SR cells using PureLink Genomic DNA Mini Kit (ThermoFisher, Waltham, MA, USA). Divergent primers (F: 5′‐CCTCATCGCAGCAGTTGTTT‐3′ and R: 5′‐TCCGAATGTTCTTGGCTCCT‐3′) were used to amplify the circular transcripts from cDNA but not gDNA.
Total RNA (2 μg) was incubated with 3 U/μg RNase R (Epicenter Technologies, Madison, WI, USA) at 37°C for 30 min. The treated RNA was used for reverse transcription and qPCR.
2.6. Subcellular distribution
RNA in cytoplasmic fraction and nuclear fraction was isolated using the PARIS kit (Invitrogen) according to the protocol. RNA in each fraction was used for reverse transfection. The expression of circ_0032704 in each fraction was detected by qPCR, with GAPDH (F: 5′‐GAAGGTGAAGGTCGGAGTC‐3′ and R: 5′‐GAAGATGGTGATGGGATTTC‐3′) as a cytoplasmic internal reference, and U6 as a nuclear internal reference.
2.7. Cell transfection
Oligonucleotides, including shRNA targeting circ_0032704 (sh‐circ_0032704, target sequence 5′‐AGTTGTTTTGCCAAACCAGAT‐3′) and its negative control (sh‐NC), miR‐514a‐3p mimic (miR‐514a‐3p, Product number: miR10002883‐1‐5) and its negative control (miR‐NC, Product number: miR1N0000001‐1‐5), miR‐514a‐3p inhibitor (anti‐miR‐514a‐3p, Product number: miR20002883‐1‐5) and its negative control (anti‐NC, Product number: miR2N0000001‐1‐5), were synthesized by GenePharma (Shanghai, China) and Ribobio (Guangzhou, China). Vectors, including PD‐L1 overexpression vector (PD‐L1) and pcDNA vector (vector), were constructed by Sangon Biotech (Shanghai, China). According to the manufacturer's instructions, cell transfection was performed using Lipofectamine 3000 reagent (Invitrogen).
2.8. CCK‐8 assay
Cells were treated with different concentrations of sorafenib. After 48 h, CCK‐8 reagent (Invitrogen) was added to culture cells. Cell viability was assessed by the absorbance at 450 nm using a microplate reader (Bio‐Rad, Hercules, CA, USA). Then, IC50 of sorafenib was obtained from the cell viability curve.
2.9. Western blot assay
Protein samples were extracted using RIPA lysis buffer (Servicebio, Wuhan, China), separated by SDS‐PAGE, and then transferred onto PVDF membrane (Bio‐Rad). The membranes were blocked by 5% skim milk and probed with the primary antibodies against multidrug resistance protein 1 (MRP1; ab170904; Abcam, Cambridge, MA, USA), MDR‐associated protein 1 (MRP1; ab263865; Abcam), E‐cadherin (ab40772; Abcam), N‐cadherin (ab18203; Abcam), PD‐L1 (ab243877; Abcam), β‐actin (ab8227; Abcam), TSG101 (ab125011; Abcam), CD63 (ab134045; Abcam), CD81 (ab109201; Abcam). The next day, the protein was incubated with the secondary antibody (ab205718; Abcam) for 2 h. The protein bands were visualized using an enhanced chemiluminescent kit (Beyotime, Shanghai, China).
2.10. EdU assay
EdU for cell proliferation assay was conducted using the Cell‐Light TM EdU DNA Cell Proliferation Kit (RiboBio). Cells were plated into 96‐well plates (1 × 10⁴ cells/well), and 50 μM EdU medium was added to each well on next day. Cells were next fixed with 4% paraformaldehyde and stained with Appllo. Cell nucleus was stained with DAPI. Images were captured using a microscope (Olympus, Tokyo, Japan).
2.11. Wound healing assay
In brief, cells were plated into six‐well plates at a density of 2 × 10⁵ cells/well. Images were captured when cell confluence reached 90%, and a sterile pipette tip was used to create a wound. Cells were culture for 24 h, and images were next captured to observe migration distance.
2.12. Transwell assay
Transwell chambers were pre‐treated with Matrigel (Corning Incorporated, Corning, NY, USA). Cells were resuspended into serum‐depleted DMEM medium and then loaded on the top of chambers (3 × 10⁴ cells/well). Meantime, the lower chambers were filled with complete medium containing 10% FBS. After 24 h, the invaded cells to the lower surface were fixed and stained with 0.1% crystal violet (Beyotime). The images of cell invasion were captured using a microscope (100×, Olympus).
2.13. RIP assay
The Magna RIP RNA Binding Protein Immunoprecipitation Kit (Millipore, Billerica, MA, USA) was used to perform the RIP assay. The protein lysate was prepared and next incubated with Ago2 antibody‐coupled magnetic beads, using IgG antibody‐coupled magnetic beads as negative control. Next day, the beads were eluted to isolate RNA, and RNA complex was used for qPCR.
2.14. Pull‐down assay
Biotin‐labeled probes of miR‐514a‐3p (bio‐miR‐514a‐3p) or miR‐NC (bio‐miR‐NC) were provided by Ribobio. Huh‐7/SR and SK‐HEP‐1/SR cells were transfected with bio‐miR‐514a‐3p or bio‐miR‐NC and then lysed. All procedures were conducted according to the protocol from the Pierce™ Magnetic RNA‐Protein Pull‐Down Kit (ThermoFisher). RNA complex bound to beads was extracted and used for qPCR.
2.15. Dual‐luciferase reporter assay
The binding sites between miR‐514a‐3p and circ_0032704 or PD‐L1 were provided by bioinformatics tools. Luciferase reporter vectors pmirGLO containing wt‐circ_0032704, mut‐circ_0032704, wt‐PD‐L1 3′UTR, or mut‐PD‐L1 3′UTR were constructed by Genepharma. Then, the reporter vector was separately transfected with miR‐514a‐3p or miR‐NC into 293T cells (Bena). After 48 h, luciferase activities in 293 T cells were measured using the Dual‐Luciferase Reporter Assay System (Promega, Madison, WI, USA).
2.16. Exosome isolation and identification
Exosomes were isolated from cells by differential centrifugation using an exoEasy Maxi Kit (QIAGEN, Duesseldorf, Germany). The morphology of exosomes was identified by transmission electron microscopy (TEM). Simply put, the isolated exosomes were resuspended in PBS and then transferred on a formvar carbon‐coated copper grid with 0.125% Formvar. The grid was next stained with 1% uranyl acetate staining buffer and finally washed with PBS. Images were taken under a TEM (Hitachi, Tokyo, Japan). The size and concentration of exosomes were identified by nanoparticle tracking analysis (NTA). Simply put, exosomes were suspended in PBS and used for tracking analysis using NanoSight NS300 instrument (Malvern, Worcestershire, UK). The size distribution and concentration of exosomes were determined based on the Stokes–Einstein equation.
2.17. Animal study
Nude mice (Balb/c, 6‐week‐old, female) were purchased from Vital River Laboratory Animal Technology Co., Ltd (Beijing, China). Huh‐7 cells were subcutaneously injected into the region of nude mice (2 × 10⁶ cells/mouse) to induce tumor growth. During tumor growth, exosomes (10 μg per 100 μL) derived from Huh‐7/SR cells transfected with sh‐circ_0032704 or sh‐NC or PBS (control) were injected into tumor nodes every 3 days. Mice were administered with sorafenib (5 mg/kg) via intraperitoneal injection every 3 days. Mice were divided into three groups (n = 6 per group). Mice in group 1 were administered with PBS + Sorafenib. Mice in group 2 were administered with Huh‐7/SR‐sh‐NC exo + Sorafenib. Mice in group 3 were administered with Huh‐7/SR‐sh‐circ_0032704 exo + Sorafenib. After 28 days, all mice were euthanized, and tumor tissues were excised. Tumor volume (length×width2 × 0.5) was measured once a week. The animal procedures were approved by the Animal Care and Use Committee of the First Affiliated Hospital, Hengyang Medical School, University of South China.
2.18. IHC analysis
Tissue paraffin sections (5 μm) were prepared. In brief, tissue sections were dewaxed and fixed, followed by incubation with the primary antibodies against PD‐L1 (ab243877; Abcam) and Ki‐67 (ab92742; Abcam) overnight. Next day, tissue sections were probed with the secondary antibody (ab205718; Abcam). Tissues sections were stained using Pierce™ DAB Substrate Kit (ThermoFisher) according to the protocol.
2.19. Statistical analysis
GraphPad Prism 7.0 (GraphPad Software, La Jolla, CA, USA) was utilized for statistical analysis. Student's t‐test was used to analyze the difference between two groups. ANOVA was used to analyze the data among multiple groups. The Pearson correlation coefficient was used to analyze the correlation between the two variables. The data were collected from at least three experimental repeats and expressed as the mean ± SD, and p < 0.05 was confirmed statistically significant.
3. RESULTS
3.1. Circ_0032704 was highly expressed in HCC sorafenib‐resistant HCC tissues and cells
By analyzing the public GEO datasets, including GSE78520, GSE94508, and GSE97332, numerous circRNAs that were differently expressed in HCC tumor tissues compared to normal tissues were obtained (Figure 1A–C). A total of seven circRNAs that were upregulated in HCC tumor tissues were identified in all these datasets (Figure 1D). Then, we examined the expression of these seven circRNAs in our clinical samples, and we found that circ_0032704 showed the highest expression level in HCC tissues relative to other circRNAs (Figure 1E), and circ_0032704 expression levels (median = 1.91) were associated with tumor size, TNM stage, vascular invasion, and sorafenib therapy (Table S1). In addition, circ_0032704 of interest was shown to be overexpressed in sorafenib‐resistant tumor tissues compared with that in sorafenib‐sensitive tumor tissues (Figure 1F). By analyzing the structure of circ_0032704, we discovered that circ_0032704 was derived from exon8 ~ exon12 regions of TTLL5 mRNA (NM_015072) (Figure 1G). The expression of circ_0032704 was notably increased in Huh‐7/SR and SK‐HEP‐1/SR cells compared to their parent cells (Figure 1H). The resistance of Huh‐7/SR and SK‐HEP‐1/SR cells to sorafenib was evidenced by the increased expression of MDR1, MRP1 and N‐cadherin, and the decreased expression of E‐cadherin, in contract to their parental cells (Figure S1A,B). We experimentally tested the existence of circ_0032704 in Huh‐7/SR and SK‐HEP‐1/SR cells using divergent primers. The data presented that divergent primers amplified circ_0032704 in cDNA but not gDNA (Figure 1I). Moreover, circ_0032704, compared to linear transcript, was notably resistant RNase R digestion (Figure 1J,K). In Huh‐7/SR and SK‐HEP‐1/SR cells, circ_0032704 was mainly distributed in the cytoplasmic fraction but not in the nuclear fraction (Figure 1L,M). In this part, we demonstrated the existence and stability of circ_0032704 and introduced that circ_0032704 expression was increased in sorafenib‐resistant HCC tissues and cells.
FIGURE 1.

Circ_0032704 was highly expressed in sorafenib‐resistant tumor tissues and cells. (A–C) Public datasets, including GSE78520, GSE94508, and GSE97330, were applied in this study. (D) A total of seven circRNAs were screened in these three datasets. (E) The expression of these circRNAs in our clinical tissues was detected by qPCR. (F) The expression of circ_0032704 in sorafenib‐resistant tumor tissues, sorafenib‐sensitive tumor tissues, and normal tissues was detected by qPCR. (G) The formation of circ_0032704. (H) The expression of circ_0032704 in Huh‐7/SR cells, SK‐HEP‐1/SR cells, and their parental cells was measured by qPCR. (I) The existence of circ_0032704 was identified by divergent primers. (J, K) The stability of circ_0032704 was identified by RNase R. (L, M) The distribution of circ_0032704 was determined. *p < .05, **p < .01 and ***p < .001.
3.2. Circ_0032704 knockdown reduced sorafenib resistance, inhibited cell malignant phenotypes, and promoted CD8 +T‐induced cell cytotoxicity in Huh‐7/SR and SK‐HEP‐1/SR cells
The endogenous level of circ_0032704 in Huh‐7/SR and SK‐HEP‐1/SR cells was reduced by transfecting with sh‐circ_0032704 to explore the role of circ_0032704 (Figure S2A). Huh‐7/SR and SK‐HEP‐1/SR cells were exposed to different doses of sorafenib, and circ_0032704 knockdown significantly weakened cell viability (Figure S2B,C). Besides, circ_0032704 knockdown notably reduced the IC50 of sorafenib in Huh‐7/SR and SK‐HEP‐1/SR cells (Figure S2D). Western blot was performed to detect the expression of the drug resistance markers, MDR1 and MRP1. The data showed that the expression of MDR1 and MRP1 was strikingly declined in Huh‐7/SR and SK‐HEP‐1/SR cells transfected with sh‐circ_0032704 compared to sh‐NC (Figure S2E,F). EdU assay presented that circ_0032704 knockdown markedly inhibited cell proliferation (Figure S3A). Wound healing assay and transwell assay presented that circ_0032704 knockdown inhibited wound healing rate and cell invasive rate, suggesting that circ_0032704 knockdown inhibited cell migration and invasion (Figure S3B,C). In addition, the expression of E‐cadherin was increased, while the expression of N‐cadherin was decreased in Huh‐7/SR and SK‐HEP‐1/SR cells transfected with sh‐circ_0032704 compared to sh‐NC (Figure S3D,E).
3.3. Circ_0032704 knockdown played functions in Huh‐7/SR and SK‐HEP‐1/SR cells by depleting PD‐L1
The expression of PD‐L1 was shown to be increased in sorafenib‐resistant HCC tumor tissues compared to sorafenib‐sensitive HCC tumor tissues (Figure 2A), and we found that PD‐L1 mRNA level was positively correlated with circ_0032704 level in sorafenib‐resistant HCC tumor tissues (Figure 2B). The expression of PD‐L1 protein was also notably increased in sorafenib‐resistant HCC tumor tissues compared to sorafenib‐sensitive HCC tumor tissues (Figure 2C). The expression of PD‐L1 protein was notably increased in Huh‐7/SR and SK‐HEP‐1/SR cells compared to their parent cells (Figure 2D). The expression of PD‐L1 protein was markedly decreased in Huh‐7/SR and SK‐HEP‐1/SR cells transfected with sh‐circ_0032704 (Figure 2E), while its expression was notably strengthened in cells transfected with oe‐circ_0032704 (Figure S4B). The efficiency of circ_0032704 overexpression and PD‐L1 overexpression in Huh‐7/SR and SK‐HEP‐1/SR cells was shown in Figure S4A,C, displaying the elevated expression of circ_0032704 or PD‐L1 protein in oe‐circ_0032704‐ or oe‐PD‐L1‐transfected cells. In the experimental cells for rescue experiments, PD‐L1 mRNA expression and protein expression were largely restored by sh‐circ_0032704 + oe‐PD‐L1, compared to sh‐circ_0032704 + vector, in Huh‐7/SR and SK‐HEP‐1/SR cells (Figure 2F and S4D). The IC50 of sorafenib in Huh‐7/SR and SK‐HEP‐1/SR cells was largely recovered by sh‐circ_0032704 + oe‐PD‐L1 compared to sh‐circ_0032704 + vector (Figure 2G). The protein levels of MDR1 and MRP1 were significantly recovered in Huh‐7/SR and SK‐HEP‐1/SR cells transfected with sh‐circ_0032704 + oe‐PD‐L1 compared to sh‐circ_0032704 + vector (Figure 2H,I). EdU assay presented that the reintroduction of PD‐L1 recovered cell proliferation in Huh‐7/SR and SK‐HEP‐1/SR cells with circ_0032704 knockdown (Figure 2J and S5A). Cell migration and cell invasion suppressed by circ_0032704 knockdown were partially recovered by oe‐PDL‐1 reintroduction (Figure 2K,L). However, the expression of E‐cadherin was repressed, while the expression of N‐cadherin was restored by PD‐L1 reintroduction in Huh‐7/SR and SK‐HEP‐1/SR cells with circ_0032704 knockdown (Figure 2M,N). These data revealed that PD‐L1 overexpression partially reversed the effects of circ_0032704 knockdown.
FIGURE 2.
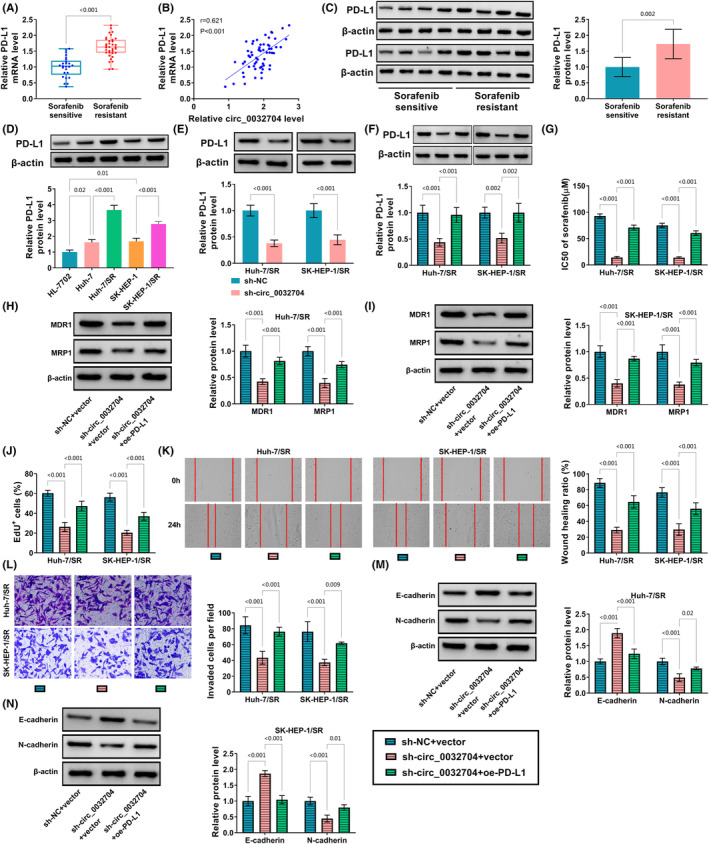
Circ_0032704 knockdown inhibited sorafenib resistance, cell proliferation, migration, and invasion by downregulating PD‐L1. (A) The expression of PD‐L1 mRNA in sorafenib‐resistant and sorafenib‐sensitive tumor tissues was detected by qPCR. (B) The correlation between circ_0032704 expression and PD‐L1 expression was analyzed by Pearson's analysis. (C) The expression of PD‐L1 protein in sorafenib‐resistant and sorafenib‐sensitive tumor tissues was detected by western blot. (D) The expression of PD‐L1 protein in Huh‐7/SR cells, SK‐HEP‐1/SR cells, and their parental cells was measured by western blot. (E) The expression of PD‐L1 protein in Huh‐7/SR and SK‐HEP‐1/SR cells transfected with sh‐circ_0032704 or sh‐NC was measured by western blot. In Huh‐7/SR and SK‐HEP‐1/SR cells transfected with sh‐circ_0032704 + oe‐PD‐L1 or sh‐circ_0032704 + vector, (F) the expression of PD‐L1 protein was measured by western blot. (G) IC50 was measured by CCK‐8 assay. (H, I) The protein levels of MDR1 and MRP1 were detected by western blot. (J–L) Cell proliferation, migration, and invasion were assessed by EdU assay, wound healing assay, and transwell assay, respectively. (M, N) The protein levels of E‐cadherin and N‐cadherin were detected by western blot. *p < 0.05, **p < 0.01 and ***p < 0.001.
3.4. Circ_0032704 promoted the expression of PD‐L1 by targeting miR‐514a‐3p
Bioinformatics tool starBase was used to predict miRNAs that harbored binding sites with circ_0032704, and bioinformatics tool TargetScan was used to predict miRNAs that harbored a binding site with PD‐L1 3′UTR. Venn diagram showed that miR‐514a‐3p possessed binding sites with both circ_0032704 and PD‐L1 (Figure 3A). RIP assay showed that circ_0032704, PD‐L1, and miR‐514a‐3p could be enriched in the anti‐Ago2 group relative to anti‐IgG group (Figure 3B,C). Biotin pull‐down assay showed that circ_0032704 could be largely enriched by bio‐miR‐514a‐3p probe but not bio‐miR‐NC probe (Figure 3D). Subsequently, dual‐luciferase reporter plasmids, including mut‐circ_0032704, wt‐circ_0032704, mut‐PD‐L1 3′UTR and wt‐PD‐L1 3′UTR, were constructed (Figure 3E). In this assay, the cotransfection of miR‐514a‐3p and wt‐circ_0032704 or wt‐PD‐L1 3′UTR in 293 T cells significantly reduced luciferase activity (Figure 3F,G). The data confirmed the binding between miR‐514a‐3p and circ_0032704 or PD‐L1 3′UTR. The expression of miR‐514a‐3p was notably enhanced in Huh‐7/SR and SK‐HEP‐1/SR cells transfected with miR‐514a‐3p but declined in cells transfected with anti‐miR‐514a‐3p (Figure 3H,I). The expression of PD‐L1 protein was notably reduced in Huh‐7/SR and SK‐HEP‐1/SR cells after miR‐514a‐3p restoration but increased in cells after miR‐514a‐3p inhibition (Figure 3J,K). Moreover, the expression of PD‐L1 protein and mRNA was significantly reduced in Huh‐7/SR and SK‐HEP‐1/SR cells with circ_0032704 knockdown but recovered in cells transfected with sh‐circ_0032704 + anti‐miR‐514a‐3p (Figure 3L,M and S4E,F). The expression of miR‐514a‐3p was markedly declined in sorafenib‐resistant tumor tissues compared to sorafenib‐sensitive tumor tissues (Figure 3N). MiR‐514a‐3p expression was also decreased in Huh‐7/SR and SK‐HEP‐1/SR cells compared to their parent cells (Figure 3O). The data suggested that circ_0032704 positively regulated the expression of PD‐L1 by targeting miR‐514a‐3p.
FIGURE 3.

Circ_0032704 regulated PD‐L1 expression by targeting miR‐514a‐3p. (A) Bioinformatics tool predicted the binding sites between miR‐514a‐3p and circ_0032704 and PD‐L1. (B, C) Circ_0032704, PD‐L1, and miR‐514a‐3p interacted with Ago2 protein by RIP assay. (D) The interaction between miR‐514a‐3p and circ_0032704 or PD‐L1 was verified by pull‐down assay. (E) Luciferase reporter plasmids were designed. (F, G) The binding between miR‐514a‐3p and circ_0032704 or PD‐L1 was verified by dual‐luciferase reporter assay. (H, I) The efficiency of miR‐514a‐3p mimic and miR‐514a‐3p inhibitor was checked by qPCR. (J, K) The expression of PD‐L1 protein in Huh‐7/SR and SK‐HEP‐1/SR cells after miR‐514a‐3p enrichment or overexpression was detected by western blot. (L, M) The expression of PD‐L1 protein in Huh‐7/SR and SK‐HEP‐1/SR cells transfected with sh‐circ_0032704 + anti‐NC or sh‐circ_0032704 + anti‐miR‐514a‐3p was detected by western blot. (N, O) The expression of miR‐514a‐3p in sorafenib‐resistant HCC tumor tissues and cells was detected by qPCR. **p < 0.01 and ***p < 0.001.
3.5. Circ_0032704 could be transported by exosomes, and exosomal circ_0032704 was a biomarker for HCC‐resistant diagnosis
Serum‐derived exosomes were obtained from serum samples of sorafenib‐resistant patients and sorafenib‐sensitive patients, and the bilayer morphology of exosomes was identified by TEM (Figure 4A). NTA analysis displayed the density and size distribution of serum‐derived exosomes (Figure 4B). Western blot showed the noticeable expression of CD63, CD81, and TSG101 in exosomes (Figure 4C). The expression of circ_0032704 was notably higher in serum‐derived exosomes from sorafenib‐resistant patients than that from sorafenib‐sensitive patients (Figure 4D). Serum‐derived exosomes were exposed to air for 0, 6, 12, and 24 h, and the expression of circ_0032704 was slowly decreased (Figure 4E). Serum‐derived exosomes were exposed to NaOH and HCl, and the data showed that circ_0032704 expression had a strong receivable ability of pH changes (Figure 4F). Serum‐derived exosomes experienced repeated freezing and thawing, and the data showed that the expression of circ_0032704 was rarely decreased (Figure 4G). These data suggested that circ_0032704 was stably expressed in exosomes. Moreover, receiver operating characteristic (ROC) curve indicated that circ_0032704 in serum exosomes had a high diagnostic value (AUC = 0.774) (Figure 4H), suggesting that exosomal circ_0032704 was a stable biomarker for HCC‐resistant diagnosis. Notably, patients with low exosomal circ_0032704 might have a longer survival time (Figure 4I). Huh‐7/SR and SK‐HEP‐1/SR cells‐derived exosomes were further obtained, and the representative lipid bilayer structure of exosomes was observed by TEM (Figure 4J). NTA analysis displayed the density and size distribution of cell‐derived exosomes (Figure 4K). Western blot showed that exosomes‐related markers, including TSG101, CD63, and CD81, could be abundantly enriched in exosomes derived from Huh‐7/SR and SK‐HEP‐1/SR cells (Figure 4L). In addition, we found that the expression of circ_0032704 was markedly increased in exosomes from Huh‐7/SR and SK‐HEP‐1/SR cells compared to their parent cells (Figure 4M). The expression of circ_0032704 was notably declined in exosomes derived from Huh‐7/SR and SK‐HEP‐1/SR cells transfected with sh‐circ_0032704 but not sh‐NC (Figure 4N). The expression of circ_0032704 was notably enhanced in Huh‐7 cells incubated with exosomes derived from Huh‐7/SR cells transfected with sh‐NC but reduced in Huh‐7 cells incubated with exosomes derived from Huh‐7/SR cells transfected with sh‐circ_0032704 (Figure 4O). Similar results were also detected in SK‐HEP‐1 cells (Figure 4P). The data illustrated that circ_0032704 was transported by exosomes, and exosomal circ_0032704 was a diagnostic marker for sorafenib‐resistant HCC.
FIGURE 4.

Circ_0032704 could be transferred by exosomes, and exosomal circ_0032704 was a stable biomarker for HCC‐resistant diagnosis. (A) Serum‐derived exosomes were observed under a TEM. (B) The size distribution of serum‐derived exosomes was analyzed by NTA. (C) Exosomes were identified by the expression of CD63, CD81, and TSG101. (D) The expression of circ_0032704 in serum‐derived exosomes was detected by qPCR. (E–G) The expression of circ_0032704 in exosomes after exposure to air, PH change, or multigelation was detected by qPCR. (H) The diagnostic sensitivity of exosomal circ_0032704 was determined by ROC curve. (I) Kaplan–Meier prognostic analyses showed the OS of HCC patients based on the expression of circ_0032704 in serum‐derived exosomes. (J) The phenotype of cell‐derived exosomes was observed under a TEM. (K) The size distribution of cell‐derived exosomes was analyzed by NTA. (L) Exosomes were identified by the expression of TSG101, CD63, and CD81 using western blot. (M) The expression of circ_0032704 in exosomes derived from different cells was detected by qPCR. (N)The expression of circ_0032704 in exosomes derived from Huh‐7/SR and SK‐HEP‐1/SR cells transfected with sh‐circ_0032704 or sh‐NC was detected by qPCR. (O, P) After the incubation of exosomes derived from Huh‐7/SR and SK‐HEP‐1/SR cells transfected with sh‐circ_0032704 or sh‐NC, the expression in Huh‐7 and SK‐HEP‐1 cells was detected by qPCR. **p < 0.01 and ***p < 0.001.
3.6. Downregulation of exosomal circ_0032704 inhibited sorafenib resistance, cell proliferation, migration, and invasion in Huh‐7 and SK‐HEP‐1 cells
Exosomes were isolated from Huh‐7/SR and SK‐HEP‐1/SR cells transfected with sh‐circ_0032704 or sh‐NC, and Huh‐7 and SK‐HEP‐1 cells were incubated with these exosomes. We found that the protein level and mRNA level of PD‐L1 were notably decreased in Huh‐7 and SK‐HEP‐1 cells incubated with Huh‐7/SR‐sh‐circ_0032704 exosomes or SK‐HEP‐1/SR‐sh‐circ_0032704 exosomes, respectively (Figure 5A,B and S4G,H). In Huh‐7 and SK‐HEP‐1 cells incubated with Huh‐7/SR‐sh‐circ_0032704 exosomes or SK‐HEP‐1/SR‐sh‐circ_0032704 exosomes, we found that the IC50 of sorafenib was notably decreased (Figure 5C,D), and the protein levels of MDR1 and MRP1 were also significantly declined (Figure 5E,F). The data indicated that exosomes with circ_0032704 inhibition reduced sorafenib resistance in Huh‐7 and SK‐HEP‐1 cells. EdU assay presented that cell proliferation capacity was notably suppressed in Huh‐7 and SK‐HEP‐1 cells incubated with exosomes with circ_0032704 inhibition (Figure 5G, H and S5B). Wound healing assay and transwell assay presented that the ability of cell migration and invasion was notably inhibited in Huh‐7 and SK‐HEP‐1 cells incubated with exosomes with circ_0032704 inhibition (Figure 5I–L). In addition, exosomes with circ_0032704 inhibition enhanced the expression of E‐cadherin and reduced the expression of N‐cadherin in Huh‐7 and SK‐HEP‐1 cells (Figure 5M, N). The data suggested that downregulation of exosomal circ_0032704 could inhibit cell malignant behaviors in Huh‐7 and SK‐HEP‐1 cells.
FIGURE 5.

Exosomes from Huh‐7/SR and SK‐HEP‐1/SR cells with circ_0032704 knockdown enhanced sorafenib sensitivity and inhibited Huh‐7 and SK‐HEP‐1 cell malignant behaviors. Huh‐7 and SK‐HEP‐1 cells were incubated with exosomes derived from Huh‐7/SR and SK‐HEP‐1/SR cells transfected with sh‐circ_0032704 or sh‐NC. In these cells, (A, B) the expression of PD‐L1 protein was detected by western blot. (C, D) IC50 value was measured by CCK‐8 assay. (E, F) The protein levels of MDR1 and MRP1 were measured by western blot. (G, H) cell proliferation was assessed by EdU assay. (I, J) Cell migration was assessed by wound healing assay. (K, L) Cell invasion was assessed by transwell assay. (M, N) The protein levels of E‐cadherin and N‐cadherin were measured by western blot. *p < 0.05, **p < 0.01 and ***p < 0.001.
3.7. Exosomes with circ_0032704 inhibition inhibited tumor growth in vivo
In sorafenib‐administered mice, the injection of exosomes carrying sh‐NC promoted tumor volume and tumor weight compared to PBS injection, while exosomes with circ_0032704 inhibition partially inhibited tumor volume and tumor weight (Figure 6A,C). The expression of circ_0032704 was enhanced in tumor tissues with exosomes carrying sh‐NC treatment but repressed in tumor tissues with exosomes carrying sh‐circ_0032704 treatment (Figure 6D). IHC assay presented that the abundance of PD‐L1 and Ki‐67 was enhanced in tumor tissues with exosomes carrying sh‐NC treatment but repressed in tumor tissues with exosomes carrying sh‐circ_0032704 treatment (Figure 6E). Western blot assay showed that the protein levels of MDR1, MRP1, and N‐cadherin were increased in tumor tissues with exosomes carrying sh‐NC treatment but repressed in tumor tissues with exosomes carrying sh‐circ_0032704 treatment, while the protein level of E‐cadherin was decreased in tumor tissues with exosomes carrying sh‐NC treatment but recovered in tumor tissues with exosomes carrying sh‐circ_0032704 treatment (Figure 6F).
FIGURE 6.

Exosomes with circ_0032704 inhibition reduced sorafenib resistance in vivo. (A) The images of representative tumor tissues. Mice in different groups received various treatments. (B, C) Tumor volume and tumor weight were measured to assess tumor growth. (D) The expression of circ_0032704 in tumor tissues was detected by qPCR. (E) The abundance of PD‐L1 and Ki‐67 in tumor tissues was detected by IHC assay. (F) The protein levels of MDR1, MRP1, E‐cadherin, and N‐cadherin in tumor tissues were detected by western blot. *p < 0.05, **p < 0.01 and ***p < 0.001.
4. DISCUSSION
The current study highlighted that circ_0032704 played a vital role in sorafenib‐resistant HCC. We found that circ_0032704 expression was significantly elevated in sorafenib‐resistant tumor tissues and cell lines of HCC. The knockdown of circ_0032704 weakened the resistance to sorafenib of sorafenib‐resistant HCC cells and effectively inhibited sorafenib‐resistant HCC cell proliferation, migration, and invasion. In addition, circ_0032704 could be transmitted by exosomes, and exosomes with low expression of circ_0032704 suppressed the malignant behaviors of HCC cells. In mechanism, we found that circ_0032704 played functions partially by targeting the miR‐514a‐3p/PD‐L1 pathway. This study was the first to explore the role and functional mechanism of circ_0032704 in HCC with sorafenib resistance.
The implication of circRNAs in HCC development has been widely clarified, while the involvement of circRNAs in sorafenib resistance development of HCC is rarely reported. Previous studies published that circ_0008367 was markedly upregulated in sorafenib‐treated HCC cells, and sorafenib‐induced ferroptosis was largely suppressed by circ_0008367 silencing. 20 CircRNA_104797 was reported to be overexpressed in sorafenib‐resistant HCC cells, and circRNA_104797 knockdown strengthened sorafenib‐induced cell apoptosis in sorafenib‐resistant HCC cells. 21 In this study, we analyzed the data from the public GEO datasets and found that circ_0032704 expression was notably increased in HCC tissues. We further determined that circ_0032704 was overexpressed in sorafenib‐resistant HCC tissues and cells compared to sorafenib‐sensitive tissues and cells. Circ_0032704 downregulation efficiently reduced sorafenib resistance and suppressed cancer cell proliferation, migration, and invasion.
It has been reported that PD‐L1 is one of the immune checkpoint receptors, and PD‐L1 interacting with PD‐1 inhibits the survival and function of CD8+ T cells, thus decreasing immune responses and promoting immune escape. 22 , 23 PD‐L1 is widely overexpressed in various cancers, and PD‐L1 overexpression promoted cancer cell malignant properties, such as proliferation, invasion, and epithelial‐mesenchymal transition (EMT). 24 , 25 , 26 Besides, high expression of PD‐L1 was shown to be associated with poor prognosis in patients with HCC. 27 To determine whether circ_0032704 regulated HCC progression by modulating PD‐L1, we performed rescued experiments by enhancing PD‐L1 expression in circ_0032704‐depleted HCC cells. The results showed that PD‐L1 overexpression recovered circ_0032704 knockdown‐blocked sorafenib resistance, cell proliferation, migration, and invasion. The data indicated that circ_0032704 was implicated in the development of sorafenib resistance in HCC via regulating PD‐L1 expression.
Further study illustrated that miR‐514a‐3p harbored the binding sites with both circ_0032704 and PD‐L1 3′UTR. We speculated that circ_0032704 regulated the expression of PD‐L1 by competitively targeting miR‐514a‐3p. Interestingly, the expression of PD‐L1 was reduced in HCC cells after circ_0032704 knockdown but recovered by further miR‐514a‐3p inhibition. In terms of function, cell proliferation, migration, invasion, and sorafenib resistance in Huh‐7/SR and SK‐HEP‐1/SR cells inhibited by miR‐514a‐3p restoration were largely recovered by PD‐L1 reintroduction. MiR‐514a‐3p was previously claimed to be a suppressor in renal cell carcinoma and testicular germ cell tumor. 28 , 29 The role of miR‐514a‐3p in HCC was also explored in our study for the first time. Overall, circ_0032704, PD‐L1, and miR‐514a‐3p were all vital regulators in HCC with sorafenib resistance.
Moreover, our study discovered that circ_0032704 was overexpressed in exosomes deriving from sorafenib‐resistant HCC cells. Exosomes carrying low expression of circ_0032704 enhanced the sensitivity to sorafenib of Huh‐7 and SK‐HEP‐1 cells and inhibited Huh‐7 and SK‐HEP‐1 cell malignant behaviors. In animal models, exosomes carrying low expression of circ_0032704 enhanced sorafenib sensitivity and thus blocked tumor growth in vivo. Importantly, the expression of circ_0032704 in serum‐derived exosomes from HCC patients was stable and held great diagnostic value. The data strongly suggested that exosomal circ_0032704 was a promising biomarker in the management of HCC with sorafenib resistance.
5. CONCLUSION
Circ_0032704 was overexpressed in sorafenib‐resistant tumor tissues and cells of HCC. The knockdown of circ_0032704 reduced sorafenib resistance and inhibited cell proliferation, migration, and invasion. Our study proposed a novel mechanism that circ_032704 exerted these effects by positively regulating PD‐L1 via competitively targeting miR‐514a‐3p. In addition, exosomal circ_0032704 was a promising biomarker in the prediction of sorafenib resistance in HCC development.
AUTHOR CONTRIBUTIONS
All authors made substantial contributions to conception and design, acquisition of data, or analysis and interpretation of data; took part in drafting the article or revising it critically for important intellectual content; gave final approval of the version to be published; and agree to be accountable for all aspects of the work.
FUNDING INFORMATION
This work was supported by (No. 202103082238) The mechanism and therapeutic value of abnormal composition and function of HDL in acute‐on‐chronic hepatitis B liver failure by Chengyun Dou; Scientific research project of Hunan Provincial Health Commission in 2021; (No. 202104082246) The mechanism of TEM8 regulating osteosarcoma proliferation through DUSP5/pERK1/2 by Chuangjie Cao; Scientific research project of Hunan Provincial Health Commission in 2021.
CONFLICT OF INTEREST STATEMENT
The authors declare that they have no competing interests.
ETHICS STATEMENT
Approval of the research protocol: The present study was approved by the ethical review committee of the First Affiliated Hospital, Hengyang Medical School, University of South China.
Informed consent: Patients with HCC (n = 60) received sorafenib therapy at the First Affiliated Hospital, Hengyang Medical School, University of South China. According to the outcomes judged by the Response Evaluation Criteria in Solid Tumors (RECIST), 19 patients were divided into sorafenib‐sensitive group (n = 25) and sorafenib‐resistant group (n = 35). The present study was approved by the ethical review committee of the the First Affiliated Hospital, Hengyang Medical School, University of South China. Written informed consent was obtained from all enrolled patients. These patients did not receive any therapy before surgery. We all agreed to the use of their samples in scientific research and indicate in the manuscript and signed the written informed consents prior to the extraction of tissue samples.
Registry and the Registration No. of the study/trial: N/A.
Animal Studies: Animal studies were performed in compliance with the ARRIVE guidelines and the Basel Declaration. All animals received humane care according to the National Institutes of Health (USA) guidelines.
Supporting information
Figure S1.
Figure S2.
Figure S3.
Figure S4.
Figure S5.
Table S1.
Dou C, Zhu H, Xie X, Huang C, Tan H, Cao C. Exosomal circ_0032704 confers sorafenib resistance to hepatocellular carcinoma and contributes to cancer malignant progression by modulating the miR‐514a‐3p/PD‐L1 pathway. Ann Gastroenterol Surg. 2024;8:507–520. 10.1002/ags3.12772
Contributor Information
Chengyun Dou, Email: douchy985@usc.edu.cn.
Chuangjie Cao, Email: caochj@mail2.sysu.edu.cn.
DATA AVAILABILITY STATEMENT
The analyzed data sets generated during the present study are available from the corresponding author on reasonable request.
REFERENCES
- 1. Bray F, Ferlay J, Soerjomataram I, Siegel RL, Torre LA, Jemal A. Global cancer statistics 2018: GLOBOCAN estimates of incidence and mortality worldwide for 36 cancers in 185 countries. CA Cancer J Clin. 2018;68(6):394–424. [DOI] [PubMed] [Google Scholar]
- 2. Boal Carvalho P, Pereira E. Imagiological diagnosis of gastrointestinal diseases ‐ diagnostic criteria of hepatocellular carcinoma. GE Port J Gastroenterol. 2015;22(4):153–160. [DOI] [PMC free article] [PubMed] [Google Scholar]
- 3. Wang Y, Peng C, Cheng Z, Wang X, Wu L, Li J, et al. The prognostic significance of preoperative neutrophil‐lymphocyte ratio in patients with hepatocellular carcinoma receiving hepatectomy: a systematic review and meta‐analysis. Int J Surg. 2018;55:73–80. [DOI] [PubMed] [Google Scholar]
- 4. Forner A, Da Fonseca LG, Diaz‐Gonzalez A, Sanduzzi‐Zamparelli M, Reig M, Bruix J. Controversies in the management of hepatocellular carcinoma. JHEP Rep Innovat Hepatol. 2019;1(1):17–29. [DOI] [PMC free article] [PubMed] [Google Scholar]
- 5. Zhong JH, Du XK, Xiang BD, Li LQ. Adjuvant sorafenib in hepatocellular carcinoma: a cautionary comment of STORM trial. World J Hepatol. 2016;8(23):957–960. [DOI] [PMC free article] [PubMed] [Google Scholar]
- 6. Zhang XP, Chai ZT, Gao YZ, Chen ZH, Wang K, Shi J, et al. Postoperative adjuvant sorafenib improves survival outcomes in hepatocellular carcinoma patients with microvascular invasion after R0 liver resection: a propensity score matching analysis. Official J Int Hepato Pancreato Biliary Assoc. 2019;21(12):1687–1696. [DOI] [PubMed] [Google Scholar]
- 7. Niu L, Liu L, Yang S, Ren J, Lai PBS, Chen GG. New insights into sorafenib resistance in hepatocellular carcinoma: responsible mechanisms and promising strategies. Biochim Biophys Acta Rev Cancer. 2017;1868(2):564–570. [DOI] [PubMed] [Google Scholar]
- 8. Zhao Q, Zheng B, Meng S, Xu Y, Guo J, Chen LJ, et al. Increased expression of SLC46A3 to oppose the progression of hepatocellular carcinoma and its effect on sorafenib therapy. Biomed Pharmacotherapy. 2019;114:108864. [DOI] [PubMed] [Google Scholar]
- 9. Wang S, Zhang K, Tan S, Xin J, Yuan Q, Xu H, et al. Circular RNAs in body fluids as cancer biomarkers: the new frontier of liquid biopsies. Mol Cancer. 2021;20(1):13. [DOI] [PMC free article] [PubMed] [Google Scholar]
- 10. Franz A, Rabien A, Stephan C, Ralla B, Fuchs S, Jung K, et al. Circular RNAs: a new class of biomarkers as a rising interest in laboratory medicine. Clin Chem Lab Med. 2018;56(12):1992–2003. [DOI] [PubMed] [Google Scholar]
- 11. Minciacchi VR, Freeman MR, Di Vizio D. Extracellular vesicles in cancer: exosomes, microvesicles and the emerging role of large oncosomes. Semin Cell Dev Biol. 2015;40:41–51. [DOI] [PMC free article] [PubMed] [Google Scholar]
- 12. Kok VC, Yu CC. Cancer‐derived exosomes: their role in cancer biology and biomarker development. Int J Nanomedicine. 2020;15:8019–8036. [DOI] [PMC free article] [PubMed] [Google Scholar]
- 13. Aghebati‐Maleki A, Nami S, Baghbanzadeh A, Karzar BH, Noorolyai S, Fotouhi A, et al. Implications of exosomes as diagnostic and therapeutic strategies in cancer. J Cell Physiol. 2019;234(12):21694–21706. [DOI] [PubMed] [Google Scholar]
- 14. Li Y, Feng W, Kong M, Liu R, Wu A, Shen L, et al. Exosomal circRNAs: a new star in cancer. Life Sci. 2021;269:119039. [DOI] [PubMed] [Google Scholar]
- 15. Han D, Li J, Wang H, Su X, Hou J, Gu Y, et al. Circular RNA circMTO1 acts as the sponge of microRNA‐9 to suppress hepatocellular carcinoma progression. Hepatology. 2017;66(4):1151–1164. [DOI] [PubMed] [Google Scholar]
- 16. Fu L, Yao T, Chen Q, Mo X, Hu Y, Guo J. Screening differential circular RNA expression profiles reveals hsa_circ_0004018 is associated with hepatocellular carcinoma. Oncotarget. 2017;8(35):58405–58416. [DOI] [PMC free article] [PubMed] [Google Scholar]
- 17. Slack FJ. MicroRNAs regulate expression of oncogenes. Clin Chem. 2013;59(1):325–326. [DOI] [PubMed] [Google Scholar]
- 18. Zhao ZJ, Shen J. Circular RNA participates in the carcinogenesis and the malignant behavior of cancer. RNA Biol. 2017;14(5):514–521. [DOI] [PMC free article] [PubMed] [Google Scholar]
- 19. Watanabe H, Okada M, Kaji Y, Satouchi M, Sato Y, Yamabe Y, et al. New response evaluation criteria in solid tumours‐revised RECIST guideline (version 1.1). Gan to Kagaku Ryoho Cancer Chemotherapy. 2009;36(13):2495–2501. [PubMed] [Google Scholar]
- 20. Liu Z, Wang Q, Wang X, Xu Z, Wei X, Li J. Circular RNA cIARS regulates ferroptosis in HCC cells through interacting with RNA binding protein ALKBH5. Cell Death Discovery. 2020;6:72. [DOI] [PMC free article] [PubMed] [Google Scholar]
- 21. Xu J, Ji L, Liang Y, Wan Z, Zheng W, Song X, et al. CircRNA‐SORE mediates sorafenib resistance in hepatocellular carcinoma by stabilizing YBX1. Signal Transduct Target Ther. 2020;5(1):298. [DOI] [PMC free article] [PubMed] [Google Scholar]
- 22. Chen L, Han X. Anti‐PD‐1/PD‐L1 therapy of human cancer: past, present, and future. J Clin Invest. 2015;125(9):3384–3391. [DOI] [PMC free article] [PubMed] [Google Scholar]
- 23. Ke M, Zhang Z, Xu B, Zhao S, Ding Y, Wu X, et al. Baicalein and baicalin promote antitumor immunity by suppressing PD‐L1 expression in hepatocellular carcinoma cells. Int Immunopharmacol. 2019;75:105824. [DOI] [PubMed] [Google Scholar]
- 24. Gupta HB, Clark CA, Yuan B, Sareddy G, Pandeswara S, Padron AS, et al. Tumor cell‐intrinsic PD‐L1 promotes tumor‐initiating cell generation and functions in melanoma and ovarian cancer. Signal Transduct Target Ther. 2016;1:1. [DOI] [PMC free article] [PubMed] [Google Scholar]
- 25. Xue S, Hu M, Li P, Ma J, Xie L, Teng F, et al. Relationship between expression of PD‐L1 and tumor angiogenesis, proliferation, and invasion in glioma. Oncotarget. 2017;8(30):49702–49712. [DOI] [PMC free article] [PubMed] [Google Scholar]
- 26. Kim S, Koh J, Kim MY, Kwon D, Go H, Kim YA, et al. PD‐L1 expression is associated with epithelial‐to‐mesenchymal transition in adenocarcinoma of the lung. Hum Pathol. 2016;58:7–14. [DOI] [PubMed] [Google Scholar]
- 27. Jung HI, Jeong D, Ji S, Ahn TS, Bae SH, Chin S, et al. Overexpression of PD‐L1 and PD‐L2 is associated with poor prognosis in patients with hepatocellular carcinoma. Cancer Res Treat. 2017;49(1):246–254. [DOI] [PMC free article] [PubMed] [Google Scholar]
- 28. Jin L, Li Y, Zhang Z, He T, Hu J, Liu J, et al. miR‐514a‐3p functions as a tumor suppressor in renal cell carcinoma. Oncol Lett. 2017;14(5):5624–5630. [DOI] [PMC free article] [PubMed] [Google Scholar]
- 29. Ozata DM, Li X, Lee L, Liu J, Warsito D, Hajeri P, et al. Loss of miR‐514a‐3p regulation of PEG3 activates the NF‐kappa B pathway in human testicular germ cell tumors. Cell Death Dis. 2017;8(5):e2759. [DOI] [PMC free article] [PubMed] [Google Scholar]
Associated Data
This section collects any data citations, data availability statements, or supplementary materials included in this article.
Supplementary Materials
Figure S1.
Figure S2.
Figure S3.
Figure S4.
Figure S5.
Table S1.
Data Availability Statement
The analyzed data sets generated during the present study are available from the corresponding author on reasonable request.