

Abstract

This study examines the combined production of drop-in fuels and methanol using hydrothermal liquefaction (HTL) as a technological basis in the context of bioenergy and power-to-X (PtX) applications. Given the increasing need for flexibility in a system dominated by fluctuating renewable power, we evaluated flexible methanol operation as a strategy to harness global greenhouse gas (GHG) emissions in a grid-connected HTL setup. In this operation, the biogenic CO2 destination is alternated between methanol synthesis bioenergy with carbon capture and utilization and combined underground storage depending on the hourly electricity price and grid carbon intensity. The results indicate that the strategy has potential to maintain the average fuel carbon intensity within the 65% GHG reduction threshold set by the renewable energy directive III at a minimum methanol price of 870 EUR/t. This approach could facilitate implementation as it does not require dedicated renewable power generation and hydrogen storage, potentially decreasing costs compared to semi-islands and off-grid PtX systems.
1. Introduction
The rapid development of renewable fuel technologies is crucial to enable the energy transition in the transport sector, which contributes to about 20% of the annual global greenhouse gas (GHG) emissions.1 Renewable fuels of nonbiological origin (RFNBO)—i.e., synthetic fuels produced using renewable electricity (e-fuels) and advanced drop-in biofuels are types of renewable fuels supported by EU policies to shift the use of fossil fuels toward more sustainable alternatives. Under the “Fit for 55” EU policy package, the ambition is to achieve 55% reduction of total GHG emissions by 2030 relative to 1990 levels and climate neutrality by 2050, with specific provisions for the transport sector in the renewable energy directive (RED) III. The final revision approved in 2023 sets a target of 29% renewable energy or 14.5% GHG intensity reduction for the transport sector by 2030, introducing a new combined target for RFNBOs and advanced biofuels of 5.5%.
In the field of advanced biofuels, there is increasing focus on the integration potential of different technologies with e-fuels synthesis. Several literature studies have investigated the feasibility of producing e-fuels coupled with biomass-based processes to produce carbon-neutral fuels in the context of bioenergy with carbon capture and utilization (BECCU). The use of biomass as a carbon source has shown potential to deliver e-fuels at a relatively lower cost compared to e-fuels from direct air capture, while maintaining environmental benefits under the premise that the biomass is sustainably sourced. Overall, the cost of different e-fuel options has been reported in the range of 30–64 EUR/GJ with the lowest costs for liquefied bioelectro-methane, bioelectro-methanol, and bioelectro-dimethyl ether produced from biogas via anaerobic digestion or syngas via biomass gasification.2,3 In this regard, the most studied technologies are gasification and anaerobic digestion, mainly due to their high technology readiness level and product compatibility with conventional gas-to-liquid processes such as Fischer–Tropsch and methanol synthesis. Among different e-fuels, e-methanol is regarded as a very attractive option due to the relatively lower production costs and expected high market uptake, particularly in sectors such as the maritime transport in which large volumes of fuel are required.3,4
Despite the extensive literature on bio-e-fuels based on gasification/anaerobic digestion, the integration of biomass-to-liquid technologies with e-fuels has not been explored to the same extent. In these technologies, namely, pyrolysis, solvolysis, and hydrothermal liquefaction (HTL), the main product is a bio-oil that holds potential to be used in existing fossil infrastructure as drop-in fuel. State-of-the-art literature on HTL estimates overall energy efficiencies around 75%, with minimum selling price of drop-in fuels (MFSP) in the range of 15 to 40 EUR/GJ based on lignocellulosic biomass.5−7 Alongside drop-in fuel production, the HTL process delivers a pressurized gaseous byproduct rich in CO2 that holds potential for a cost-effective CO2 purification and further conversion into e-fuels (BECCU), or further liquefaction for underground storage to yield negative emissions (BECCS). Still, based on the literature review conducted, the HTL-BECCU/S concept has remained largely unexplored with only few refs (8–10).
On the other hand, the increased hydrogen requirement of such integration would put more pressure on the hydrogen supply to the process. Typically, in HTL literature, the hydrogen requirement is reported in the order of 5 wt % of the hydrotreated product, being significantly lower than the required for CO2 hydrogenation to e-fuels (for methanol it is about 20%). Furthermore, average, invariable electricity prices and hydrogen supply have been assumed in literature, which becomes unrealistic in integrated e-fuels scenarios where the hydrogen demand and electricity consumption can have a significant increase. For RFNBOs, it has been estimated that the average carbon intensity (CI) of the electricity grid has to be below 90 g CO2,eq/kWh to guarantee their environmental benefits,11,12 being much lower than the reported by most EU countries in 2022 (130–630 g CO2,eq/kWh13) with the exception of France and Sweden. In order to address this issue, techno-economic studies on power-to-X (PtX) plants include dedicated renewable electricity production to avoid grid connection, or assume power purchase agreements to comply with temporal and geographical correlation and additionality criteria.4,14 In the present study, an alternative, novel approach is proposed for a grid connected HTL plant that operates methanol production flexibly, alternating between BECCU and combined CO2 utilization and storage (BECCUS) depending on the CI of the grid and the electricity price.
Flexibility in chemical processes has been approached from multiple perspectives in the literature. A recent review paper by Luo et al.15 indicates a significant overlap in terminology and concepts, based on which a classification is proposed. In this, the ability of a process to vary throughput can be understood as a “volume” type of flexibility, in which equipment is designed to handle peaks in flow rates, and parallel units/process lines can be switched on/off to adjust production level.15 In the present study, these flexibility elements are present given that the process alternates between two operation modes; still, the aim is to evaluate the potential of such a concept without delving into process dynamics, which remain out the scope of the paper. Early assessment of flexibility in process design have been identified as crucial for the adoption of novel chemical processes,15 but until now have remained unexplored in the field of HTL.
This study contributes to this research gap by evaluating the impact of a flexible methanol operation having a steady state HTL baseline from an economic and environmental perspective. For the economic evaluation, colocation with a fossil refinery is assumed due to the potential benefits in CAPEX as studied by de Jong et al.16 Furthermore, the impact of different premium fees on the drop-in fuels and methanol is assessed having as a reference current market prices and incentives in the marine sector, which has not been discussed in existing HTL literature typically focused on the biocrude MFSP estimation. The structure of the paper comprises a methodology section where the process is explained, followed by results and discussions on the techno-economic performance and GHG emissions and finally conclusions and future recommendations.
2. Process Description and Methodology
2.1. Process simulation of Integrated HTL, Carbon Capture, and e-Methanol Production
A simplified process flow diagram is presented in Figure 1 and it is simulated in Aspen Plus V9 (A+) using hierarchies to group the main process steps and adjacent equipment. The size of the plant corresponds to the production of 100 kt/y of drop-in biofuels, equivalent to approximately 2000 barrels-per-day (BPD) or 3.5% of the capacity of a medium size refinery of 68000 BPD capacity. Forestry residues are selected as feedstock for the process as one of the resources listed in Annex IX of RED II (unchanged in RED III)17 that complies with sustainability requirements for advanced biofuels production. The main process steps are described in the following sections, and more detailed process specifications are available in the Supporting Information (Table S4).
Figure 1.
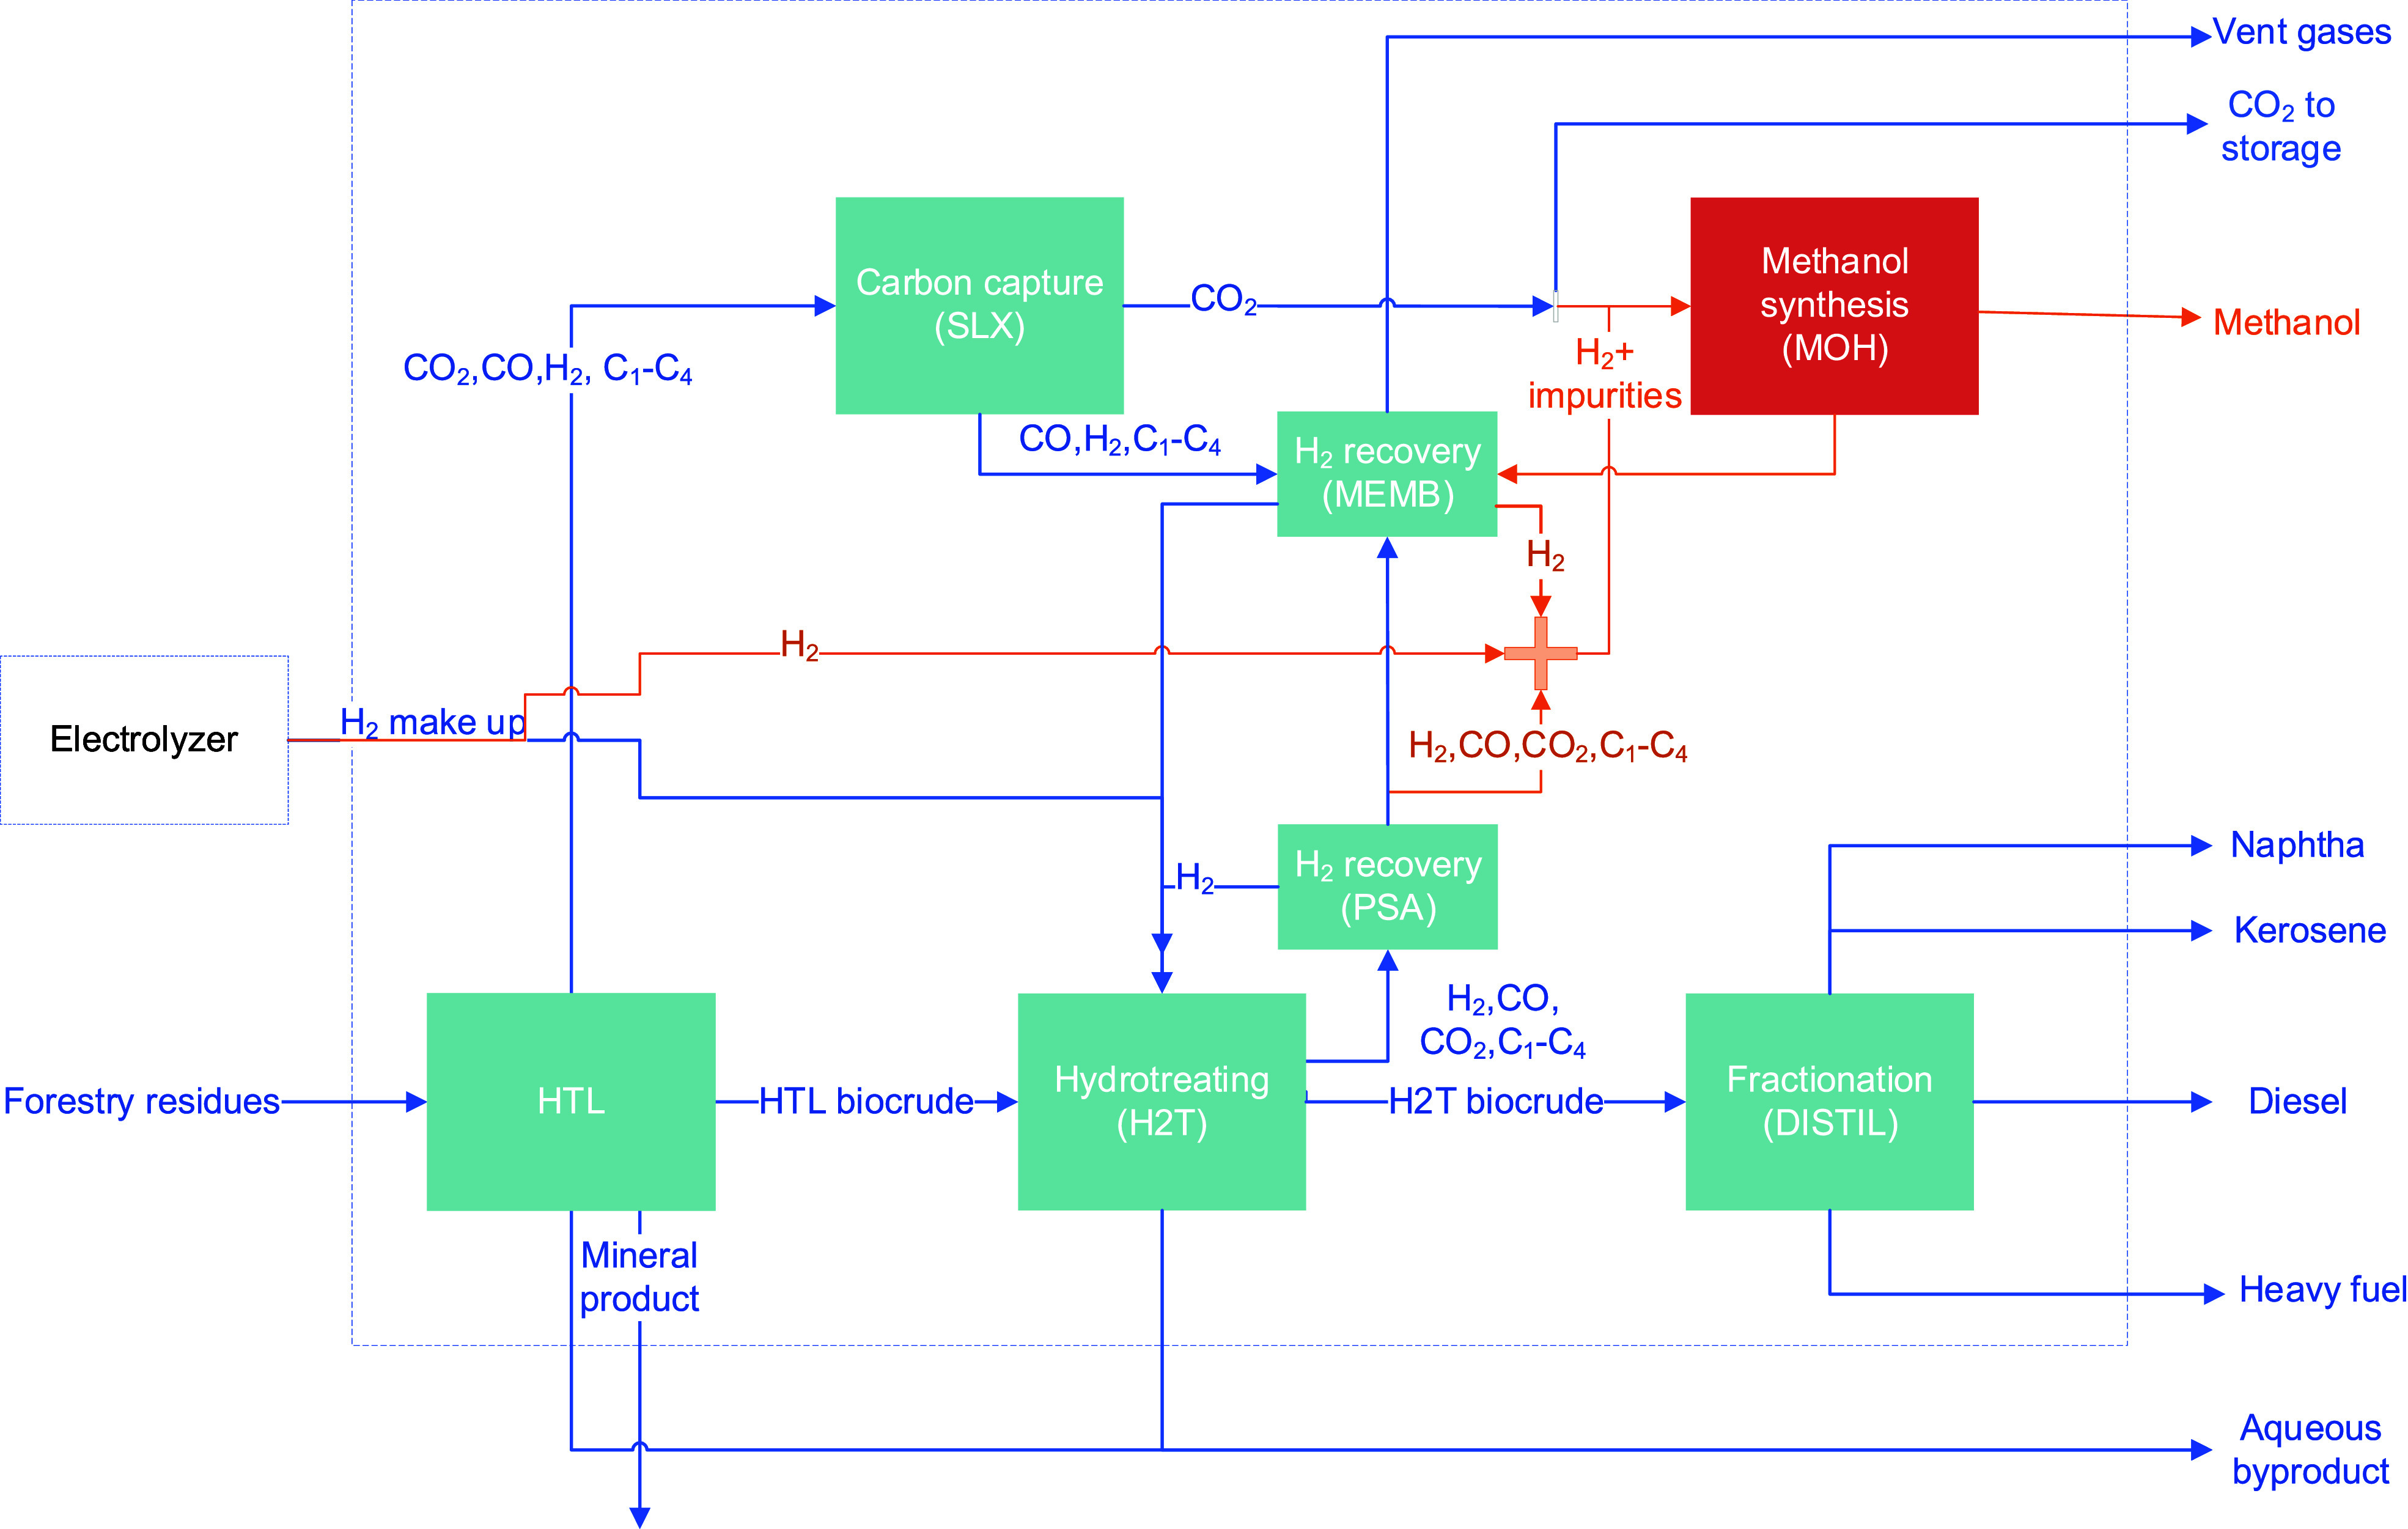
Simplified process flow diagram of the integration of HTL, carbon capture via Selexol (SLX), and methanol synthesis (MOH). Reference BECCS operation in blue and modifications due to methanol synthesis in orange.
2.1.1. HTL, Hydrotreating, and Fractionation: Biomass to Drop-In Fuels
This section describes the HTL process with downstream hydrogenation and fractionation into drop-in fuels, including the main aspects of its modeling in A+. The mass balances of the HTL and hydrotreating processes are set based on the reported yields of the hydrofaction process for woody biomass.18 The input data for modeling the biomass, biocrudes, and gas phases are shown in Tables 1 and 2.
Table 1. Elemental Composition of Woody Biomass, HTL Biocrude, and Hydrotreated Biocrude.
| C [wt %] (daf)a | H [wt %] (daf) | O [wt %] (daf) | HHV [MJ/kg] (daf) | |
|---|---|---|---|---|
| forestry residues18 | 49.1 | 5.9 | 43.7 | 19.9 |
| HTL biocrude18 | 80.0 | 8.4 | 11.0 | 35.9 |
| hydrotreated biocrude18 | 87.4 | 12.6 | 0.0 | 43.9 |
daf: dry-ash free basis,
Table 2. Composition of HTL and Hydrotreater Effluent Gases Used as Input in A+ (Dry Basis).
2.1.1.1. Biomass Liquefaction via HTL
The thermochemical conversion of biomass consists of the use of heat and pressure to induce controlled biomass decomposition that yields different types of products (gaseous, liquid, or solid) depending on the conditions used. The HTL process targets the formation of a liquid biocrude and differs from other thermochemical routes in that the process takes place in an aqueous environment. The produced biocrude is an oxygenated precursor of hydrocarbon fuels that can be further upgraded and distilled to meet product specifications by using standard refinery technology. The main byproducts of the reaction are a gaseous product that contains mainly CO2 and lower concentrations of CO and light hydrocarbons, an aqueous phase with water-soluble organics, and a mineral product in lower quantities formed by higher molecular weight compounds and inorganics from the biomass.
The HTL process is modeled in A+ based on published characterization data of the biomass and the main products (Table 1). The mass balance across the reactor is established according to experimentally reported yields in a dry, ash-free basis for the HTL biocrude and gas phase, and the aqueous phase is calculated by difference. The process is carried out at 400 °C and 300 bar and the yields are based on reported results at pilot scale under aqueous phase recirculation.19 The modeling approach is focused on establishing the overall energy balance across the reactor based on fixed yields and enthalpy estimates of the different input and output streams. Since in this study the biomass input and process conditions are fixed and the focus is on the BECCU(S) implementation, estimation of the yields is considered unnecessary at this point. However, predictive modeling has been widely studied in HTL literature for the estimation of product yields and their qualities for different types of feedstocks and process conditions, both at batch lab scale20,21 and continuous bench-scale operation, the latter more applicable to large-scale techno-economic analysis.22,23
The property package used for simulation in the HTL hierarchy is Soave–Redlich–Kwong as it provides consistent results in the critical region and allows for the use of steam tables for more accurate results in the estimation of the water properties.
The following approach is followed for the different input/output streams of the HTL reactor:
Biomass: defined as a nonconventional solid and the default settings of HCOALGEN are modified for a more accurate representation of the heat of formation (LZN correlation) and heat capacity. A more detailed description can be found in.24
HTL biocrude: mixture of model compounds with adjusted composition to minimize the error in elemental content and specified physical and thermal properties.24
HTL gas phase: composition is known from experiments and reported in Table 2.
HTL aqueous phase: mixture of water and water-soluble organics whose composition is adjusted to minimize the error in TOC based on reported data at pilot scale during aqueous phase recirculation.25
HTL solids/ash: solids production is neglected in this study and the solid product corresponds only to the inorganics present in the biomass in the form of ash. This corresponds to published data reported at supercritical conditions according to which char formation was not observed in significant amounts at pilot scale.18
Downstream of the reactor, cooling and decompression is required for products separation, and in this study, the conditions are specified based on the requirements of subsequent operations in the configurations evaluated, as detailed in the Supporting Information. After separation of the aqueous and organic phases, part of the aqueous phase is evaporated, and the remaining fraction containing most of the carbon is recirculated to reduce carbon losses in the purged fraction and avoid the need for fresh water. This is configured in the simulation by setting the flow of the evaporation residue to match the water required for a biomass slurry of 25% organic content.
2.1.1.2. Biocrude Hydrotreating and Fractionation
The HTL biocrude is fed to the hydrotreating unit in which excess hydrogen is used for heteroatom removal, bonds saturation, and overall improvement of the biocrude quality toward the final drop-in fuels.7
The gaseous phase from the hydrotreating step contains excess hydrogen, with minor quantities of other gases that must be separated prior to hydrogen recycling for the economy of the process. The hydrogen consumption is fixed at 0.04 g/g oil and the total available hydrogen is set as two times the required, equivalent to 1000 NL/L oil, which is in agreement with hydrotreating conditions reported in the literature.18,26
As for the HTL, the H2T process is set up in A+ based on published experimental characterization data of the main products (Tables 1 and 2). The mass balance across the H2T reactor is established according to experimentally reported yields on a dry, ash-free basis for the hydrotreated (H2T) biocrude and gas phase, and the aqueous phase is calculated by difference.
The following approach is followed for the different input/output streams from the hydrotreater reactor:
H2T biocrude: modeled with petro-characterization tools available in A+. Experimentally obtained distillation curve and specific gravity of the hydrotreated biocrude are used to perform a pseudocomponent breakdown for property estimations.
H2T gas: corresponds mainly to unreacted hydrogen with traces of other gases (Table 2).
H2T aqueous phase: the difference in the oxygen content between the HTL biocrude and the H2T biocrude is used to estimate water production via hydrodeoxygenation. Since there are no data available on the composition of the aqueous phase, water-soluble compounds are adjusted to close the mass balance and minimize atom imbalance across the process.
The excess hydrogen in the H2T gas is further purified via pressure swing adsorption (PSA) assuming a recovery of 75% and is recirculated back to the reactor. The use of pure hydrogen for biocrude hydrotreating aligns with the reported experimental data used as reference in the model. A makeup of pure hydrogen is required to compensate for the consumption in the reactor and the losses in the system. Given its low level of impurities, the remaining 25% obtained as blowdown gas from the PSA is fed to the methanol synthesis to maximize hydrogen utilization within the process, and a membrane is included to increase the hydrogen recovery in the overall process (Figure 1).
Fractionation of the hydrotreated biocrude into finished fuels is carried out to estimate the additional energy requirements using a conventional atmospheric crude distillation unit. The implementation in A+ is straightforward since the crude is modeled using pseudocomponents based on the experimental distillation profile (TBP), assuming complete deoxygenation during hydrotreating. The configuration and process conditions specified in the distillation column are based on typical values reported in A+ documentation with design specifications to meet ASTM D86 fuel standards by varying the products flows.27 These can be consulted in the Supporting Information.
2.1.2. Carbon Capture via Physical Absorption—Selexol Process
Removal of impurities from the HTL gas is implemented to increase the purity of the CO2 stream prior to utilization/storage. Regarding the storage option, there is no clear definition of purity requirements available in the literature, however, recommended values for CCS projects or enhanced oil recovery (EOR) applications generally align with ≥95 vol % of CO2 and ≤3–5 vol % of hydrocarbons.28 Regarding the CO2 utilization pathway, the hydrocarbons present in the HTL gas are not known to be contaminants of the methanol synthesis catalyst (Cu/ZnO/Al2O3) in the literature consulted; nevertheless, in the proposed flexible operation, their removal is considered necessary to enable the storage option.
Absorption is a mature technology used for CO2 capture that has been traditionally applied to flue gases with relatively low CO2 partial pressures using chemical solvents. The use of physical solvents is known to be more efficient at higher CO2 pressures due to their higher gas loading and lower heat of absorption compared to chemical solvents, having lower energy requirements for solvent regeneration.29 The Selexol solvent is chosen in this study as it has shown a higher performance compared to other physical solvents in the existing literature mainly due to its high CO2 capacity and high stability.30−34 The solvent consists of a mixture of dimethyl ethers of polyethylene glycol (DEPG) with high solubility for the acid gases CO2 and H2S relative to H2, CO and methane. The process layout can be found in the Supporting Information and is based upon the schemes described in the existing literature regarding the removal of CO2 from high-pressure syngas.35
Prior to absorption, removal of condensables from the HTL gas is necessary due to the high solubility of water and C2+ hydrocarbons in the solvent, which is detrimental for the absorption performance. After condensates removal, the HTL gas is fed to the absorber tower where it enters in contact with the solvent in counter-current mode, facilitating the transport of CO2 to the solvent while the nonsoluble gases are separated as a combustible gas. The gas is fed into a membrane to further separate H2 for the process. The enriched solvent leaves at the bottom of the absorption column and is regenerated by means of consecutive expansion stages to be recycled. The gas from the first expansion steps is typically fed back into the absorption column as it contains significant amounts of combustible gases that are partially dissolved, and CO2 of higher purity is obtained after the last expansion to be fed to the methanol synthesis.
The process is modeled using the PC-SAFT property package recommended for acid gas cleaning processes using the DEPG solvent. This has been validated by Aspen Tech for carbon dioxide absorption with experimental and plant data at different process conditions.29 The binary parameters and properties of the solvent are not available in A+ V9 and were inserted manually, as described in the Supporting Information.
2.1.3. Methanol Synthesis
The methanol synthesis is simulated in A+ based on typical process configurations in state-of-the art literature.36,37 The CO2 is mixed with hydrogen and fed to the reactor at 220 °C and 32 bar, where the following reactions take place (eqs 1–2):
| 1 |
| 2 |
The H2 input is formed by rich-H2 blowdown gas from the PSA system, H2 recovered from combustible gases mix in the membrane system, and pure H2 from the electrolysis system. The pure H2 flow is adjusted to have a stoichiometric number (SN) of two in the reactants mix, which corresponds with a 1:3 stoichiometric ratio approximately. The definition of SN is shown in eq 3 where yi is the mole fraction of each component in the feed gas to the reactor.
| 3 |
The products are cooled to 28 °C at high pressure to separate unreacted gases from the liquid products methanol and water. A purge in the recycle loop of the unreacted gases is necessary to avoid the accumulation of impurities in the system. The liquid methanol is separated from the produced water in a distillation column (see specifications in Supporting Information). The results are compared to the published literature available on CO2 hydrogenation to methanol at different process conditions.
2.1.4. Heat Integration and Energy Balance
Pinch analysis is implemented using an Aspen Energy Analyzer to estimate the minimum utilities requirements in the heat exchanger network (HEN). A minimum temperature approach (ΔTmin) of 10 °C is used as default for the overall process. The minimum utility requirements are compared with the utilities before pinch analysis and with the energy potential in the produced combustible gases (vent gases) to discuss the process potential to be self-sufficient in heat.
The global energy efficiency of the process (ηglobal) is estimated in high heating value basis (HHV) as the energy in the total fuels produced divided by the total energy inputs to the process in the form of biomass, electricity (Win) for hydrogen production and process equipment, and heat (Qin) estimated as the minimum hot utility after heat integration minus the available potential in the vent gases (eqs 4–6):
| 4 |
| 5 |
| 6 |
2.2. Flexibility in Operation: Alternating Operation Modes under Electricity Price/Carbon Intensity Variations
The analysis of flexible operation is conducted based on the results of mass and energy balance of the integrated process. The operation modes evaluated are full utilization of CO2 to methanol (HTL BECCU) and combined utilization and storage (HTL BECCUS), while the scenario of CO2 sent to storage is included for reference (HTL BECCS) (Table 3). The following assumptions are considered:
There are no expected variations in the HTL process induced by the variable methanol production. Thus, the biomass input and drop-in fuels output is the same in the two operation modes.
There are no expected variations in the carbon capture process induced by the variable methanol production since the total CO2 output is maintained constant in the two operation modes.
Step increase/decrease in mass/energy flows during load changes is assumed for simplicity in the analysis, however the overestimation in methanol production during load increase is counteracted by the underestimation during load decrease, thus the impact of this simplification in the overall yearly production is not expected to be significant.
Table 3. Description of Operation Modes in the Integrated HTL Plant and Methanol.
| operation modes | HTL BECCS | HTL BECCU | HTL BECCUS | |
|---|---|---|---|---|
| description | all CO2 to storage | all CO2 to MeOH production | combined utilization and storage | |
| operation | no variation | no variation | MOH system at full capacity | MOH system at half capacity |
| description | N/A | N/A | Operates when the CI of the grid is less than or equal to 90 g CO2,eq/kWh and the electricity price is less than or equal to the cut-off price (varied from 20 to 100 EUR/MWh with 10 EUR/MWh increase) | AND/OR high CI of the grid |
In the HTL BECCUS mode, the methanol production is alternated between full and half capacity depending on the hourly electricity price and carbon intensity (CI) of the grid. The CI of the electricity grid has been identified as a critical parameter to guarantee the environmental benefits of electrofuels, with estimates in the range of 90–150 g CO2,eq/kWh.11,12 The dynamic operation of methanol synthesis via CO2 hydrogenation during load changes has been previously investigated by Cui et al.,38 reporting relatively small fluctuations with a ramp rate of 50% load/h, for which switching between half and full capacity is adopted in the present analysis. The hourly electricity prices and CI of the grid used correspond to historic data for Denmark in the year 2019.39 The cut-off hourly electricity price (i.e., the electricity price at which the methanol production is varied) is evaluated between 20 and 100 EUR/MWh, and the maximum CI of the grid to produce methanol at full capacity is set in 90 g of CO2,eq/kWh. Mass and energy hourly flows of the modes described are obtained in A+ at steady state and the results are used to establish the plant operational profile.
2.2.1. Greenhouse Gas (GHG) Emissions Analysis
A GHG emissions analysis is performed to estimate the carbon footprint of the process based on the emission values and calculation rules provided in Annex V of the RED II.17 The total emissions (E) are calculated from eq 7 as a contribution of emissions from feedstock collection and transport (ef), process-related emissions (ep), and emission savings from CO2 capture and geological storage (eccs)
| 7 |
This calculation excludes additional terms in the original equation related to land-use change, fuel transport, distribution and use, and other savings that are not applicable in the present analysis. The emission factors related to each term are summarized in Table 4. Emissions from feedstock processing and transport (ef) are taken from Annex V for the case of wood chips from forestry residues. Emissions from the process are calculated based on the results of electricity and heat requirements (after heat integration) and the use of catalysts and chemicals reported in ref (18). Emissions savings from CCS (eccs) correspond in the BECCS case to the total CO2 after carbon capture, and in the BECCU(S) to the CO2 that is not used for methanol production (emissions associated with the transport and storage are neglected).
Table 4. Emission Factors Used for the GHG Emission Analysis.
| emission source | value | unit |
|---|---|---|
| fossil comparator for drop-in fuels17 | 94.0 | kg CO2,eq/GJfuel |
| fossil comparator for methanol40 | 101.6 | kg CO2,eq/GJmethanol |
| feedstock processing and transport (500–2500 km) (ef)17 | 8.2 | kg CO2,eq/GJbiomass |
| heating (natural gas) (ep)41 | 56.10 | kg CO2,eq/GJ |
| electricity (ep)39 | a | g CO2,eq/kWh |
| catalysts and chemicals (ep)18 | 15.2 | kg CO2,eq/tbiomass |
Hourly reported CI of the grid.
The total emissions from the process (E) and the CI of each fuel are calculated every hour by using mass allocation. For the drop-in fuels, the GHG emission reduction potential is estimated relative to a fossil comparator of 94 kg CO2,eq/GJ as stipulated in RED II. In absence of a specific value for methanol, a value of 101.6 kg CO2,eq/GJ is used based on the literature.40 The results are evaluated using a 65% GHG reduction threshold that determines the eligibility of renewable fuels from biological origin under RED II (unchanged in RED III).
2.2.2. Economic Feasibility of Integrated Process
The economic feasibility of the process is evaluated by means of the internal rate of return (IRR) over a project lifetime of 25 years (eq 8):
| 8 |
where TCI is the total capital investment and CF is the cash flow of each year calculated as the revenues minus operational expenses based on the cost parameters summarized in Table 5. The impact of price variations on the IRR for different cost parameters is evaluated by means of Monte Carlo analysis implemented in MATLAB over the price range indicated. Subsequently, the impact of premiums on the IRR is evaluated based on the estimated CI of the fuels. The assumptions used to estimate capital and operational expenses are described as follows:
Table 5. Cost Parameters Used as Input for Economic Analysisd.
| unit | reference year | reference | |||
|---|---|---|---|---|---|
| capital costs | HTL + H2T (equipment cost) | 28.6/87 | MEUR/MWbiomass(LHV) | 2015 | (16) |
| MOH system (equipment cost + installation) | 0.34 | MEUR/(t/d MeOH) | 2014 | (45) | |
| operational expenses | biomass (wood chips) | 5.7–7.2 | EUR/GJ | 2019–2021 | (51) |
| wood grinding | 58 | kWh/t | 2018 | (52) | |
| electricity | a | EUR/MWh | 2019 | (53) | |
| grid tariff for transmission, distribution, and taxes | 16.65 | EUR/MWh | -- | (14) | |
| natural gas | 26.5 ± 4.1b | EUR/MWh | 2015–2021 | (54) | |
| cooling | 1.5 | EUR/MWh | -- | -- | |
| wastewater treatment | 1–10 | EUR/t | - | (55) | |
| refining (incl. CAPEX contribution) | 10 | USD/barrel | -- | (44) | |
| CO2 liquefaction, transport, and storage | 50 | EUR/t CO2 | -- | (48) | |
| revenues | gasoline (HEFA reference) | 2000 ± 200 | USD/t | 2023 | c |
| jetfuel (HEFA reference) | 2000 ± 200 | USD/t | 2023 | c | |
| diesel (FAME reference) | 1500 ± 200 | USD/t | 2023 | c | |
| heavy fuel (pyrolysis oil reference) | 600 ± 100 | EUR/t | 2023 | -- | |
| methanol | 400–1200 | EUR/t | -- | -- | |
| CO2 price | 80–160 | EUR/t | -- | -- | |
| excess heat | 10.07 | EUR/GJ | -- | (56) | |
| premium liquid biofuels | 50 | USD/t CO2,eq | -- | c | |
| other parameters | project lifetime | 25 | years | -- | -- |
| corporate tax | 22 | % | -- | - | |
| depreciation period | 10 | years | -- | -- | |
| depreciation schedule | straight line | -- | -- | -- | |
| CEPCI | 576 | -- | 2014 | -- | |
| CEPCI | 557 | -- | 2015 | -- | |
| CEPCI | 607.5 | -- | 2019 | -- | |
| USD to EUR | 1.07 | USD/EUR | 2023 | -- |
Historic hourly wholesale electricity price in Denmark (2019).
Historic data fitted to normal distribution.
Values for HEFA and FAME fuels reference prices and premium fee on fuels provided by GoodFuels, Argus, and Stratas.
Prices reported in DKK by the source were converted to EUR using a factor of 0.13 EUR/DKK.
CAPEX
The purchase equipment cost (TPE) of the HTL conversion and upgrading corresponds to the estimated by de Jong et al. for a centralized supply chain colocated with a refinery (pioneer plant).16 The reported value is scaled to the plant capacity of this study using a scaling factor of 0.6. The total capital investment (TCI) including installation is calculated as TCI = TPE × 4.92 based on typical Lang factors reported for solid–fluid plants42,43 and converted to EUR2019 using the chemical engineering plant cost index (CEPCI).
No specific CAPEX is estimated for the biofuels refining and fractionation section; however, the total operational costs (CAPEX and OPEX, excluding utilities) are estimated based on a cost of 10 EUR/BBL reported for a new conventional conversion refinery operating at full capacity.44
The cost of the methanol synthesis section including installation is estimated based on the correlation provided by the Danish Energy Agency45 as a function of the methanol production capacity and is assumed equivalent to the TCI of this section.
The cost of PEM electrolyzer is estimated based on the correlation proposed by Reksten et al., as a function of the electrolyzer size, projected for the year 2030.46 The size is set based on the maximum H2 requirement in the BECCS and BECCUS scenarios.
The purchased equipment cost of the carbon capture plant (Selexol) is estimated by Aspen Process Economic Analyzer (APEA) in EUR2015 and converted to EUR2019 using the CEPCI.
OPEX
The electricity price corresponds to historic wholesale hourly electricity prices in Denmark (DK1) during 2019. On top of the hourly price, an additional tariff of 16.65 EUR/MWh is included to account for transmission, distribution, and taxes as used in ref (14).
The cost of hydrogen (CostH2) in EUR/t (eq 10) is estimated based on the hourly electricity price (electhourly) in EUR/MWh and the electricity consumption of PEM electrolyzers (elect_usePEM) in kWh/ kg H2, estimated as a function of the load (eq 9), with load as a fraction (>10%) of full load.47 The electrolyzer full load is set equal to the maximum H2 requirement in the BECCS/BECCUS operation modes.
| 9 |
| 10 |
The cost of heating is estimated based on the price of natural gas and assuming a boiler efficiency of 80%. Natural gas prices are randomly generated from a probability distribution fitted based on six-month average prices (level 2) reported during 2015–2021.
The cost for liquefaction, transport, and storage of CO2 is assumed in 50 EUR/t based on abatement costs estimated for CCS projects in Denmark for short-term scenarios.48 This value excludes the capture cost and includes transport at medium pressure (15 bar/–30 °C) by road (50 km), temporary storage, and sea transport (600 km).
Operating labor costs are estimated based on an average EU hourly labor cost of 31.40 EUR/h49 and the operating labor requirements indicated in the literature for solids-fluid processing in a continuous operation (2 operators per shift and 5 shifts per week are assumed).50
REVENUES
Selling prices of drop-in fuels are set based on values provided by GoodFuels†, Argus, and Stratas‡.
Revenues from excess heat sales for district heating are included assuming a conservative 10–30% utilization.
The impact of the methanol price in the IRR is evaluated between 400 EUR/t (fossil reference) and 1200 EUR/t.
The impact of the CO2 price is evaluated between 40 and 160 EUR/t, within the expected range of the EU emissions trading system (EU ETS).
The impact of fuel premiums is evaluated based on a fee of 50 USD/t CO2,eq provided by GoodFuels, Argus, and Stratas.
3. Results and Discussion
3.1. Imulation Results
3.1.1. HTL, Hydrotreating, and Distillation
The conversion of biomass to liquid biofuels via HTL and hydrotreating is the backbone of the process in which the CO2 obtained as byproduct is purified and converted into methanol, as illustrated in the mass Sankey diagram in Figure 2. The process is sized for an annual production of drop-in fuels of 95 kt/y or 2057 BPD, requiring approximately 261 kt/y of forestry residues that result in an overall yield of 35.9% (dry-ash free basis). For reference, this biomass input is in the low range of existing combined heat and power plants in Denmark that use between 0.2 to 1.2 Mt/y (124–750 MW) of woody biomass. The liquid biofuels are predominantly in the diesel range, with comparable production of kerosene, diesel, and heavy fractions. The distillation profiles of the HTL biocrude, hydrotreated mixture and the fuel fractions after distillation are presented in the Supporting Information (Figure S10).
Figure 2.

Mass Sankey diagram of the HTL and integrated methanol synthesis (HTL BECCU).
The maximum methanol production is estimated in 73 kt/y, which corresponds to the full capacity (HTL BECCU), and it is reduced in the scenario with combined CO2 storage (HTL BECCUS) depending on the balance between the two options which is discussed in Section 3.1.5.
The errors in the elemental composition of the biocrudes and elemental balance across the HTL and H2T reactors are, in general, below 10% (Table 6), being relatively higher for the HTL biocrude due to limitations in the model compounds approach used to model this complex mixture. Nevertheless, the approach used to adjust the composition is successful in minimizing overall errors in the elemental composition and enthalpy, which is considered satisfactory for the purpose of the study (a more detailed description of this approach is presented in a previous study by the authors24).
Table 6. Elemental Composition of Modeled Biocrudes vs Experimental Data and Elemental Imbalance Across HTL and H2T.
| HTL
biocrude |
H2T
biocrude |
imbalance
across reactor [%] |
||||||
|---|---|---|---|---|---|---|---|---|
| experimental | model | error [%] | experimental | model | error [%] | HTL | H2T | |
| C [wt %] | 80.0 | 77.4 | 3.2 | 87.4 | 88.2 | 0.9 | 2.1 | 0.7 |
| H [wt %] | 8.4 | 9.1 | 8.3 | 12.6 | 11.7 | 7.0 | 0.4 | 0.5 |
| O [wt %] | 11.0 | 13.6 | 23.6 | 0.0 | 0.1 | -- | 0.3 | 2.1 |
| HHV [MJ/kg] | 35.9 | 38.5 | 7.4 | 43.9 | 44.0 | 0.2 | -- | -- |
| Δhf [MJ/kg]a | –2.2b | –2.2 | –0.1 | –2.0b | –2.1 | –2.5 | -- | -- |
Enthalpy of formation.
Estimated from experimental HHV.
3.1.2. Carbon Capture via Physical Absorption: Selexol Process
The HTL gaseous product rich in CO2 is processed for CO2 purification with the main results summarized in Table 7, showing a CO2 recovery of 98.9% and purity of 96.6 mol %. The main impurities present in the CO2 output stream are methane and C2–4 hydrocarbons, predominantly ethane (1 mol %), propane (0.4 mol %), and butane (0.2 mol %), which is explained by their relatively high affinity for the solvent as compared to H2 and CO. The performance of the Selexol process to capture CO2 from the HTL gas has been studied in more detail in a previous publication.10 Based on the literature review conducted, the hydrocarbon impurities present in the CO2 are not known to be contaminants for the methanol synthesis catalyst (Cu/ZnO/Al2O3), and overall, the final composition seems to be in line with the purity recommendations suggested in the CCS literature (Table 7). Thus, further purification is deemed unnecessary within the scope of the present analysis.
Table 7. Results of Carbon Capture via Physical Absorption (Selexol Process).
| feed gas | combustible gas | CO2 | CO2 purity recommendations28 |
|||
|---|---|---|---|---|---|---|
| CO2-EORa [% v/v] | CO2-EORb [% v/v] | pipeline transportc[% v/v] | ||||
| molar flow [kmol/h] | 424.71 | 124.17 | 300.54 | -- | -- | -- |
| CO2 [mol %] | 69.15 | 2.60 | 96.64 | 96 | ≥95 | >95.5 |
| H2 [mol %] | 22.96 | 78.35 | 0.08 | not reported | not reported | <4 |
| CO [mol %] | 1.64 | 5.51 | 0.05 | 0.1 | not reported | ≤0.2 |
| CH4 [mol %] | 4.82 | 13.49 | 1.25 | 0.7 | ≤5 | ≤2 |
| C2–4 [mol %] | 1.43 | 0.06 | 1.99 | 2.3 | -- | ≤2 |
| total | 100.00 | 100.00 | 100.00 | -- | -- | -- |
| CO2 recovery [%] | 98.90 | |||||
| electricity use [kWh/t CO2] | 156.85 | |||||
| cooling (120–30 °C) [kWh/t CO2] | 66.00 | |||||
| refrigerant (10.5–15.9 °C) [kWh/t CO2] | 75.25 | |||||
| heating requirement [kWh/t CO2] | 0.00 | |||||
Weyburn field supply typical composition.
Kinder-Morgan specification.
Recommended Dynamys project.
On the other hand, the remaining combustible gases from the absorption tower have a high concentration of H2 which can be separated for use within the process using commercially available technologies. In terms of energy consumption, electricity is the main energy input (156.9 kWh/t CO2) primarily used for gas recirculation to the absorber tower (40 bar), while no heat is required for solvent regeneration, with this being a main advantage of physical absorption over traditional chemical absorption. The relatively low electricity need is also explained by the high pressure at which the HTL gas can be delivered upstream, thus, compression of the gas prior to absorption is not necessary.
3.1.3. Methanol Synthesis
The mass and energy balances of the methanol synthesis are presented in Table 8 for the cases considered of full and half methanol production capacity, including two additional references of CO2 hydrogenation from the literature.
Table 8. Mass and Energy Balances of Methanol Synthesis and Literature Data.
| present study MOH full capacity | present study MOH half capacity | Pérez-Fortes et al. (2016)57 | Kiss et al. (2016)36 | |
|---|---|---|---|---|
| reactor model approach | equilibrium | equilibrium | kinetics | kinetics |
| temperature [°C] | 220 | 220 | 210 | 250 |
| pressure [bar] | 31 | 31 | 76.4 | 50 |
| operation | adiabatic | adiabatic | adiabatic | isothermal |
| Mass Balance (t/t MeOH) | ||||
| inputs | ||||
| CO2 | 1.43 | 1.40 | 1.46 | 1.38 |
| H2 | 0.20 | 0.20 | 0.20 | 0.19 |
| impurities | 0.09 | 0.14 | 0.00 | 0.00 |
| total | 1.71 | 1.74 | 1.66 | 1.57 |
| outputs | ||||
| methanol | 1.00 | 1.00 | 1.00 | 1.00 |
| H2O | 0.58 | 0.58 | 0.57 | 0.59 |
| vented gases | 0.14 | 0.16 | 0.09 | 0.00 |
| total | 1.71 | 1.74 | 1.66 | 1.59 |
| Energy Balance (MWh/t MeOH) | ||||
| electricity | 0.19 | 0.22 | 0.17 | 0.55 |
| hot utility | 0.39 | 0.47 | 0.44 | 0.61 |
| cold utility | 1.73 | 1.80 | 0.86 | 1.79 |
| CO2 conversion per pass [%] | 15.03 | 14.23 | 21.97 | 21.50 |
| overall CO2 conversion [%] | 95.94 | 95.82 | 93.85 | not reported |
| MeOH purity [mol %] | 99.00 | 99.00 | 99.96 | 99.98 |
As expected, the achieved CO2 conversion is lower in the process than that reported in the referenced literature based on pure CO2 hydrogenation. This is due to the presence of impurities that must be vented to prevent accumulation within the system with inherent CO2 losses. Impurities in the feed are mainly methane and C2–3 hydrocarbons. In typical CO2 to methanol configurations with virtually pure reactants, purge streams are much lower or even not necessary, and unreacted gases can be fully recirculated. Results from the literature in Table 8 show comparable results despite the different process conditions and modeling approaches. The referenced literature data are mainly based on kinetic models, while the cases here studied are based on equilibrium calculations and thus correspond to maximum possible values.
Minor differences in energy consumption between full and half MOH system capacity can be explained by the slight difference in impurities fed to the system. In the case of full capacity, impurities in the hydrogen feed are diluted with pure hydrogen from the electrolyzer, while at half capacity, the input from the electrolyzer is not required and the concentration of impurities is higher. The impact of impurities on the kinetics is recommended for future evaluation as well as further process improvements. For example, in the study by Pérez-Fortes et al.,57 excess heat is used to generate electricity which is subtracted from the total demand and explains the lower electricity and cooling requirements, while in the results by Kiss et al.,36 the high electricity use can be explained by the higher reaction pressure and the initial CO2 condition at atmospheric pressure.
3.1.4. Heat Integration
The results of the heat integration in the HEN show the potential to decrease utilities in the process up to 89%. Based on pinch analysis and grand composite curves (Figure 3), a minimum hot utility of 15.9 MW at 400 °C is possible in the three cases (HTL BECCS, and BECCU(S)), which suggests the possibility of running the methanol synthesis system coupled to a HTL process without additional heat input, in case heat integration could be fully implemented. Achieving a ΔTmin of 10 °C could be limited in practice by very large heat transfer areas and the high CAPEX of the HEN, so future studies are required to estimate an optimum ΔTmin that minimizes overall costs. Furthermore, in view of the assessed variation in methanol production, utilities of the BECCUS case are estimated as the sum of the minimum utilities in the BECCS case and the minimum utilities of the isolated methanol system, which results in a 10–20% increase in hot utility relative to the minimum by pinch analysis (Figure 3, right).
Figure 3.

Grand composite curves of HEN with ΔTmin = 10 °C (left) and hot and cold utilities in HTL BECCS and HTL BECCUS operation modes (right).
3.1.5. Overall Mass and Energy Balances
The mass, carbon, and energy balances of the integrated process based on steady state simulation results are shown in Figure 4. The drop in fuels are the main product in terms of mass (35%), carbon recovery (65.1%), and energy (60%) relative to the process inputs. The coproduction of methanol results in an increase in carbon efficiency to fuels from 65.1% up to 86.3% in the HTL BECCU case, boosting carbon utilization from biomass significantly. This increase, however, comes at the expense of a significant increase in hydrogen consumption compared to the minimum requirement in the HTL BECCS scenario (×5 times).
Figure 4.

Mass, carbon, and energy balances (HHV base) of HTL BECCS, BECCU, and BECCUS operation modes.
Assuming a fixed electricity consumption of 50.2 kWh/kg H2 (66% LHV efficiency), the process has a global energy efficiency to fuels of 67.4% in the BECCS case and 66.6% in the BECCU(S) scenarios. For reference, slightly lower results in the order of 57–61% have been reported for integrated biomass gasification with electrolysis units to produce methanol (based on electricity-to-hydrogen LHV efficiencies of 67–69%), with carbon efficiencies varying between 64 and 92%.58−60 This indicates a good potential of the HTL technology; however, there is margin to achieve higher carbon and energy efficiency by the valorization of byproduct streams that should be further evaluated.
The carbon losses are distributed between the vent gases (6.5%) and the aqueous phase (8.7%). The production of the aqueous phase from the process is significant, which is explained by the net removal of oxygen from the biomass throughout the process in the form of water, as well as water production in the methanol synthesis.
Based on the results of the energy balance, combustible gases obtained as byproduct have potential to cover about 65% of the total hot utilities estimated after heat integration. In previous techno-economic assessments, we have indicated the potential of the HTL conversion and upgrading to be self-sufficient in heat,9 however these exclude the heat for biofuel fractionation and are based on the calorific value of the combustible gases from HTL that include the H2 content. In the present study, the H2 in the HTL gas is separated and utilized within the process, which reduces external hydrogen demand but increases the requirement of external hot utility. Future studies are recommended to evaluate electrification of the heat demand in the process.
On the other hand, significant excess heat is available from the process, mainly from the HEN in the order of 30 MW between 50 and 100 °C (suitable for fourth generation district heating), with lower amounts potentially at higher temperatures from the HTL reactor (400 °C) and hydrotreater (370 °C). A higher amount of heat is produced in the HTL BECCU cases because of the exothermic nature of the methanol synthesis; however, this surplus is only available at a low temperature estimated between 30 and 60 °C.
3.2. Flexibility in Operation: Alternating Operation Modes under Electricity Price/Carbon Intensity Variations
The hourly mass and energy flows and the hourly electricity price profile and CI are used as inputs in the flexibility assessment. The grid data for Denmark in 2019 used in the present study are compared to those reported for other European countries for the same reference year in Figure 5 (top); however, hourly grid CI is only shown for Denmark since these data were not available for other countries (only annual average values). It can be observed that the price profile of the Danish grid was in general similar to that reported for the countries shown, being within the lowest and highest values. Available data for the year 2021 are shown in Figure 5 (bottom), reflecting the significant increase in prices observed across Europe.
Figure 5.

Sorted hourly grid electricity price and corresponding CI in Denmark (DK1) and in other European countries in 2019 (top) and 2021 (bottom). Data retrieved from refs (39 and 53).
From the reference sorted profile in Figure 5 (Denmark, 2019) and the CI colormap, it can be observed that the hours of grid CI ≤ 90 g of CO2,eq/kWh (dark and light blue dots in price profile) occur predominantly at cut prices below 60 EUR/MWh approximately, while higher CI are predominantly found above this value (more green and yellow-colored points). This explains why, despite allowing more expensive hours at cut electricity prices above 60 EUR/MWh, the annual production of methanol flattens, achieving a maximum of 49 kt/y (Figure 6) that corresponds to an annual average of 67% of the methanol installed capacity. For reference, this production in the range of planned green methanol projects with production capacities between 50 and 300 kt/y, announced in partnership with the shipping company A.P. Møller Maersk with the objective to source 730 kt/y for its methanol-powered fleet by the end of 2025.61
Figure 6.

Estimated annual production of drop-in fuels, CO2 to storage, and methanol in HTL BECCUS concept with varying cut electricity prices.
Regarding H2 production, a minimum load of 60% can be maintained in the electrolyzer, having potential to avoid/decrease the need for hydrogen storage, therefore reducing costs. At increasing cut prices, the average load increases due to the higher methanol production until 72% of the installed capacity.
For reference, the annual average carbon intensities in 2019 were 455, 362, and 205 g CO2,eq/kWh for Netherlands, Germany, and Denmark, respectively.62 Still, the Danish case demonstrates that despite the average being significantly higher than the 90 g of CO2,eq/kWh mark, there are quite some hours with low CI where the operation has potential to be feasible.
3.2.1. Carbon Intensity of Drop-in Fuels and Methanol
Figure 7 shows the estimated GHG emissions under different operation modes, and the corresponding CI of the fuels produced based on mass allocation is presented in Figure 8. Overall, the HTL BECCS case has the best performance and shows potential to produce carbon negative drop-in fuels. This is explained by the relatively high amount of CO2 produced, which can largely compensate the emissions associated with the process under the scope evaluated. In the opposite case, the HTL BECCU scenario results in the highest carbon emissions, being substantially higher for the methanol due to its higher share in the product mix (mass basis), and even in some cases above the fossil benchmark, indicating that, as expected, this operation mode is not environmentally feasible using electricity from the grid. Therefore, the full CO2 utilization to methanol would require a much cleaner grid or dedicated renewable electricity generation, in line with the current trend in PtX studies.4,14
Figure 7.
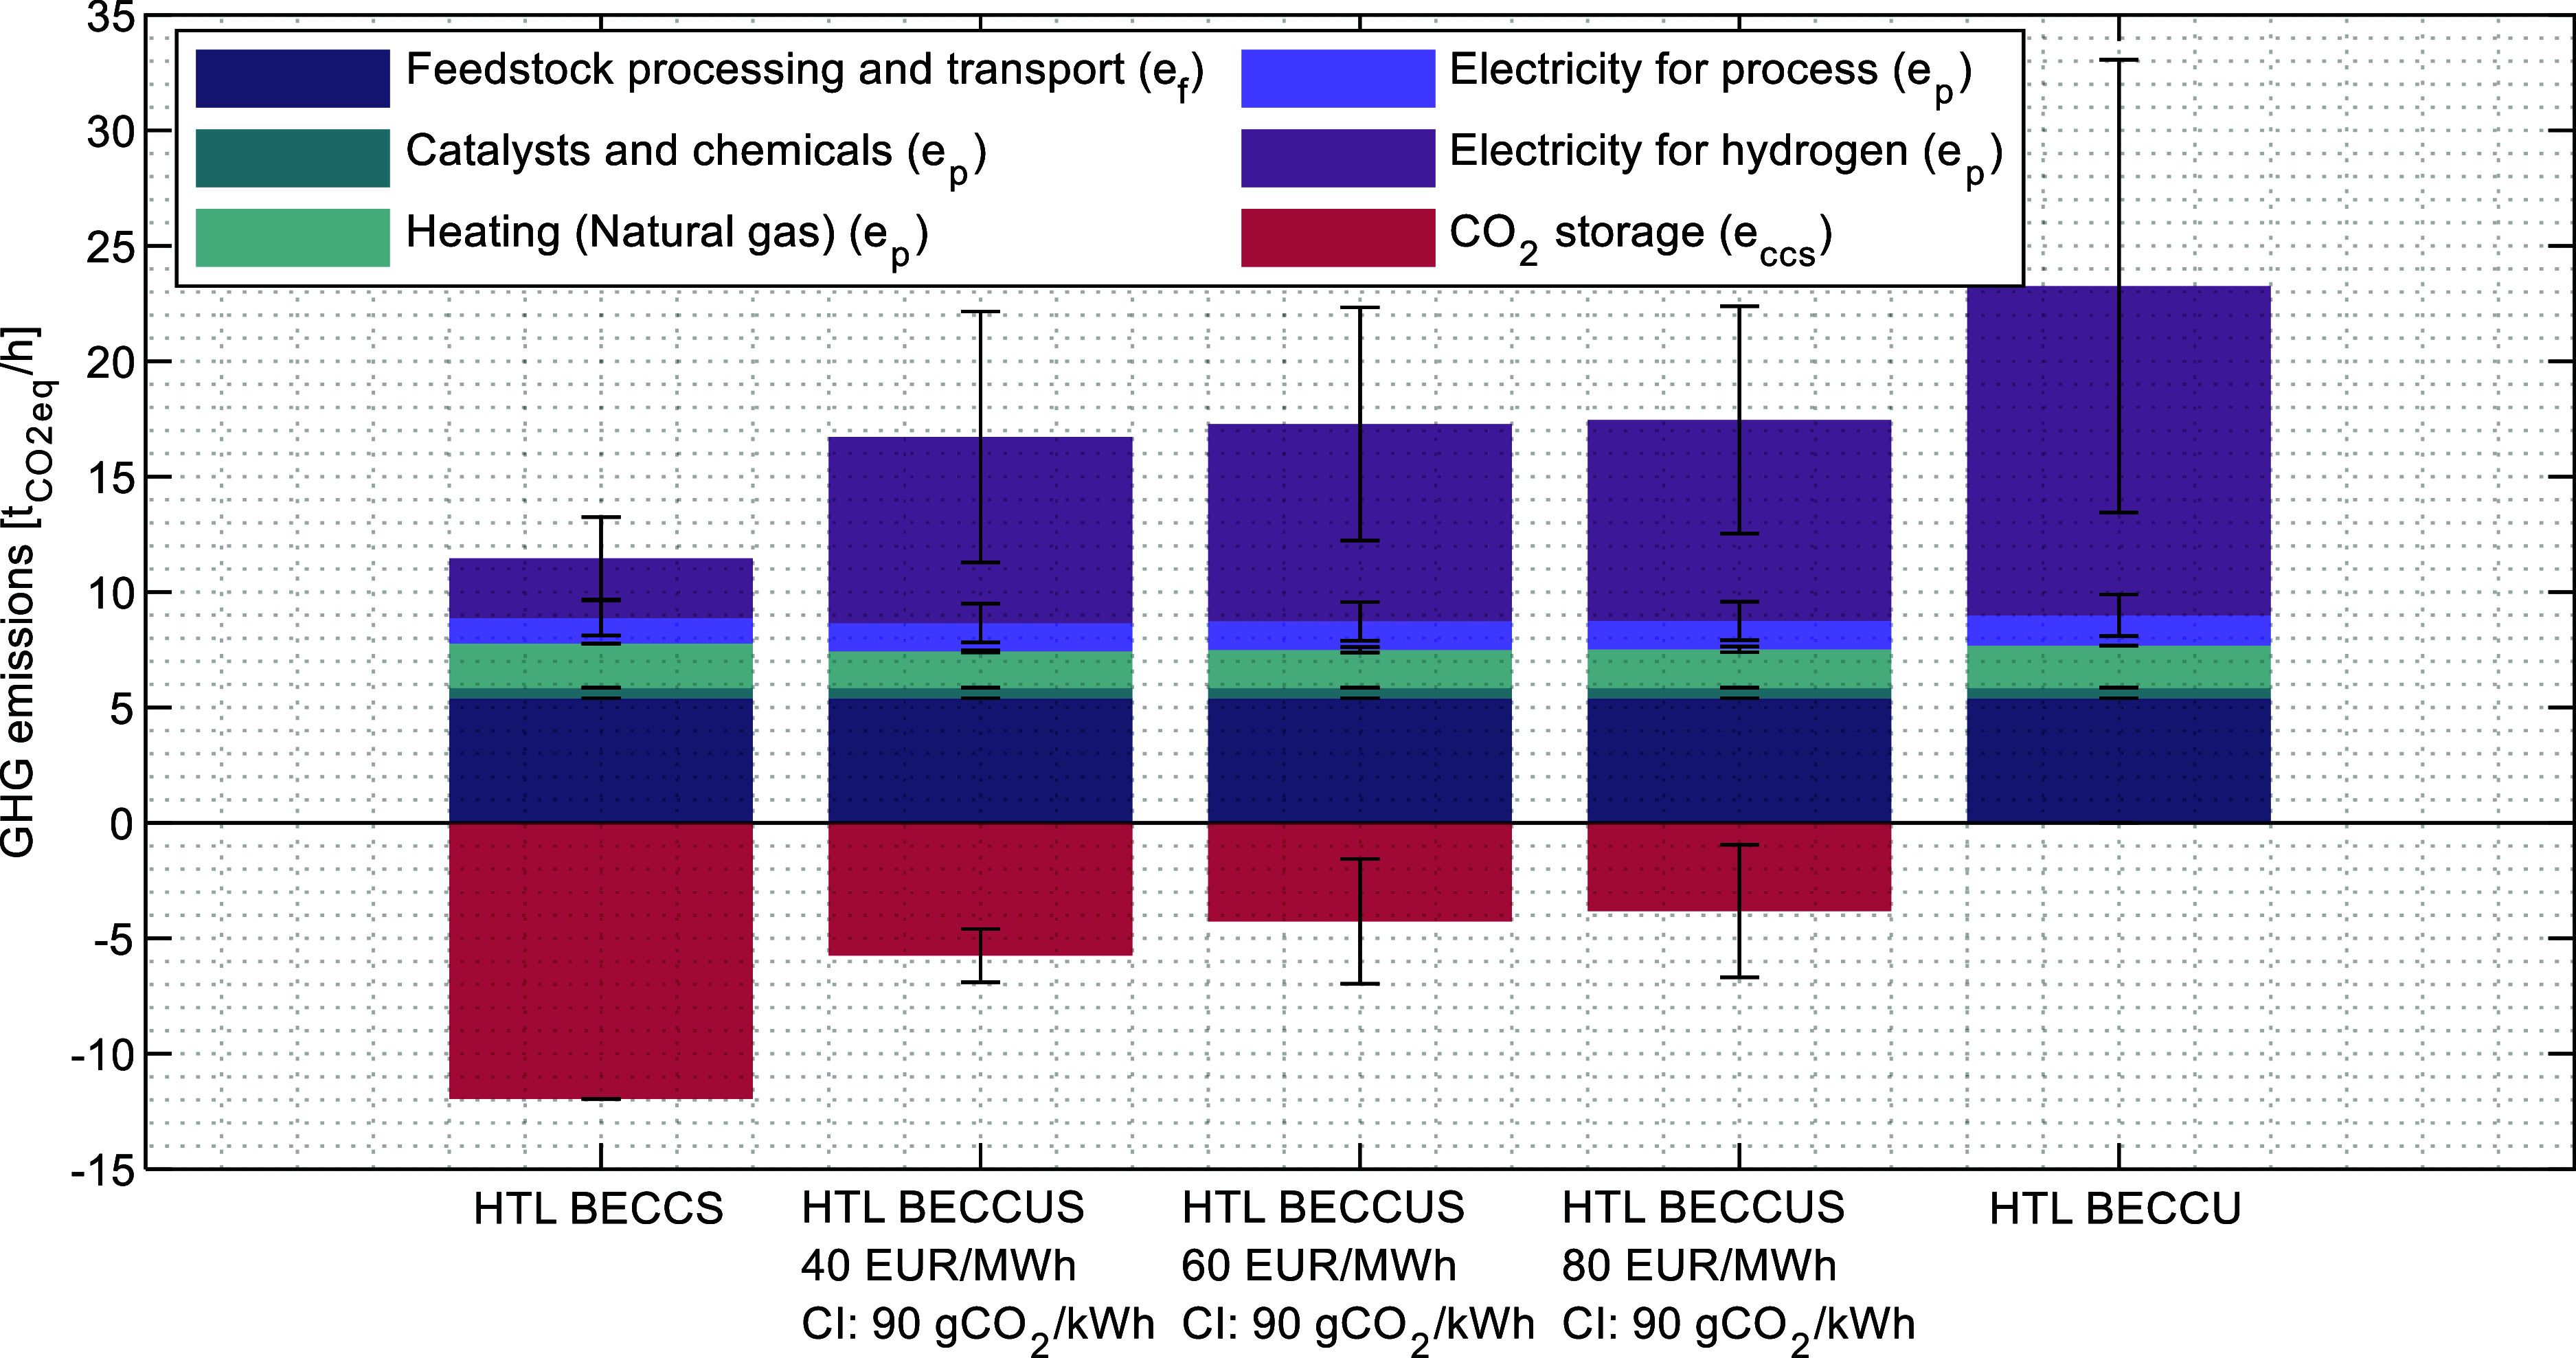
Average hourly GHG emissions in HTL BECCS, BECCUS, and BECCU operation modes. Error bars represent the standard deviation across the year.
Figure 8.

Estimated CI of drop-in fuels and methanol in HTL BECCU(S) cases.
In terms of the variability of the results, high outliers are observed in Figure 8 in all the scenarios but are more numerous in the BECCUS cases of 60 and 80 EUR/MWh cut price. This can be explained by larger variations in the emissions savings from CCS evidenced in Figure 7 by the error bars that represent the standard deviation. Furthermore, the distributions seem to be more compact, leaving more data outside the default range used in Matlab to identify outliers (±1.5 × interquartile range). In the case of the 40 EUR/MWH cut price, emission savings from CCS are higher, therefore lowering the total emissions. On the other hand, in the BECCU scenario a spread distribution can be explained by the higher electricity consumption and hence more exposure to the variability of the grid CI.
Regarding the HTL BECCUS cases, the combination of utilization and storage results in a relatively low fuel CI, which is on average below the threshold values and with potential to produce REDIII-compliant fuels without the need to install additional renewable electricity generation. The average result in the BECCUS cases is around 10 kg CO2,eq/GJ of drop-in fuels and 20 kg CO2,eq/GJ of methanol. It can be observed that the increase in cut price does not result in higher average emissions which can be explained by imposed limit on the grid CI < 90 g CO2/kWh to produce methanol at full capacity, however, the average is slightly lower in the low-cut price. It is worth noticing that methanol is still produced at half capacity at hours when the CI is higher than the 90 g CO2/kWh mark, however the CO2 sent to storage seems to be sufficient at compensating the increased emissions.
Even though it is well-known that the results presented are highly dependent on the choice of allocation method, mass allocation is considered suitable in this case, as it rightfully allocates higher emissions to the methanol than to the drop-in fractions. This reflects the fact that methanol is the most demanding product in terms of hydrogen, which is the main CO2 contributor in the process, even though its heating value is only about half of the drop-in fuels. Nevertheless, a life-cycle assessment is recommended in future studies to provide a more thorough analysis of the environmental impacts.
3.2.2. Economic Feasibility
Figure 9 presents the average cost breakdown of the HTL BECCS and BECCUS operation modes expressed per kilogram of drop-in fuels produced, which is constant in the two cases (i.e., the aggregated drop-in fuel fractions).
Figure 9.

Cost breakdown in HTL BECCS and HTL BECCUS scenarios (cut electricity price = 60 EUR/MWh), excluding taxes. Revenues correspond to CO2 = 40 EUR/t and methanol = 800 EUR/t.
The BECCS case is presented as a reference case in which there is no methanol production, and the hydrogen consumption is only for biocrude hydrogenation (no increased electrolyzer capacity is required). From the total expenses, the average production cost of the aggregated drop-in fuels is estimated to be 1.33 EUR/kg or 30 EUR/GJ (excluding taxes), which is in the range of existing HTL literature but slightly higher than our previous estimates due to the additional costs for fractionation and refining. The revenues from the drop-in fuels sales, dominated by the jetfuel and diesel fractions, seem sufficient to cover the production costs including carbon capture, liquefaction, and storage; however, a more accurate picture of the overall profitability of this scenario including taxes is discussed further on based on the IRR results. The cost breakdown of the BECCUS case in Figure 9 corresponds to the scenario of cut electricity price = 60 EUR/MWh that has an annual methanol production of 46.5 kt (see Figure 6). This is chosen since above this cut price, the operation profile of the BECCUS case does not change significantly. The CAPEX contributes to 25% of the costs, followed by the hydrogen (23%), biomass (22%), fixed OPEX (21%) and the remaining OPEX related costs.
The breakdown of the CAPEX in Table 9 shows about 56% of the investment corresponds to the HTL conversion and upgrading, followed by the methanol synthesis with 19%, and the remaining 25% being distributed between the electrolyzer (8%), the carbon capture process (7%) and the compressors for hydrogen recirculation (10%).
Table 9. Summary of Capital Costs of Integrated HTL Plant, Carbon Capture, and Methanol Synthesis.
| process hierarchy | source | total purchased equipment (TPE) [MEUR2019] | HTL BECCS | HTL BECCU(S) |
|---|---|---|---|---|
| equipment + installation [MEUR] (FCI) | equipment + installation [MEUR] (FCI) | |||
| HTL conversion and upgrading (HTL + H2T) | (16) | 45.94 | 215.46 | 215.46 |
| carbon capture (SLX) | APEA | 5.45 | 25.54 | 25.54 |
| hydrogen separation (PSA & MEMB—compressors only) | APEA | 8.32 | 39.01 | 39.01 |
| methanol synthesis system (MOH) | (45) | -- | -- | 74.21 |
| PEM electrolyzer | (46) | -- | 7.06 | 31.41 |
| total fixed capital investment (FCI) [MEUR] | 287.08 | 385.63 | ||
| total capital investment [TCI = FCI + working capital (5%)] [MEUR] | 301.43 | 404.91 | ||
The CAPEX of the electrolyzer46 corresponds to a projected 2030 cost of 322 USD/kWe and 368.5 USD/kWe for the BECCUS and BECCS scenarios, respectively, which reflects the impact of scale and is in the order of magnitude but lower than the estimated 2025 projection of 410 USD/kWe63 (same capacity as in BECCU). The PSA and membrane units are not included as their size is unknown for the time being; however, these are not expected to drastically change the results since the major units are included. It is worth to mention that the CAPEX estimation for the HTL conversion and upgrading includes an additional 10% for missing equipment.16 Furthermore, the uncertainty in the investment costs affects the scenarios considered in the same way; thus, more focus is put on the relative differences than on absolute values. Based on the difference in expenses between the BECCS and BECCUS cases and the ratio of drop-in fuels/methanol, a theoretical minimum methanol price that covers the increase in total production costs is estimated in 870 EUR/t. However, a more accurate cost estimation is included based on the IRR and the impact of the CO2, methanol and cut electricity prices.
The results of the IRR from the MonteCarlo analysis are presented in Figures 10–14 for different variations.
Figure 10.

Impact of varying the methanol price in the IRR at the lowest and highest CO2 price (BECCUS cut price = 60 EUR/MWh).
Figure 14.

Impact of Premiums on the IRR of HTL BECCS and HTL BECCUS cases.
In the BECCS case, the average IRR is estimated between 11 and 15% over the CO2 price range considered while in the BECCUS case the range is broader being between 3.5 and 15% depending mainly on the methanol price (Figure 10). Both cases show a relatively small dependence on the price of the CO2 compared to the strong dependence on the price of the methanol in the HTL BECCUS case. This is explained by the difference in price between the two products, attenuated by the small margin in CO2 revenues after deducting an extra 50 EUR/t for compression, transport, and storage. The impact of varying methanol price is shown in Figure 11 for the cases of 40, 60, and 80 EUR/MWh. As expected, at low methanol prices, a low-cut price is more favorable for the IRR since less methanol is produced, and the opposite trend is observed at high methanol prices. The similarity between the 60 and 80 EUR/MWh is explained by the relatively small changes in product flows above 60 EUR/MWh, which is due to the constraint on the CI of the grid that limits the full-methanol capacity hours (see Figure 6). A closer look at the relationship between CO2 and methanol prices is presented in Figure 12, in which the different lines represent equal IRR of the HTL BECCS and BECCUS cases at different cut prices. The results show that a minimum methanol price of 970 EUR/t is needed to make the BECCUS case economically attractive compared to the storage option at a relatively low CO2 price of 40 EUR/t. As the CO2 price increases, it puts pressure on the methanol price required to match the HTL BECCS business case, being 1200 EUR/t at a CO2 price of 140 EUR/t approximately. This trend provides evidence of a competition between the utilization and storage options at increasing CO2 prices. Within this price range, the average IRR is between 12 and 15%, being above the 10% rate typically used as indication of profitability by a relatively close margin. Thus, further process improvements are needed to improve the business case.
Figure 11.

Impact of varying the methanol price for different cut electricity prices (fixed CO2 price = 80 EUR/t).
Figure 12.

Minimum methanol selling price to equal the IRR of the HTL BECCS case at increasing CO2 prices.
Figure 14 shows the impact of the variation of all cost parameters in the IRR as well as the influence of premiums based on the results of the fuels CI (Figure 13), in which a tariff of 50 USD (46.7 EUR) per tonne of CO2,eq reduced relative to the fossil baseline has been assumed. The introduction of premiums increases the IRR between 4 and 6%, being more positive in the HTL BECCS than in the BECCUS case. This is due to the lower CI of the fuels in the HTL BECCS operation that is reflected in a higher premium of the drop-in fuels (180–190 EUR/t in average) compared to the HTL BECCUS case where the premiums are lower due to the higher emissions allocated (150–160 EUR/t for the drop-in fuels and 80 EUR/t for the methanol).
Figure 13.

Estimated premiums based on the CI of drop-in fuels and methanol in HTL BECCU(S) cases.
4. Conclusions
This study evaluates the techno economic and GHG emission performance of an integrated HTL plant with carbon capture and methanol synthesis, exploring the potential benefits and limitations of such an integration in the context of BECCU(S) processes under flexible operation using electricity from the grid.
In terms of carbon efficiency, the production of methanol coupled to the HTL process results in an increase in carbon efficiency to fuels from 65.1 to 86.3%, boosting carbon utilization from biomass significantly. In the scenario of full utilization of CO2 to methanol for a grid connected HTL plant (HTL BECCU), the main limitation is the CI of the methanol produced, estimated in the order of 25–65 kg CO2,eq/GJ. These results are noncompliant under the RED III requirements for renewable fuels and therefore a HTL BECCU operation would require dedicated renewable electricity generation or a much cleaner grid.
On the other hand, a flexible operation that alternates methanol production with CO2 to storage (HTL BECCUS) is identified as an interesting option for grid connected HTL plants. In terms of GHG emissions, the flexible operation has potential to deliver REDIII compliant fuels with an average CI around 15 kg of CO2,eq/GJ for the drop-in fuels and 30 kg of CO2,eq/GJ for methanol. In this sense, the Danish case study assessed demonstrates that even though the annual average CI of the grid is considerably higher than the 90 g CO2,eq/kWh mark, there are quite some hours with lower CI where the operation has the potential to be feasible and applicable in other countries. Still, future studies are necessary to understand the dynamics of the process at a more detailed level and to assess environmental impacts in more holistic way based on LCA studies.
In terms of the economic feasibility, the results indicate that the HTL BECCUS case has potential to benefit the HTL BECCS business case at methanol prices above 970 EUR/t on average, being within the expected range of green methanol discussed in the literature. Even though increasing CO2 prices and fuel premiums is in general desirable to benefit the overall profitability of the process, the results show that premiums applied on the basis on GHG emissions reduction can make the BECCUS operation less favorable compared to the HTL BECCS business case. This is due to the lower CI of the drop-in fuels produced when savings from CO2 storage are included compared to those from the utilization route. Furthermore, process improvements are recommended in future evaluations to decrease CO2 emissions from heating, increase jet fuel and diesel fractions from additional heavy residue processing, and evaluate the use of the naphtha fraction for chemical production that could be beneficial in the context of process integration in industrial PtX hubs.
Acknowledgments
This project was supported by a research grant (VIL51464) from VILLUM FONDEN and by REACT-EU under the Light House Initiative (Light House South Phase 1).
Supporting Information Available
The Supporting Information is available free of charge at https://pubs.acs.org/doi/10.1021/acs.iecr.3c04157.
Description of Aspen Plus models, streams summary, and distillation profiles of HTL biocrudes (PDF)
The authors declare no competing financial interest.
Supplementary Material
References
- Ritchie H.; Roser M.; Rosado P.. CO2 and Greenhouse Gas Emissions. Published online at OurWorldInData.org. 2020. https://ourworldindata.org/co2-and-greenhouse-gas-emissions.
- Grahn M.; Malmgren E.; Korberg A. D.; Taljegard M.; Anderson J. E.; Brynolf S.; Hansson J.; Skov I. R.; Wallington T. J. Review of electrofuel feasibility—cost and environmental impact. Prog. Energy 2022, 4 (3), 032010. 10.1088/2516-1083/ac7937. [DOI] [Google Scholar]
- Mukherjee A.; Bruijnincx P.; Junginger M. Techno-economic competitiveness of renewable fuel alternatives in the marine sector. Renewable Sustainable Energy Rev. 2023, 174, 113127. 10.1016/j.rser.2022.113127. [DOI] [Google Scholar]
- Kountouris I.; Langer L.; Bramstoft R.; Münster M.; Keles D. Power-to-X in energy hubs: A Danish case study of renewable fuel production. Energy Policy 2023, 175, 113439. 10.1016/j.enpol.2023.113439. [DOI] [Google Scholar]
- Yáñez É.; Meerman H.; Ramírez A.; Castillo É.; Faaij A. Assessing bio-oil co-processing routes as CO2 mitigation strategies in oil refineries. Biofuels, Bioprod. Biorefin. 2021, 15 (1), 305–333. 10.1002/bbb.2163. [DOI] [Google Scholar]
- de Jong S.; Hoefnagels R.; Faaij A.; Slade R.; Mawhood R.; Junginger M. The feasibility of short-term production strategies for renewable jet fuels—a comprehensive techno-economic comparison. Biofuels, Bioprod. Biorefin. 2015, 9 (6), 778–800. 10.1002/bbb.1613. [DOI] [Google Scholar]
- Castello D.; Pedersen T.; Rosendahl L. Continuous Hydrothermal Liquefaction of Biomass: A Critical Review. Energies 2018, 11 (11), 3165. 10.3390/en11113165. [DOI] [Google Scholar]; [cited 2019 Sep 24]
- Hansen N. H.; Pedersen T. H.; Rosendahl L. A. Techno-economic analysis of a novel hydrothermal liquefaction implementation with electrofuels for high carbon efficiency. Biofuels, Bioprod. Biorefin. 2019, 13 (3), 660–672. 10.1002/bbb.1977. [DOI] [Google Scholar]; [cited 2019 Sep 6]
- Lozano E. M.; Pedersen T. H.; Rosendahl L. A. Integration of hydrothermal liquefaction and carbon capture and storage for the production of advanced liquid biofuels with negative CO2 emissions. Appl. Energy 2020, 279, 115753. 10.1016/j.apenergy.2020.115753. [DOI] [Google Scholar]
- Lozano E. M.; Petersen S. B.; Paulsen M. M.; Rosendahl L. A.; Pedersen T. H. Techno-economic evaluation of carbon capture via physical absorption from HTL gas phase derived from woody biomass and sewage sludge. Energy Convers. Manage.: X 2021, 11, 100089. 10.1016/j.ecmx.2021.100089. [DOI] [Google Scholar]
- Bellona . Consultation Response—EU Hydrogen Strategy—June 2020. 2020. https://bellona.org/publication/consultation-response-08-06-eu-hydrogen-strategy (accessed Sep 7, 2023).
- The Danish Council on Climate Change . Status Outlook 2022, 2022. https://klimaraadet.dk/en/publications.
- Statista . Carbon intensity of the power sector in the European Union in 2022, by country. 2023. https://www.statista.com/statistics/1291750/carbon-intensity-power-sector-eu-country/.
- Campion N.; Nami H.; Swisher P. R.; Vang Hendriksen P.; Münster M. Techno-economic assessment of green ammonia production with different wind and solar potentials. Renewable Sustainable Energy Rev. 2023, 173, 113057. 10.1016/j.rser.2022.113057. [DOI] [Google Scholar]
- Luo J.; Moncada J.; Ramirez A. Development of a Conceptual Framework for Evaluating the Flexibility of Future Chemical Processes. Ind. Eng. Chem. Res. 2022, 61 (9), 3219–3232. 10.1021/acs.iecr.1c03874. [DOI] [Google Scholar]
- de Jong S.; Hoefnagels R.; Wetterlund E.; Pettersson K.; Faaij A.; Junginger M. Cost optimization of biofuel production - The impact of scale, integration, transport and supply chain configurations. Appl. Energy 2017, 195, 1055–1070. 10.1016/j.apenergy.2017.03.109. [DOI] [Google Scholar]
- EU . Directive (EU) 2018/2001 of the European Parliament and of the Council of 11 December 2018 on the promotion of the use of energy from renewable sources (Recast) (Text with EEA relevance.) OJL 328, 82–209, Official Journal of the European Union. 2018. https://eur-lex.europa.eu/eli/dir/2018/2001/oj.
- Jensen C. U.; Guerrero J. K. R.; Karatzos S.; Olofsson G.; Iversen S. B. 10—HydrofactionTM of forestry residues to drop-in renewable transportation fuels. Direct Thermochemical Liquefaction Energy Appl. 2018, 319–345. 10.1016/B978-0-08-101029-7.00009-6. [DOI] [Google Scholar]
- Jensen C. U.; Rodriguez Guerrero J. K.; Karatzos S.; Olofsson G.; Iversen S. B. Fundamentals of HydrofactionTM: Renewable crude oil from woody biomass. Biomass Convers. Biorefin. 2017, 7 (4), 495–509. 10.1007/s13399-017-0248-8. [DOI] [Google Scholar]; [cited 2019 Sep 26]
- Valdez P. J.; Tocco V. J.; Savage P. E. A general kinetic model for the hydrothermal liquefaction of microalgae. Bioresour. Technol. 2014, 163, 123–127. 10.1016/j.biortech.2014.04.013. [DOI] [PubMed] [Google Scholar]
- Yang J.; He Q. S.; Corscadden K.; Niu H.; Lin J.; Astatkie T. Advanced models for the prediction of product yield in hydrothermal liquefaction via a mixture design of biomass model components coupled with process variables. Appl. Energy 2019, 233–234, 906–915. 10.1016/j.apenergy.2018.10.035. [DOI] [Google Scholar]
- Jiang Y.; Jones S. B.; Zhu Y.; Snowden-Swan L.; Schmidt A. J.; Billing J. M.; Anderson D. Techno-economic uncertainty quantification of algal-derived biocrude via hydrothermal liquefaction. Algal Res. 2019, 39, 101450. 10.1016/j.algal.2019.101450. [DOI] [Google Scholar]
- Li S.; Jiang Y.; Snowden-Swan L. J.; Askander J. A.; Schmidt A. J.; Billing J. M. Techno-economic uncertainty analysis of wet waste-to-biocrude via hydrothermal liquefaction. Appl. Energy 2021, 283, 116340. 10.1016/j.apenergy.2020.116340. [DOI] [Google Scholar]
- Lozano E. M.; Pedersen T. H.; Rosendahl L. A. Modeling of thermochemically liquefied biomass products and heat of formation for process energy assessment. Appl. Energy 2019, 254, 113654. 10.1016/j.apenergy.2019.113654. [DOI] [Google Scholar]; [cited 2019 Oct 8]
- Jensen C. U.PIUS—Hydrofaction Platform with Integrated Upgrading Step; Aalborg University; 2018. https://vbn.aau.dk/da/publications/pius-hydrofactiontm-platform-with-integrated-upgrading-step.
- Elliott D. C. Historical Developments in Hydroprocessing Bio-oils. Energy Fuels 2007, 21 (3), 1792–1815. 10.1021/ef070044u. [DOI] [Google Scholar]
- Aspen Tech . Modeling Petroleum Processes; Aspen Technology, Inc., 1997. [Google Scholar]
- de Visser E.; Hendriks C.; Barrio M.; Mølnvik M. J.; de Koeijer G.; Liljemark S.; Le Gallo Y. Dynamis CO2quality recommendations. Int. J. Greenhouse Gas Control 2008, 2 (4), 478–484. 10.1016/j.ijggc.2008.04.006. [DOI] [Google Scholar]
- Dyment J., Watanasiri S.. Acid Gas Cleaning using DEPG Physical Solvents: Validation with Experimental and Plant Data. WHITE PAPER; Aspen Technology Inc., 2015. 1–18. https://www.aspentech.com/en/resources/white-papers/acid-gas-cleaning-using-depg-physical-solvents---validation-with-experimental-and-plant-data.
- Porter R. T. J.; Fairweather M.; Kolster C.; Mac Dowell N.; Shah N.; Woolley R. M. Cost and performance of some carbon capture technology options for producing different quality CO2 product streams. Int. J. Greenhouse Gas Control 2017, 57, 185–195. 10.1016/j.ijggc.2016.11.020. [DOI] [Google Scholar]
- Ramzan N.; Shakeel U.; Güngör A.; Zaman M.. Techno-Economic Analysis of Selexol and Sulfinol Processes for Pre-Combustion CO 2 Capture. In 2018 International Conference on Power Generation Systems and Renewable Energy Technologies (PGSRET); IEEE, 2018; pp 1–6. https://ieeexplore.ieee.org/document/8686026/.
- Field R. P.; Brasington R. Baseline flowsheet model for IGCC with carbon capture. Ind. Eng. Chem. Res. 2011, 50 (19), 11306–11312. 10.1021/ie200288u. [DOI] [Google Scholar]
- Padurean A.; Cormos C.-C.; Agachi P.-S. Pre-combustion carbon dioxide capture by gas-liquid absorption for Integrated Gasification Combined Cycle power plants. Int. J. Greenhouse Gas Control 2012, 7, 1–11. 10.1016/j.ijggc.2011.12.007. [DOI] [Google Scholar]
- Doctor R. D.; Molburg J. C.; Thimmapuram P. R.; Berry G. F.; Livengood C. D.. Gasification Combined Cycle: Carbon Dioxide Recovery, Transport, and Disposal; Argonne National Lab: Argonne, IL, 1994. http://www.osti.gov/servlets/purl/10190542-Vijz59/webviewable/.
- Martelli E.; Gatti M.; Maréchal F.; Consonni S.. Multi-objective Optimization of a Selexol® Process for the Selective Removal of CO2 and H2S from Coal-derived Syngas. In Conference: Proceedings of ECOS Internetional Conference, Pau, France, July 2015, 2015. https://www.researchgate.net/publication/280304692_Multi-objective_Optimization_of_a_SelexolR_Process_for_the_Selective_Removal_of_CO2_and_H2S_from_Coal-derived_Syngas [cited 2020 Sep 4].
- Kiss A. A.; Pragt J. J.; Vos H. J.; Bargeman G.; de Groot M. T. Novel efficient process for methanol synthesis by CO2 hydrogenation. Chem. Eng. J. 2016, 284, 260–269. 10.1016/j.cej.2015.08.101. [DOI] [Google Scholar]
- Nestler F.; Müller V. P.; Ouda M.; Hadrich M. J.; Schaadt A.; Bajohr S.; Kolb T. A novel approach for kinetic measurements in exothermic fixed bed reactors: advancements in non-isothermal bed conditions demonstrated for methanol synthesis. React. Chem. Eng. 2021, 6 (6), 1092–1107. 10.1039/D1RE00071C. [DOI] [Google Scholar]
- Cui X.; Kær S. K.; Nielsen M. P. Energy analysis and surrogate modeling for the green methanol production under dynamic operating conditions. Fuel 2022, 307, 121924. 10.1016/j.fuel.2021.121924. [DOI] [Google Scholar]
- ENERGINET . Declaration Emissions per Hour (Discontinued, please read description). 2023. [cited 2023 Sep 22]. https://www.energidataservice.dk/tso-electricity/DeclarationEmissionHour.
- IRENA and Methanol Institute . Innovation Outlook: Renewable Methanol; IRENA, 2021. [Google Scholar]
- Dröge R.; Ligterink N. E.; Koch W. W. R.. Update of the Netherlands List of Fuels in 2021; TNO; 2021 R11314. 2021. [cited 2023 Sep 7]. https://repository.tno.nl/islandora/object/uuid%3A2f9779a2-dd73-4f7f-9494-a44ddb7550d6.
- Ereev S. Y.; Patel M. Standardized cost estimation for new technology (SCENT)—methodology and tool. J. Bus. Chem. 2012, 9, 31–48. [Google Scholar]
- de Jong S.Green horizons: On the production costs, climate impact and future supply of renewable jet fuels. Dissertation, Utrecht University, 2018. https://dspace.library.uu.nl/handle/1874/364514. [Google Scholar]
- Favennec J. P.Economics of Oil Refining. In The Palgrave Handbook of International Energy Economics; Palgrave Macmillan: Cham, 2022; pp 59–74. 10.1007/978-3-030-86884-0_3. [DOI] [Google Scholar]
- Danish Energy Agency . Technology Data-Renewable Fuels. 2023. https://ens.dk/service/fremskrivninger-analyser-modeller/teknologikataloger/teknologikatalog-fornybare.
- Reksten A. H.; Thomassen M. S.; Møller-Holst S.; Sundseth K. Projecting the future cost of PEM and alkaline water electrolysers; a CAPEX model including electrolyser plant size and technology development. Int. J. Hydrogen Energy 2022, 47 (90), 38106–38113. 10.1016/j.ijhydene.2022.08.306. [DOI] [Google Scholar]
- van der Roest E.; Bol R.; Fens T.; van Wijk A. Utilisation of waste heat from PEM electrolysers—Unlocking local optimization. Int. J. Hydrogen Energy 2023, 48, 27872–27891. 10.1016/j.ijhydene.2023.03.374. [DOI] [Google Scholar]
- Ramboll . CO2 Fangst på danske affaldsenergianlæg. 2020. https://danskaffaldsforening.dk/udgivelser/co2-fangst-fra-danske-affaldsenergianlaeg#:~:text=Rambøllvurderer%2Catprisenfor.
- Eurostat . Hourly labour costs. 2019. https://ec.europa.eu/eurostat/statistics-explained/index.php/Hourly_labour_costs (accessed Feb 13, 2021).
- Seider W. D.; Seader J. D.; Lewin D. R.. Product and Process Design Principles: Synthesis, Analysis, and Evaluation, 2nd ed.; Wiley, 2004. [Google Scholar]
- Bang C.; Vitina A.; Sterling J.; Henrik Lindboe H.. Analysis of Biomass Prices—Future Danish Prices for Straw, Wood Chips and Wood Pellets “Final Report”. 2013. https://www.ea-energianalyse.dk/en/cases/1651-updated-biomass-prices/.
- Wang J.; Gao J.; Brandt K. L.; Wolcott M. P. Energy consumption of two-stage fine grinding of Douglas-fir wood. J. Wood Sci. 2018, 64 (4), 338–346. 10.1007/s10086-018-1712-1. [DOI] [Google Scholar]
- ENTSO-e . European power price tracker; Ember. 2023. https://ember-climate.org/data/data-tools/europe-power-prices/ (accessed Mar 31, 2023).
- Statistics Denmark . ENERGI4: Prices of natural gas for non-households by annual consumption, price definition and energy unit. 2023. https://www.statbank.dk/statbank5a/SelectVarVal/Define.asp?Maintable=ENERGI4&PLanguage=1 (accessed Apr 14, 2023).
- DANVA . Water in figures 2017—DANVA Statistics & Benchmarking. 2017; p 52. www.danva.dk/waterinfigures2017 (accessed Feb 18, 2021).
- Mortensen A. W.; Wenzel H.; Rasmussen K. D.; Justesen S. S.; Wormslev E.; Porsgaard M.. Nordic GTL—a pre-feasibility study on sustainable aviation fuel from biogas, hydrogen and CO2. 2019; p 70. https://www.nordicenergy.org/article/on-step-closer-to-sustainable-aviation-fuels/.
- Pérez-Fortes M.; Schöneberger J. C.; Boulamanti A.; Tzimas E. Methanol synthesis using captured CO2 as raw material: Techno-economic and environmental assessment. Appl. Energy 2016, 161, 718–732. 10.1016/j.apenergy.2015.07.067. [DOI] [Google Scholar]
- Hannula I. Hydrogen enhancement potential of synthetic biofuels manufacture in the European context: A techno-economic assessment. Energy 2016, 104, 199–212. 10.1016/j.energy.2016.03.119. [DOI] [Google Scholar]
- Poluzzi A.; Guandalini G.; Guffanti S.; Martinelli M.; Moioli S.; Huttenhuis P.; Rexwinkel G.; Palonen J.; Martelli E.; Groppi G.; et al. Flexible Power and Biomass-To-Methanol Plants With Different Gasification Technologies. Front. Energy Res. 2022, 9, 978. 10.3389/fenrg.2021.795673. [DOI] [Google Scholar]
- Krogh A.; Lozano E. M.; Thellufsen J. Z.; Grue J.; Pedersen T. H. Method for comparing efficiency and system integration potential for biomass-based fuels production pathways. J. Cleaner Prod. 2022, 376, 134336. 10.1016/j.jclepro.2022.134336. [DOI] [Google Scholar]
- Maersk . A. P. Moller—Maersk engages in strategic partnerships across the globe to scale green methanol production by 2025; Press Release. 2022. https://www.maersk.com/news/articles/2022/03/10/maersk-engages-in-strategic-partnerships-to-scale-green-methanol-production (accessed Sep 14, 2023).
- Ember; Energy Institute Statistical Review of World Energy . Carbon intensity of electricity (gCO2/kWh). 2023. https://ember-climate.org/data-catalogue/yearly-electricity-data/ (accessed Oct 20, 2023).
- James B.; Colella W.; Moton J.; Saur G.; Ramsden T.. PEM Electrolysis H2A Production Case Study Documentation. Golden, CO, United States. 2013. http://www.osti.gov/servlets/purl/1214980/.
Associated Data
This section collects any data citations, data availability statements, or supplementary materials included in this article.