

Abstract
Verbal probability expressions such as ‘likely’ and ‘possible’ are commonly used to communicate uncertainty in diagnosis, treatment effectiveness as well as the risk of adverse events. Probability terms that are interpreted consistently can be used to standardize risk communication. A systematic review was conducted. Research studies that evaluated numeric meanings of probability terms were reviewed. Terms with consistent numeric interpretation across studies were selected and were used to construct a Visual Risk Scale. Five probability terms showed reliable interpretation by laypersons and healthcare professionals in empirical studies. ‘Very Likely’ was interpreted as 90% chance (range 80 to 95%); ‘Likely/Probable,’ 70% (60 to 80%); ‘Possible,’ 40% (30 to 60%); ‘Unlikely,’ 20% (10 to 30%); and ‘Very Unlikely’ with 10% chance (5% to 15%). The corresponding frequency terms were: Very Frequently, Frequently, Often, Infrequently, and Rarely, respectively. Probability terms should be presented with their corresponding numeric ranges during discussions with patients. Numeric values should be presented as X-in-100 natural frequency statements, even for low values; and not as percentages, X-in-1000, X-in-Y, odds, fractions, 1-in-X, or as number needed to treat (NNT). A Visual Risk Scale was developed for use in clinical shared decision making.
Keywords: probability, clinical reasoning, risk communication, medical decision-making
Introduction
Risk is an inherent part of healthcare that requires communicating the probability of future events in the clinical context.1 For instance, osteoporosis is associated with a risk of fragility fractures which can be reduced using different treatment options.2 Verbal expressions of probability such as ‘probably’ and ‘likely’ are commonly used to communicate uncertainty in diagnosis, treatment effectiveness as well as the risk of adverse events with medications and surgical procedures. Patient surveys indicate a high demand for information on the risk of clinical outcomes.3 Hence, it is critical that physicians and other health professionals communicate risks clearly and unambiguously as discordant interpretations can lead to misunderstanding, undesired decisions and unwanted outcomes. While visual formats such as pictograms have been advocated for communicating probabilities,4 verbal expressions are still used predominantly.3 Plain language words are a natural choice in risk communication.
Previous research has elucidated certain recurring themes in the field of risk communication.5–7 Probability terms are imprecise or vague by nature, yet people receiving information translate these into numeric values in order to make decisions.8 There is a general preference for communicating risk to others using (imprecise) verbal terms while receiving risk information in (precise) numeric format.8 The meanings of these terms are inherently vague and imprecise. Empirical studies with laypersons and health professionals have attempted measure the numeric interpretation of verbal terms. Verbal probability terms may be defined as words that communicate the numeric chance of an event. The aim of this review was to develop a standardized set of probability terms. An additional goal was to provide an overview of recommendations for risk communication in clinical medicine.
Methods
A systematic review was conducted. Inclusion criteria included original research articles (with empirical data) that studied the interpretation of probability terms by laypersons and health professionals. Review articles and studies that evaluated visual formats such as graphs and pictograms were excluded. PRISMA guidelines (http://prisma-statement.org/) were followed. PubMed MEDLINE, PubMed Central, ProQuest PsyArticles, Academic Search Complete, Cochrane Library, ClinicalKey Elsevier, Google Scholar, Education Resources Information Center (ERIC), Nature, and Web of Science were searched (Supplementary File). Search keywords included “probability terms” as well as “communicat* risk” (separately) using the Best Match (Relevance) sort order.
Terms commonly used in clinical settings for risk communication were identified from research studies that evaluated these terms. Numeric probabilities were collated from results of studies conducted with patients and health professionals. Terms with consistent interpretation across studies were selected based on their numeric ranges reported in empirical studies. Consistency was defined as numeric ranges that overlapped across studies. Verbal terms that showed a wide variation in interpretation across studies were excluded. A formal meta-analysis with weights based on sample sizes was not feasible due to heterogeneity of study designs. A visual scale was constructed by combining selected terms and their respective numeric ranges on a linear axis.
Results
The search yielded 647 studies of which 6 met the inclusion criteria for full-text review (Table 1). Study designs were heterogenous: from psychology experiments to large scale online surveys. Methodological quality and rigor were generally low (lack of blinding, control groups, randomization or retest validation). There were no randomized trials; hence, weighted meta-analysis, risk of bias, and grading recommendations to assess the quality of evidence could not be conducted. Both patients and health professionals have been surveyed to assign numeric estimates to verbal probability terms.
Table 1. Studies evaluating the interpretation of verbal probability terms.
| Study | Year | Country | Participants | Study design |
|---|---|---|---|---|
| Reagan et al. | 1989 | US | 115 undergraduate students | Survey: assign numeric estimates to verbal terms, and vice versa |
| Shaw & Dear | 1990 | UK | 100 mothers; 50 doctors and medical students | Survey: assign numeric estimates to verbal statements with probability terms |
| Mosteller & Youtz | 1990 | US | 238 science writers | Mailed questionnaire survey: assign numeric probabilities to 52 probability expressions |
| Ness | 1995 | US | 194 college students | Survey with 3 methods: Percentage Estimation, Successive Interval Transformed, and Rank Order |
| Fillenbaum et al. | 1991 | US | 23 graduate students | Psychology experiment: comprehension and selection tasks |
| Wintle et al. | 2019 | US | 924 participants | Online survey: numerical judgements from participants for each of the 7 verbal probability expressions |
Patients vary in the numeric values they assign to terms; however, the relative meanings of these terms show stable groupings.9,10 For example, based on results of 13 patient surveys, numeric probabilities for the word probable showed clustering around 70%, with most estimates between 60 and 90%.11 Similar groupings emerged for other commonly used probability terms such as possible and likely based on published studies.12 On the other hand, a wide variation in interpretation occurred with the use of risk as a verbal probability expression.13 Expressions incorporating the term risk (as in low risk, standard risk, high risk) were problematic as laypersons tended to confuse frequency with the severity of a potential adverse event.13 Phrases such as negligible risk were interpreted anomalous to their meaning.13 Expressions with large modal peaks were the following: even chance, always, never, impossible, and certain.14 Terms with wide interquartile ranges included liable to happen, sometimes, not infrequent, not unreasonable, might happen and possible.14
There was a preference among patients for using words over numeric estimates.15 The use of verbal terms led to decisions more congruent with personal aims than numeric presentation of probabilities.16 Furthermore, there was no association between numeric estimates of terms and respondents’ age, educational level or health literacy.17
Health professionals’ interpretation of verbal probability terms has also been studied using hypothetical clinical cases and assignment of numeric values to each term.18 Results showed agreement in the interpretation of the probability terms. There was no effect of clinical context or physician specialty on the interpretation of verbal terms.18 The term likely was interpreted synonymously with probable.19,20 Residents interpreted verbal probability terms in a manner similar to experienced physicians.18 There was no effect of contextual framing on numeric interpretation between experienced physicians and residents.18
Selected terms showing consistent interpretation across studies were compiled with their numeric estimates (Table 2). The numeric evidence suggested that study participants ascribed these terms into discrete identifiable ranges. Based on these findings, five terms with reliable numeric interpretation were selected (Table 3). Frequency terms corresponding to the respective probability terms were also collated . For example, Often is interpreted as 35 – 83%; this corresponds to the probability range for Possible.17 A Visual Risk Scale was constructed using these probability terms (Figure 1).
Table 2. Numeric estimates of verbal probability terms from empirical studies.
| Term | Study | Lower estimate | Central estimate | Upper estimate |
|---|---|---|---|---|
| Very Likely | Reagan pre-1989 | 87 | ||
| Reagan 1989 | 80 | 85 | 90 | |
| Shaw 1990, mothers | 71 | 86 | 100 | |
| Shaw 1990, doctors | 86 | 91 | 96 | |
| Mosteller pre-1990 | 82 | |||
| Mosteller 1990 | 80 | 88 | 90 | |
| Ness 1995 | 75 | 87 | 99 | |
| Wintle 2019 | 77 | 85 | 92 | |
| Mean | 78 | 87 | 95 | |
| Likely | Reagan pre-1989 | 70 | ||
| Reagan 1989 | 65 | 70 | 80 | |
| Shaw 1990, mothers | 49 | 66 | 83 | |
| Shaw 1990, doctors | 64 | 77 | 90 | |
| Mosteller pre-1990 | 69 | |||
| Mosteller 1990 | 63 | 71 | 78 | |
| Fillenbaum 1991 | 72 | |||
| Ness 1995 | 56 | 71 | 87 | |
| Wintle 2019 | 57 | 67 | 77 | |
| Mean | 59 | 71 | 82 | |
| Possible | Reagan pre-1989 | 40 | ||
| Reagan 1989 | 30 | 40 | 58 | |
| Shaw 1990, mothers | 45 | 62 | 79 | |
| Shaw 1990, doctors | 27 | 46 | 65 | |
| Mosteller pre-1990 | 42 | |||
| Fillenbaum 1991 | 43 | |||
| Mean | 34 | 45 | 67 | |
| Unlikely | Reagan pre-1989 | 17 | ||
| Reagan 1989 | 10 | 15 | 20 | |
| Shaw 1990, mothers | 9 | 27 | 45 | |
| Shaw 1990, doctors | 6 | 16 | 26 | |
| Mosteller pre-1990 | 17 | |||
| Mosteller 1990 | 10 | 17 | 23 | |
| Fillenbaum 1991 | 23 | |||
| Ness 1995 | 15 | 27 | 39 | |
| Wintle 2019 | 17 | 30 | 42 | |
| Mean | 11 | 20 | 32 | |
| Very unlikely | Reagan pre-1989 | 10 | ||
| Reagan 1989 | 10 | 10 | 20 | |
| Mosteller pre-1990 | 11 | |||
| Mosteller 1990 | 3 | 5 | 10 | |
| Ness 1995 | 6 | 15 | 24 | |
| Wintle 2019 | 9 | 14 | 18 | |
| Mean | 7 | 11 | 18 |
Table 3. Standardized terms for expressing probabilities.
| Probability term* | Frequency term | Probability (per 100 cases) | Range (per 100 cases) | Width of range (precision) |
|---|---|---|---|---|
| Very likely | Very frequently | 90 | 80 – 95 | Narrow (precise) |
| Likely / Probable | Frequently | 70 | 60 – 80 | Moderate |
| Possible | Often | 40 | 30 – 60 | Wide (imprecise) |
| Unlikely | Infrequently | 20 | 10 – 30 | Moderate |
| Very unlikely | Rarely | 10 | 5 – 15 | Narrow (precise) |
Probable can be used interchangeably with Likely. The prefix Very can be changed to Highly. Absolute referents such as never, impossible, certain and always should be avoided. Terms such as high/moderate/low risk, negligible, uncertain, less/ more/equally/not likely, even chance, not often and fifty-fifty should not be used.
Figure 1. Visual Risk Scale.
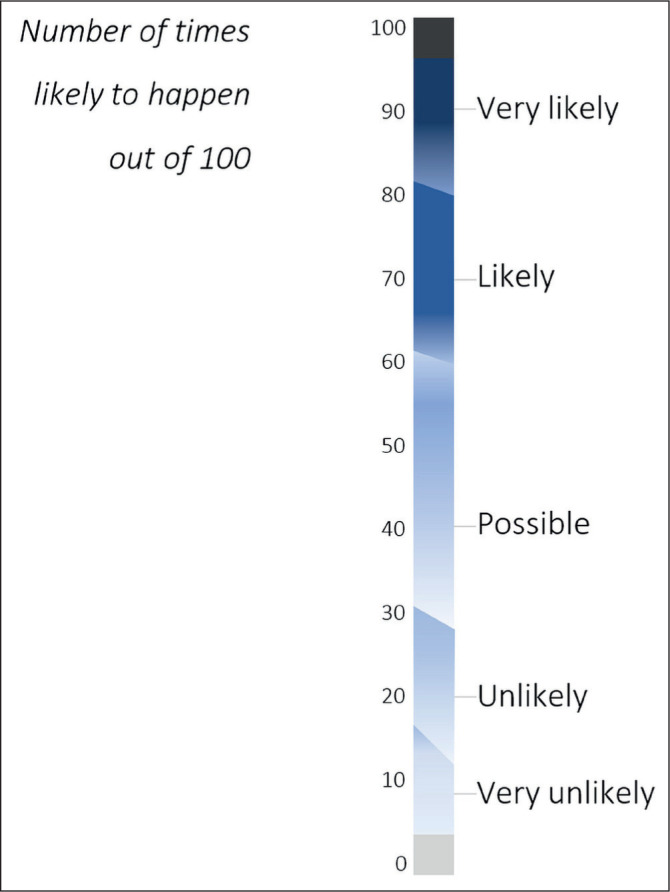
*All ranges are fuzzy estimates and should be interpreted as approximate with tapering and overlapping ends.
Discussion
Empirical studies involving patients and health professionals indicate that there is agreement in the interpretation of certain terms indicating a potential for standardization. The solution proposed in this article is to select five terms which are interpreted consistently for communicating risk.
Verbal expressions of probability are preferred in risk communication by physicians and patients.21,22 Most experts agree that the use of verbal terms will continue in clinical settings despite variations in interpretation.17 Instead of recommending against the use of these terms, a pragmatic solution is to standardize the meanings based on empirical findings. Indeed, Reagan et al, in their now classic paper on quantitative meanings of verbal probability expressions, found that “results agreed highly with others and were highly consistent across methods”.19 An elegant and eloquent rejoinder has been written in response to objections against using words to express probability, such as contextual factors and variability.23
Physicians and patients generally agree on relative ranges of the selected terms. For example, in one study of about 200 subjects, the concordance rates was .975 to .998, with identical ranking of terms in an ordinal sequence.24 Thus, most terms show an ordered sequence with nominally overlapping ranges. The ordinal ranking of these terms was reliable across studies. For instance, the term probable was interpreted to mean a greater mean chance than possible. Terms that were distinct (in their numeric ranges) were selected. There was flexibility as certain terms such as very unlikely and highly unlikely were equivalent.24 Numeric ranges proposed for these terms are based on empirical findings, as opposed to arbitrary standards by certain organizations.25 Verbal expressions with ambiguous interpretation such as negligible, uncertain and fifty-fifty were excluded. With the use of standardized meanings of selected terms in the proposed Visual Risk Scale, more widespread concordance may eventually be achieved.
The Visual Risk Scale presented in this study combines high-fidelity standardized probability terms with their empiric numeric ranges. An earlier risk scale was evaluated in a study of Dutch family physicians.26 However, the scale used in the study contained terms such as fifty-fifty, uncertain, certain, improbable and impossible which are known to have wide variations in interpretation. The study found that more experienced physicians preferred a scale with verbal terms while their younger colleagues were more comfortable with a numeric scale. A large study of almost one thousand participants found that presenting a scale as opposed to a single term reduced variability in interpretation.27 Thus, the Visual Risk Scale is a combination of words and numbers, as recommended for risk communication.28,29
Since absolute certainty is difficult to achieve and rarely encountered, terms such as never, certain, always and impossible should be avoided in clinical conversations. Other alternatives such as almost certain and almost never are ambiguous and should be substituted by Very Likely and Very Unlikely, respectively. Other terms to avoid include confirmed, ruled out and ruled in, except when indicated by a gold standard test such as tissue biopsy. The phrase fifty-fifty chance, should not be used in discussions with patients as it is interpreted as “uncertainty” rather than a numeric probability of 50%.30 Comparative terms such as more and less likely as well as negations like not often are also inadvisable.17 A standardized terminology can reduce incongruent use of verbal probability terms. For example, the term common has been used inappropriately to denote a 1 in 100 chance in a patient information guide.31 Such an arbitrary assignment of numeric values to specific verbal terms may lead to continued ambiguity and miscommunication.
While verbal terms are convenient, numeric estimates should be provided whenever possible. This practice will reinforce the meanings of verbal expressions and is useful for patients with higher numeracy skills. Point estimates using whole numbers are easier to understand than ranges of values.32 We propose that numeric estimates should be expressed as a natural frequency statement with a fixed denominator of 100 (for example, 20 out of 100 patients): the X-in-100 format. Chance of a single event is easier to interpret as a natural frequency statement instead of a probability.33 Hence, the term percentage (or percent) is not recommended.34 Varying denominators such as 1,000 and 100,000 are also not advisable.35 For consistency, a denominator of 100 should be used for extreme values as well, such as “less than 1 in 100”, instead of denominators such as 1,000,000.35
Other formats of expressing numeric values are not advisable, such as decimal fractions (for example, 0.25), percentages (25%), simple fractions (1/4), simplified fraction expressions (3 out of 7), frequencies with unusual denominators (23 in 500) or odds (one in three).34 Number needed to treat (NNT) and the 1-in-X format (for example, 1 out of 30 patients) should be avoided as they distort risk perception by patients.35,36 Stating the absolute risk of outcomes (probability terms) is preferred over relative risk reduction (X% reduction in risk). Since a large proportion of the lay public have limited numeracy skills,35 numeric estimates can be misinterpreted and should be accompanied by commonly understood verbal terms, as shown in the Visual Risk Scale.
Limitations of this review include variations in contexts and study participants, limited number of studies and heterogenous study designs. The methodological rigor and quality of studies was inconsistent. In particular, online surveys may produce unreliable data. Bias assessment and data synthesis were not conducted due to variations in study designs and outcome measures. The review may have missed studies that have not been indexed in research databases such as doctoral theses and conference abstracts. Many of the studies were conducted over two decades ago and the usage of these verbal terms may have changed.
Conclusions
The main contribution of this article is to identify five probability terms and codify their numeric meanings. This assignment of numeric estimates is based on empirical studies involving health professionals and laypersons. The resulting Visual Risk Scale follows the recommendation to integrate numeric estimates with verbal probability terms. Presentation of risk in a standardized format may improve comprehension over the long term. When discussing clinical risk with patients, clinicians can express the chances of different outcomes using these five terms. These probability terms should be used preferentially in professional communications such as case presentations, medical documentation and clinical teaching as well as in discussions with patients for informed consent. These terms may be useful in communicating and teaching evidence-based medicine, healthcare risk and safety, shared decision-making and clinical reasoning.
Footnotes
UMJ is an open access publication of the Ulster Medical Society (http://www.ums.ac.uk).
REFERENCES
- 1.Leonard C, Toner J. The physician’s duty to warn their patients about the risks associated with medical intervention: a review and discussion. Ulster Med J. 2019;88(1):1–3. [PMC free article] [PubMed] [Google Scholar]
- 2.Gregson CL, Armstrong DJ, Bowden J, Cooper C, Edwards J, Gittoes NJ, et al. UK clinical guideline for the prevention and treatment of osteoporosis. Arch Osteoporos. 2022;17(1):58. doi: 10.1007/s11657-022-01061-5. [DOI] [PMC free article] [PubMed] [Google Scholar]
- 3.Goodyear-Smith F, Kenealy T, Wells S, Arroll B, Horsburgh M. Patients’ preferences for ways to communicate benefits of cardiovascular medication. Ann Fam Med. 2011;9(2):121–7. doi: 10.1370/afm.1193. [DOI] [PMC free article] [PubMed] [Google Scholar]
- 4.Anderson H, Moore JE, Millar BC. Comparison of innovative communication approaches in nutrition to promote and improve health literacy. Ulster Med J. 2022;91(2):85–91. [PMC free article] [PubMed] [Google Scholar]
- 5.Fischhoff B, Brewer NT, Downs JS. Communicating risks and benefits: an evidence-based user’s guide. Silver Spring, Maryland: US Food and Drug Administration; 2011. [Google Scholar]
- 6.Bell NR, Dickinson JA, Grad R, Singh H, Kasperavicius D, Thombs BD. Understanding and communicating risk: Measures of outcome and the magnitude of benefits and harms. Can Fam Physician. 2018;64(3):181–5. [PMC free article] [PubMed] [Google Scholar]
- 7.Trevena LJ, Zikmund-Fisher BJ, Edwards A, Gaissmaier W, Galesic M, Han PKJ, et al. Presenting quantitative information about decision outcomes: a risk communication primer for patient decision aid developers. BMC Med Inform Decis Mak. 2013;13(Suppl 2):S7. doi: 10.1186/1472-6947-13-S2-S7. [DOI] [PMC free article] [PubMed] [Google Scholar]
- 8.Karelitz TM, Budescu DV. You say ‘probable’ and i say ‘likely’: improving interpersonal communication with verbal probability phrases. J Exp Psychol Appl. 2004;10(1):25–41. doi: 10.1037/1076-898X.10.1.25. [DOI] [PubMed] [Google Scholar]
- 9.Wallsten TS, Budescu DV, Rapoport A, Zwick R, Forsyth B. Measuring the vague meanings of probability terms. J Exp Psychol Gen. 1986;115(4):348–65. [Google Scholar]
- 10.Woloshin KK, Ruffin MT, Gorenflo DW. Patients’ interpretation of qualitative probability statements. Arch Fam Med. 1994;3(11):961–6. doi: 10.1001/archfami.3.11.961. [DOI] [PubMed] [Google Scholar]
- 11.Hanauer DA, Liu Y, Mei Q, Manion FJ, Balis UJ, Zheng K. Hedging their Mets: the use of uncertainty terms in clinical documents and its potential implications when sharing the documents with patients. AMIA Annu Symp Proc. 2012;2012:321–30. [PMC free article] [PubMed] [Google Scholar]
- 12.Foppa M, de Araujo BS, Macari A, Reichert R, Goldim JR. Limitations in the use of qualitative terms to inform diagnoses. Arch Intern Med. 2011;171(14):1291–2. doi: 10.1001/archinternmed.2011.307. [DOI] [PubMed] [Google Scholar]
- 13.Wiles MD, Duffy A, Neill K. The numerical translation of verbal probability expressions by patients and clinicians in the context of peri-operative risk communication. Anaesthesia. 2020;75(Suppl 1):e39–45. doi: 10.1111/anae.14871. [DOI] [PubMed] [Google Scholar]
- 14.Mosteller F, Youtz C. Quantifying Probabilistic Expressions. Stat Sci. 1990;5(1):2–12. [Google Scholar]
- 15.Ohnishi M, Fukui T, Matsui K, Hira K, Shinozuka M, Ezaki H, et al. Interpretation of and preference for probability expressions among Japanese patients and physicians. Fam Pract. 2002;19(1):7–11. doi: 10.1093/fampra/19.1.7. [DOI] [PubMed] [Google Scholar]
- 16.González-Vallejo CC, Erev I, Wallsten TS. Do decision quality and preference order depend on whether probabilities are verbal or numerical? Am J Psychol. 1994;107(2):157–72. doi: 10.2307/1423035. [DOI] [Google Scholar]
- 17.Kunneman M, Stiggelbout AM, Pieterse AH. Do clinicians convey what they intend? Lay interpretation of verbal risk labels used in decision encounters. Patient Educ Couns. 2020;103(2):418–22. doi: 10.1016/j.pec.2019.08.035. [DOI] [PubMed] [Google Scholar]
- 18.Timmermans D. The roles of experience and domain of expertise in using numerical and verbal probability terms in medical decisions. Med Decis Making. 1994;14(2):146–56. doi: 10.1177/0272989X9401400207. [DOI] [PubMed] [Google Scholar]
- 19.Reagan RT, Mosteller F, Youtz C. Quantitative meanings of verbal probability expressions. J Appl Psychol. 1989;74(3):433–42. doi: 10.1037/0021-9010.74.3.433. [DOI] [PubMed] [Google Scholar]
- 20.Fillenbaum S, Wallsten TS, Cohen BL, Cox JA. Some effects of vocabulary and communication task on the understanding and use of vague probability expressions. Am J Psychol. 1991;104(1):35–60. [Google Scholar]
- 21.Kong A, Barnett GO, Mosteller F, Youtz C. How medical professionals evaluate expressions of probability. N Engl J Med. 1986;315(12):740–4. doi: 10.1056/NEJM198609183151206. [DOI] [PubMed] [Google Scholar]
- 22.Zipkin DA, Umscheid CA, Keating NL, Allen E, Aung K, Beyth R, et al. Evidence-based risk communication: a systematic review. Ann Intern Med. 2014;161(4):270–80. doi: 10.7326/M14-0295. [DOI] [PubMed] [Google Scholar]
- 23.Mosteller F, Youtz C. [Quantifying Probabilistic Expressions]: Comment Codifiying chance. Stat Sci. 1990;5(1):2–4. [Google Scholar]
- 24.Ness ME. Ordinal positions and scale values of probability terms as estimated by three methods. Meas Eval Couns Dev. 1995;28(3):152–61. [Google Scholar]
- 25.Knapp P, Raynor DK, Berry DC. Comparison of two methods of presenting risk information to patients about the side effects of medicines. Qual Saf Health Care. 2004;13(3):176–80. doi: 10.1136/qshc.2003.009076. [DOI] [PMC free article] [PubMed] [Google Scholar]
- 26.Witteman CL, Renooij S, Koele P. Medicine in words and numbers: a cross-sectional survey comparing probability assessment scales. BMC Med Inform Decis Mak. 2007;7:13. doi: 10.1186/1472-6947-7-13. [DOI] [PMC free article] [PubMed] [Google Scholar]
- 27.Clarke V, Ruffin C, Hill D, Beamen A. Ratings of Orally Presented Verbal Expressions of Probability by a Heterogeneous Sample. J Appl Soc Psychol. 1992;22(8):638–56. [Google Scholar]
- 28.Hashim MJ. Patient-centered communication: basic skills. Am Fam Physician. 2017;95(1):29–34. [PubMed] [Google Scholar]
- 29.Witteman CL, Renooij S, Koele P. Medicine in words and numbers: a cross-sectional survey comparing probability assessment scales. BMC Med Inform Decis Mak. 2007;7:13. doi: 10.1186/1472-6947-7-13. [DOI] [PMC free article] [PubMed] [Google Scholar]
- 30.Bruine de Bruin W, Fischbeck PS, Stiber NA, Fischhoff B. What number is ‘fifty-fifty’?: redistributing excessive 50% responses in elicited probabilities. Risk Anal. 2002;22(4):713–23. doi: 10.1111/0272-4332.00063. [DOI] [PubMed] [Google Scholar]
- 31.The Royal College of Anaesthetists. Patient information resources: Anaesthesia and Risk - Risk explained [Internet] London: The Royal College of Anaesthetists; 2020. [[cited 2020 Apr 29]]. Available from: https://www.rcoa.ac.uk/patient-information/patient-information-resources/anaesthesia-risk/risk-explained. [Google Scholar]
- 32.Longman T, Turner RM, King M, McCaffery KJ. The effects of communicating uncertainty in quantitative health risk estimates. Patient Educ Couns. 2012;89(2):252–9. doi: 10.1016/j.pec.2012.07.010. [DOI] [PubMed] [Google Scholar]
- 33.Garcia-Retamero R, Galesic M. Using plausible group sizes to communicate information about medical risks. Patient Educ Couns. 2011;84(2):245–50. doi: 10.1016/j.pec.2010.07.027. [DOI] [PubMed] [Google Scholar]
- 34.Akl EA, Oxman AD, Herrin J, Vist GE, Terrenato I, Sperati F, et al. Using alternative statistical formats for presenting risks and risk reductions. Cochrane Database Syst Rev. 2011;(3):CD006776. doi: 10.1002/14651858.CD006776.pub2. [DOI] [PMC free article] [PubMed] [Google Scholar]
- 35.Woloshin S, Schwartz LM. Communicating data about the benefits and harms of treatment: a randomized trial. Ann Intern Med. 2011;155(2):87–96. doi: 10.7326/0003-4819-155-2-201107190-00004. [DOI] [PubMed] [Google Scholar]
- 36.Zikmund-Fisher BJ. Continued Use of 1-in-X risk communications is a systemic problem. Med decis making. 2014;34(4):412–3. doi: 10.1177/0272989X13516198. [DOI] [PubMed] [Google Scholar]