

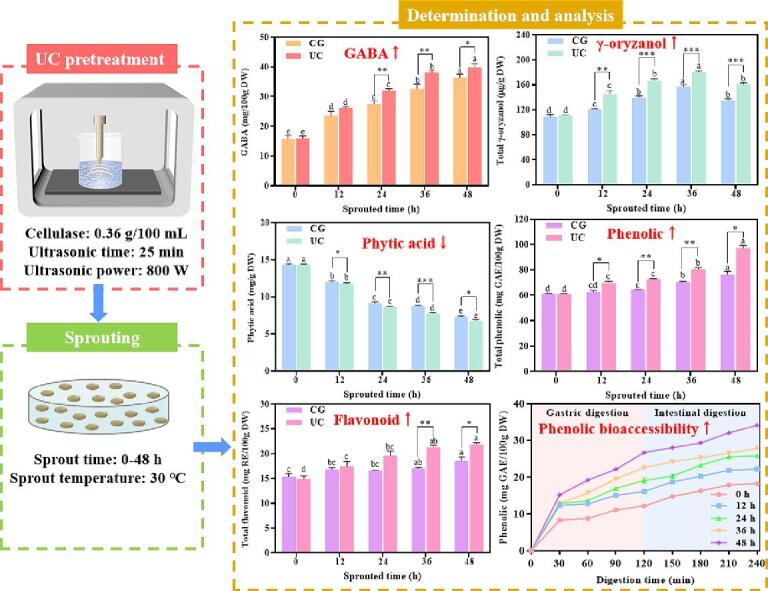
Graphical abstract
Keywords: Ultrasound-assisted cellulase, Sprouted brown rice, Nutrient composition, Phytic acid, Phenolic bioaccessibility
Highlights
-
•
UC pretreatment decreased phytic acid content in SBR.
-
•
UC pretreatment increased the content of GABA and γ-oryzanol in SBR.
-
•
UC pretreatment enhanced the content of phenolics and flavonoid in SBR.
-
•
UC pretreatment improved the antioxidant activity in SBR.
-
•
UC pretreatment increased the phenolic bioaccessibility of SBR.
Abstract
This study aimed to elucidate the impact of ultrasound-assisted cellulase (UC) pretreatment on nutrients, phytic acid, and the bioavailability of phenolics during brown rice sprouting. It sought to unveil the underlying mechanisms by quantifying the activity of key enzymes implicated in these processes. The sprouted brown rice (SBR) surface structure was harmed by the UC pretreatment, which also increased the amount of γ-oryzanol and antioxidant activity in the SBR. Concurrently, the UC pretreatment boosted the activity of phytase, glutamate decarboxylase, succinate semialdehyde dehydrogenase, Gamma-aminobutyric acid (GABA) transaminase, chalcone isomerase, and phenylalanine ammonia lyase, thereby decreasing the phytic acid content and increasing the GABA, flavonoid, and phenolic content in SBR. In addition, UC-pretreated SBR showed increased phenolic release and bioaccessibility during in vitro digestion when compared to the treated group. These findings might offer theoretical direction for using SBR to maximize value.
1. Introduction
Sprouted brown rice (SBR) has gained global popularity as a nutritious whole grain [1]. SBR is abundant in numerous active compounds and is seen as having significant potential in combating chronic conditions such as diabetes, obesity, and hyperlipidemia [2], [3]. Consequently, there has been a recent shift in focus towards enhancing the nutritional content of SBR and realizing its value-added utilization through the use of sprouting pretreatment technology [4].
Generally, the pretreatment technology for sprouting is the process of treating grains through physical, chemical, or biological methods before sprouting in order to enhance the nutritional quality and sensory attributes of sprouted grains [5]. Traditional pretreatment methods for sprouting mainly involve soaking, low-temperature or low-oxygen stress, NaCl stress, and the like. However, these techniques have drawbacks including long processing times and limited effectiveness [6]. In recent years, non-thermal processing techniques such as pulsed electric fields, low-temperature plasma, and high static pressure have been utilized for the pretreatment of sprouted grains [7]. These non-thermal techniques have shown some improvement in the sensory properties and nutritional levels of sprouted grains, though they are also associated with high energy consumption, low efficiency, limited universality, and high costs [8]. Therefore, improving the sensory and nutritional quality of sprouted grains through suitable sprouting pretreatment technology remains a substantial challenge.
Ultrasound-assisted cellulase (UC) technology is widely used in food processing and other fields because of its safety, environmental protection, high efficiency and low cost [9]. UC technology combines the high catalytic capacity of the enzyme and the characteristics of ultrasonic promoting material transfer, and realizes a more efficient enzymolysis reaction by enhancing the contact between the substrate and the enzyme and the catalytic efficiency [10]. At present, in the field of food, UC technology mainly plays an irreplaceable role in the extraction, separation and purification of active substances, homogenization and so on [11]. Compared with the traditional pretreatment methods, such as soaking, stress, etc., UC pretreatment technology has the advantages of short treatment time and high efficiency [12]. Distinguished from non-thermal pretreatment techniques, including cold plasma and millimeter wave, UC pretreatment stands out for its low energy consumption, safety, environmental sustainability, and broad applicability [7]. Yet, the application of UC technology in the pretreatment of sprouted grains remains notably underexplored. Furthermore, there is a pronounced gap in the research regarding the impact of UC pretreatment on the activity of key enzymes and the profile of metabolites during the sprouting process of brown rice. Addressing this gap by investigating the effects of UC technology on sprouted grains is imperative, presenting a significant opportunity to advance our understanding of its potential benefits and mechanisms.
Brown rice was pretreated in this instance using the UC technique. Subsequently, an analysis was conducted to determine how UC pretreatment technology affected the microstructure, anti-nutrient factors, nutrient composition, and phenolic bioaccessibility of SBR. By monitoring the activity of the corresponding key enzyme during sprouting, the dynamic mechanism of UC pretreatment to reduce phytic acid content and increase nutrient content was discovered. Some important information regarding the value-added application of SBR can be obtained from this study.
2. Materials and methods
2.1. Materials
The Changlixiang brown rice was provided by Northeast Agricultural University, China. The ultrasonic equipment (BILON-1000CT, 20KHz) was provided by Shanghai bilang instrument manufacturing Co., LTD, China. The cellulase (700 U/g) was obtained from Furuidemu Biotechnology Co., LTD, China. The sodium bicarbonate and phosphate buffer were obtained from Beijing Solarbio Technology Co., LTD, China. The phytic acid, γ-oryzanol, Gamma-aminobutyric acid (GABA), phenolic acid and flavonoid standards were purchased from Shanghai Yuanye Biotechnology Co., LTD, China. The methanol, ethyl alcohol, acetonitrile and acetic acid used in the study were chromatographic grades and purchased from Shanghai Maclin Biochemical Technology Co., LTD, China.
2.2. Ultrasound-assisted cellulase pretreatment
Brown rice (5 g) was placed in a beaker and a phosphate buffer (pH = 4.5, 100 mL) was added. Then, cellulase was added to the beaker and fully solution. The ultrasonic probe was placed in a beaker, and UC pretreatment was initiated. In the preliminary test, we optimized the pretreatment conditions, and the GABA content in SBR was the highest when the pretreatment conditions were ultrasonic time of 25 min, ultrasonic power of 800 W, and cellulase concentration of 0.36 g/100 mL. Therefore, ultrasonic time of 25 min, ultrasonic power of 800 W and cellulase concentration of 0.36 g/100 mL were selected as the pretreatment conditions for SBR.
2.3. Sprouting process
Untreated brown rice and brown rice with UC pretreatment were soaked in 30 ℃ water for 12 h. The water absorption rates of untreated brown rice and UC pre-treated brown rice were 21.06 % and 27.89 % respectively. After soaking, untreated brown rice and UC pre-treated brown rice were placed in petri dishes for sprouting at 30 ℃ for 48 h. The sprouting rates of untreated brown rice and UC pre-treated brown rice were 90.08 % and 93.25 %. The SBR pretreated with UC pretreatment (UC-SBR) and the SBR in of control group (CG-SBR) were dried at 45 ℃, crushed through a 60-mesh sieve and refrigerated.
2.4. Microstructure morphology
The microstructure morphology of CG-SBR and UC-SBR was measured by scanning electron microscope (S-4800, HITACHI, Japan).
2.5. GABA and its key enzyme
A previously reported method was applied in measurement of GABA in CG-SBR and UC-SBR [13]. Briefly, CG-SBR or UC-SBR was mixed with ethanol and extracted ultrasonic for 30 min. The extract was mixed with sodium bicarbonate and 4-dimethylamine azobenzene 4-sulfonyl chloride and bathed in water (70 ℃) for 20 min to obtain the derivative solution. The derivative solution were detected by HPLC, and the detection parameters were listed in Table 1S. The activity of succinate semialdehyde dehydrogenase (SSADH), GABA transaminase (GABA-T), and glutamate decarboxylase (GAD) was determined following by test kit (ELISA) obtained from Meimian industrial Co., Ltd, Jiangsu China.
2.6. Phytic acid and phytase
The phytic acid content in CG-SBR and UC-SBR was measured by a previously reported method [14]. Briefly, CG-SBR or UC-SBR was mixed with 0.3 mol/L hydrochloric acid solution for 2 h to obtain the extract. The extraction solution was mixed with 0.25 g/L ammonium ferric sulfate solution in boiling water for 0.5 h. Then, the mixture was mixed with 10 mg/mL bipyridine solution, then the absorbance of the solution was measured at 519 nm.
The sample (1 g) was added to the centrifuge tube, after which a phosphate buffer (10 mL) was added. The mixture was homogenized by a high speed homogenizer (3500 r/min, 5 min), and the supernatant was collected after centrifugation (4000 r/min, 10 min). The phytase activity in the supernatant was determined according to the kit method provided by Beijing Boxbio Science & Technology Co., Ltd, China.
2.7. γ-oryzanol
The γ-oryzanol content in CG-SBR and UC-SBR was obtained by a previously reported method [15]. The CG-SBR or UC-SBR was mixed with methanol at a ratio of 1:4 and ultrasounded for 40 min. The extraction solution was evaporated and concentrated to 6 mL and used for HPLC detection. The HPLC detection conditions of γ-oryzanol were listed in Table 2S.
2.8. Measurement of phenolic and its key enzyme
Phenolic and flavonoid were isolated from CG-SBR and UC-SBR following a previously reported method [16]. The CG-SBR or UC-SBR was completely mixed with methanol and subjected to ultrasonication for 1 h. The resultant mixture was then evaporated and concentrated to 10 mL in order to obtain the free phenolic extract. The remaining residue was treated with sodium hydroxide for 2 h, followed by the addition of ethyl acetate to extract the bound phenolic. The ethyl acetate mixture was subsequently evaporated and concentrated to 10 mL to yield the bound phenolic extract. The flavonoid and phenolic in CG-SBR and UC-SBR was measured using the previously published methods [13]. The activity of chalcone isomerase (CHI) and phenylalanine ammonia lyase (PAL) was determined following by test kit (ELISA) obtained from Meimian industrial Co., Ltd, Jiangsu China.
2.9. Detection of flavonoid and phenolic compositions
The flavonoid and phenolic compositions in CG-SBR and UC-SBR was detected by the HPLC method [17]. The concentrated solution of phenolic was transferred to HPLC for identification. The HPLC detection conditions of phenolic and flavonoid compositions were listed in Table 3S and Table 4S.
2.10. Antioxidant activity
The antioxidant activity (2,2-diphenyl-1-picrylhydrazyl, DPPH and Total antioxidant capacity, T-AOC) in CG-SBR and UC-SBR was measured using the previously published methods [14].
2.11. Phenolic bioaccessibility
The phenolic bioaccessibility in CG-SBR and UC-SBR was measured using the previously reported methods [18]. The CG-SBR or UC-SBR was mixed with an acid buffer (pH 1.5 HCl-KCl) at a ratio of 1:6 and pepsin (15000 U) was added to simulate gastric digestion. After 2 h of digestion, the pH of digestive juice was adjusted to 6.8, and trypsin (20000U) was added to simulate intestinal fluid digestion, and digestion continued for 2 h. The content of phenolic in digestive juice was measured every 30 min. The bioaccessibility of phenolics for CG-SBR and UC-SBR was calculated by the formula of P = (C1/C2) × 100 %. C1 is the phenolic content in digestive juice, C2 is the total phenolic content in CG-SBR and UC-SBR.
2.12. Statistical analysis
The triple average value and standard deviation of each sample were used as the final data result. The difference significance (P < 0.05) of the result was determinated by SPSS software (Chicago, USA).
2.13. Microstructure morphology
Fig. 1 shows the influence of UC pretreatment on microscopic surface texture of SBR. As can be seen from Fig. 1 A, brown rice has smooth surface and dense structure. Compared with untreated brown rice, the surface of brown rice became rough and etched after UC pretreatment (Fig. 1 F). With the extension of sprouting time, the surface of both CG-SBR (Fig. 1 B-E) and UC-SBR (Fig. 1 G-J) became rougher and cracks appeared. Compared with CG-SBR, UC-SBR has rougher surface and larger voids.
Fig. 1.

Microstructure of UC treated brown rice and untreated brown rice during sprouting. A-E: Microstructure of untreated brown rice at 0, 12, 24,36, 48 h during sprouting. F-J: Microstructure of UC treated brown rice at 0, 12, 24,36, 48 h during sprouting.
Brown rice will have its surface structure destroyed by the cavitation created by the ultrasonic wave, resulting in an etched surface [19]. Furthermore, the cellulose on the surface of brown rice is broken down by cellulase, giving the grain a rougher appearance [20]. Brown rice continues to absorb water during the sprouting process, growing larger and developing holes on the surface. Larger cracks on the surface of UC-SBR resulted from damage to the brown rice caused by UC pretreatment, which facilitated the rice's ability to absorb water and speed up growth [21]. According to findings from another study, ultrasonic pretreatment enhances the ability of oats to absorb water and initiate sprouting, a process that is advantageous for the increased synthesis of certain nutrients and bioactive compounds within the grain [22].
2.14. GABA, GAD, GABA-T and SSADH
Fig. 2 shows the influence of UC pretreatment on GABA and its key enzyme activities in SBR. The GABA content in UC-SBR and CG-SBR increased significantly during sprouting (Fig. 2A). The GABA content in CG-SBR and UC-SBR were 23.56–36.40 mg/100 g DW and 26.13–39.88 mg/100 g DW during sprouting. The GABA content in UC-SBR was higher than that in CG-SBR, and there was a significant difference (P < 0.05) from 24 h to 48 h. Additionally, with the increase of sprouting time, SSADH, GABA-T and GAD activity in UC-SBR and CG-SBR also increased significantly, and GAD, GABA-T and SSADH activities in UC-SBR were higher than that in CG-SBR (Fig. 2B-D).
Fig. 2.

The GABA content and key enzyme activity in SBR with and without UC pretreatment for different sprouting hours. A: GABA, B: Glutamate decarboxylase, C: GABA transaminase, D: Succinate semialdehyde dehydrogenase. UC: SBR with UC pretreatment, CG: Control group, SBR without UC pretreatment. p < 0.05 (*), p < 0.01 (**) and p < 0.001 (***) were considered statistically significant, highly significant, and extremely significant between UC and CG at the same sprouting time, respectively. Different letters at the top of the columns indicate significant differences (p < 0.05). DW: dry basis weight.
Previous study showed that the GABA content of brown rice treated with cellulase increased by 3.07 mg/100 g DW compared with that of untreated brown rice during sprouting [23]. In this study, compared with the CG-SBR (36 h), the content of GABA in UC-SBR increased by 25.48 mg/100 g DW during sprouting. Consequently, UC pretreatment is effective in enhancing GABA accumulation in SBR. The GAD, GABA-T and SSADH are regarded as be the key enzymes involved in GABA synthesis during plant sprouting [24]. According to the above results, the mechanism of UC pretreatment promoting GABA synthesis in SBR was proposed (Fig. 2E). Firstly, UC pretreatment destroyed the surface of brown rice, caused the water in the surrounding environment to be rapidly absorbed by brown rice, and promoted the sprouting of brown rice [25]. At the same time, UC pretreatment also activated the activity of GAD, which promoted the conversion of L-glutamate into GABA [26]. Then, as GABA accumulates, SSADH and GABA-T enzymes are activated and GABA is converted into succinic acid [27]. Finally, the succinic acid enters the tricarboxylic acid cycle and eventually produces L-glutamate, which is used in GABA synthesis.
2.15. Phytic acid, phytase and γ-oryzanol
Fig. 3 indicates the influence of UC pretreatment on phytic acid, phytase and γ-oryzanol in SBR. The phytic acid content in UC-SBR and CG-SBR decreased significantly during sprouting (Fig. 3A). The phytic acid content in CG-SBR and UC-SBR were 7.31–12.06 mg/g DW and 6.73–11.76 mg/g DW during sprouting. The phytic acid content in UC-SBR was lower than that in CG-SBR. During sprouting, the phytase activity of CG-SBR and UC-SBR increased first and then decreased, and the phytase activity of CG-SBR was lower than that in UC-SBR (Fig. 3B). Similarly, the content of total γ-oryzanol and its components in CG-SBR and UC-SBR also indicated a trend of first increasing and then decreasing during sprouting, and total γ-oryzanol and its components content in CG-SBR was lower than that in UC-SBR (Fig. 3C-G). Total γ-oryzanol contents in CG-SBR and UC-SBR were 120.77–156.61 µg/g DW and 145.32–180.32 µg/g DW during sprouting.
Fig. 3.

The phytic acid and γ-oryzanol content, and phytase activity in SBR with and without UC pretreatment for different sprouting hours. A: Phytic acid, B: Phytic acid, C-G: Cycloartenyl ferulate, 24-methylenecycloartanyl ferulate, Campesterylferulate, Sitosteryl ferulate, Total γ-oryzanol. UC: SBR with UC pretreatment, CG: Control group, SBR without UC pretreatment. p < 0.05 (*), p < 0.01 (**) and p < 0.001 (***) were considered statistically significant, highly significant, and extremely significant between UC and CG at the same sprouting time, respectively. Different letters at the top of the columns indicate significant differences (p < 0.05). DW: dry basis weight.
Phytic acid in grains easily binds to protein, dietary fiber and minerals, thereby reducing the absorption of these nutrients by people, so it is crucial to reduce the phytic acid content in grains [28].
Compared with the untreated group, phytic acid content in SBR (36 h) treated with cold plasma decreased by 0.42 mg/g DW [15]. In this study, compared with group CG-SBR, the phytic acid content in UC-SBR (36 h) was decreased by 1.01 mg/g DW. Therefore, UC pretreatment has a stronger ability to decrease phytic acid in SBR. Previous study showed that during grain sprouting, phytase was activated to reduce phytic acid content [29]. This is consistent with the findings of this study, which showed that UC pretreatment reduced the phytic acid contents in SBR by activating phytase activity. In addition, UC pretreatment damaged the surface structure of brown rice and promoted water absorption and sprouting of brown rice, which may be another reason for the increase of phytase activity [15]. Another study showed that the content of γ-oryzanol in grains increased during the initial sprouting period and subsequently decreased [30]. The increase of γ-oryzanol content in SBR induced by UC pretreatment may be related to the activation of lipase activity [14].
2.16. Phenolic and flavonoid
Fig. 4 shows the influence of UC pretreatment on phenolic, flavonoid and its key enzyme activities in SBR. The phenolic content and PAL activity in UC-SBR and CG-SBR increased significantly during sprouting (Figure A-D). The content of free phenolic (FPC), bound phenolic (BPC), and total phenolic (TPC) in CG-SBR were 34.14–43.25 mg GAE/100 g DW, 28.48–33.35 mg GAE/100 g DW, and 62.62–76.59 GAE/100 g DW during sprouting. The content of free flavonoid (FPC), bound flavonoid (BPC), and total flavonoid (TPC) in UC-SBR were 39.12–54.61 mg GAE/100 g DW, 30.77–42.68 mg GAE/100 g DW, and 69.89–97.29 GAE/100 g DW during sprouting. The PAL activity in CG-SBR and UC-SBR were 6.17–7.35 U/g DW and 6.07–8.45 U/g DW during sprouting. Similarly, the flavonoid content and CHI activity in UC-SBR and CG-SBR also increased significantly during sprouting (Figure E-H). The FFC, BFC, and TFC in CG-SBR were 9.90–10.85 mg RE/100 g DW, 6.91–7.69 mg RE/100 g DW, and 16.81–18.55 RE/100 g DW during sprouting. The FFC, BFC, and TFC in UC-SBR were 10.75–12.40 mg RE/100 g DW, 6.72–7.50 mg RE/100 g DW, and 17.47–21.89 RE/100 g DW during sprouting. The CHI activity in CG-SBR and UC-SBR were 1177.72–1340.73 U/L and 1254.96–1384.82 U/L during sprouting.
Fig. 4.

The phenolic and flavonoid content, and key enzyme activity in SBR with and without UC pretreatment for different sprouting hours. A-C: Free, bound, and total phenolic, D: Phenylalanine ammonia lyase, E-G: Free, bound, and total flavonoid, H: Chalcone isomerase. UC: SBR with UC pretreatment, CG: Control group, SBR without UC pretreatment. p < 0.05 (*), p < 0.01 (**) and p < 0.001 (***) were considered statistically significant, highly significant, and extremely significant between UC and CG at the same sprouting time, respectively. Different letters at the top of the columns indicate significant differences (p < 0.05). DW: dry basis weight.
Previous studies reported that anaerobic stress and millimeter wave pre-treated brown rice showed higher total phenolic content during sprouting compared to the untreated group, with an increase of 4.22 and 16.00 mg/100 g DW, respectively [31], [32]. The finding of this study showed that compared with CG-SBR (48 h), the total phenolic content in UC-SBR was increased by 20.70 mg/100 g DW. Thus, UC pretreatment more effectively enhances the accumulation of phenolic compounds in brown rice during the sprouting process. Phenolic acids and flavonoids, primarily located in the grain's bran layer, are often bound to components such as fiber, protein, and starch [33]. UC pretreatment exerts a significant degradative impact on surface cellulose of grains, thereby diminishing the interaction of phenolic acids and flavonoids with fiber, protein, and starch [34]. Consequently, during the sprouting of brown rice, the enhanced accessibility to these complexes for various hydrolases in UC-SBR facilitates the hydrolysis of fiber, protein, and starch. This process leads to a substantial release of phenolic acids and flavonoids [35]. Additionally, the rate of phenolic and flavonoid synthesis in grain during sprouting also is determined by the activity of PAL and CHI [14]. Previous study showed that sprouting caused PAL in grain to be activated, which increased phenolic content in sprouted grain [36]. The accumulation of flavonoids in sprouted buckwheat was regulated by CHI, and the higher the activity of CHI, the higher the flavonoid content in sprouted buckwheat [37]. Another study showed that ultrasonic treatment can damage the skin of oats, prompting the oats to absorb water quickly and sprout during sprouting, thus increasing the phenolic content of the sprouted oats [22]. Therefore, UC pretreatment can promote the activity of PAL and CHI, thereby increasing the content of phenolic and flavonoid in SBR.
2.17. Compositions of phenolic and flavonoid
Table 1andTable 2 show the influence of UC pretreatment on compositions of phenolic and flavonoid in SBR. Generally, the content of compositions of phenolic and flavonoid in UC-SBR is higher than that in CG-SBR. In terms of phenolic acid composition, UC pretreatment had great influence on free protocatechuic acid, bound p-coumaric acid and ferulic acid (Table 1). The content of free protocatechuic acid, bound p-coumaric acid and ferulic acid in CG-SBR were 10.28–21.46 mg GAE/100 g DW, 33.57–46.88 mg GAE/100 g DW, and 113.18–139.54 GAE/100 g DW during sprouting. The content of free protocatechuic acid, bound p-coumaric acid and ferulic acid in UC-SBR were 12.71–25.63 mg GAE/100 g DW, 43.58–58.68 mg GAE/100 g DW, and 138.49–177.83 GAE/100 g DW during sprouting. The content of free protocatechuic acid, bound ferulic acid and p-coumaric acid in UC-SBR was higher than that in CG-SBR. Additionally, in terms of flavonoid composition, UC pretreatment had great influence on bound myricetin, daidzin and rutin (Table 2). The content of bound myricetinmyricetin, daidzin and rutin in CG-SBR were 8.86–13.45 mg RE/100 g DW, 45.24–57.83 mg RE/100 g DW, and 491.85–576.82 RE/100 g DW during sprouting. The content of bound myricetin, daidzin and rutin in UC-SBR were 9.16–20.21 mg RE/100 g DW, 50.52–88.44 mg RE/100 g DW, and 543.73–798.19 RE/100 g DW during sprouting. The content of bound myricetin, daidzin and rutin in UC-SBR was higher than that in CG-SBR.
Table 1.
Changes in the phenolic compositions content of untreated and ultrasonic-assisted cellulase pretreated sprouted brown rice during 48 h sprouting.
| Sample | Time (h) | Phenolic compositions (μg/g DW) |
|||||||||||
|---|---|---|---|---|---|---|---|---|---|---|---|---|---|
| Gallic acid | Protocatechuic acid | P-hydroxybe-nzonic acid | Chlorogenic acid | Vanillic acid | Caffeic acid | Syringic acid | p-coumaric acid | Ferulic acid | Singicylic acid | o-coumaric acid | |||
| Free |
CG |
0 | 9.06 ± 0.01d | 10.36 ± 0.19 h | 1.49 ± 0.00f | 25.53 ± 0.04 g | 1.76 ± 0.00f | 8.52 ± 0.00f | 15.88 ± 0.01e | 2.00 ± 0.04a | 10.45 ± 0.01de | 8.00 ± 0.01b | 4.12 ± 0.13a |
| 12 | 8.95 ± 0.01e | 10.28 ± 0.04 h | 1.48 ± 0.00f | 25.02 ± 0.00i | 1.79 ± 0.01ef | 8.36 ± 0.01i | 15.59 ± 0.00f | 1.89 ± 0.01b | 10.34 ± 0.03d | 7.85 ± 0.00c | 3.88 ± 0.08bcd | ||
| 24 | 8.99 ± 0.00e | 13.93 ± 0.12f | 1.51 ± 0.00e | 25.27 ± 0.01 h | 1.86 ± 0.01d | 8.45 ± 0.00 h | 15.75 ± 0.00ef | 1.55 ± 0.01f | 10.35 ± 0.05d | 0.00 ± 0.00d | 3.74 ± 0.02d | ||
| 36 | 9.35 ± 0.01c | 15.84 ± 0.14e | 1.57 ± 0.01c | 26.54 ± 0.02d | 1.96 ± 0.03b | 8.73 ± 0.01d | 16.28 ± 0.00 cd | 1.62 ± 0.01e | 11.07 ± 0.04c | 0.00 ± 0.00d | 4.06 ± 0.02ab | ||
| 48 | 9.09 ± 0.01d | 21.46 ± 0.45b | 1.54 ± 0.01d | 26.01 ± 0.07e | 1.97 ± 0.01b | 8.47 ± 0.00 g | 15.78 ± 0.00ef | 1.60 ± 0.01ef | 10.59 ± 0.01d | 0.00 ± 0.00d | 3.45 ± 0.04e | ||
| UC | 0 | 9.06 ± 0.00d | 10.48 ± 0.18 h | 1.53 ± 0.00de | 25.87 ± 0.00f | 1.79 ± 0.00ef | 8.64 ± 0.01e | 16.08 ± 0.00d | 1.94 ± 0.03ab | 10.52 ± 0.04de | 8.43 ± 0.03a | 3.95 ± 0.04abc | |
| 12 | 9.40 ± 0.00c | 12.71 ± 0.14 g | 1.59 ± 0.00b | 27.00 ± 0.01c | 1.81 ± 0.00e | 8.95 ± 0.00b | 16.67 ± 0.00b | 1.74 ± 0.02d | 10.97 ± 0.01c | 0.00 ± 0.00d | 3.77 ± 0.05 cd | ||
| 24 | 9.56 ± 0.02a | 16.74 ± 0.27d | 1.62 ± 0.00a | 27.38 ± 0.02b | 1.96 ± 0.01b | 9.05 ± 0.00a | 17.06 ± 0.20a | 1.82 ± 0.01c | 11.58 ± 0.02b | 0.00 ± 0.00d | 4.07 ± 0.05ab | ||
| 36 | 9.48 ± 0.02b | 20.44 ± 0.24c | 1.60 ± 0.01b | 27.35 ± 0.07b | 2.03 ± 0.01a | 8.95 ± 0.01b | 16.68 ± 0.00b | 1.91 ± 0.02b | 11.61 ± 0.02b | 0.00 ± 0.00d | 3.74 ± 0.03d | ||
| 48 | 9.37 ± 0.03c | 25.63 ± 0.27a | 1.56 ± 0.01c | 27.92 ± 0.01a | 1.92 ± 0.01c | 8.77 ± 0.00c | 16.37 ± 0.00c | 1.80 ± 0.02 cd | 11.96 ± 0.16a | 0.00 ± 0.00d | 3.46 ± 0.01e | ||
| Bound | CG | 0 | 11.06 ± 0.02f | 0.00 ± 0.00c | 1.92 ± 0.01d | 0.00 ± 0.00c | 2.11 ± 0.00f | 11.53 ± 0.10e | 21.00 ± 0.24e | 38.21 ± 0.49e | 142.98 ± 1.84c | 9.85 ± 0.03e | 3.92 ± 0.01b |
| 12 | 10.88 ± 0.03f | 0.00 ± 0.00c | 1.83 ± 0.01e | 0.00 ± 0.00c | 2.63 ± 0.02e | 11.38 ± 0.15e | 20.37 ± 0.14f | 33.57 ± 0.96f | 113.18 ± 0.41d | 9.55 ± 0.00 h | 3.82 ± 0.01de | ||
| 24 | 12.37 ± 0.00e | 0.00 ± 0.00c | 1.97 ± 0.02c | 0.00 ± 0.00c | 2.87 ± 0.02d | 12.19 ± 0.12bc | 21.26 ± 0.02de | 42.53 ± 1.06d | 137.94 ± 3.25c | 9.80 ± 0.01f | 3.85 ± 0.02 cd | ||
| 36 | 15.22 ± 0.18c | 0.00 ± 0.00c | 1.92 ± 0.01d | 0.00 ± 0.00c | 3.02 ± 0.02c | 12.75 ± 0.22ab | 21.61 ± 0.13 cd | 44.77 ± 0.47 cd | 139.54 ± 1.34c | 9.86 ± 0.00e | 3.74 ± 0.00f | ||
| 48 | 18.01 ± 0.43b | 8.68 ± 0.03b | 1.93 ± 0.00d | 30.60 ± 0.05b | 3.08 ± 0.03c | 12.90 ± 0.38a | 21.13 ± 0.13de | 46.88 ± 1.24bc | 137.36 ± 2.23c | 9.63 ± 0.01 g | 3.56 ± 0.01 g | ||
| UC | 0 | 11.19 ± 0.02f | 0.00 ± 0.00c | 1.94 ± 0.01d | 0.00 ± 0.00c | 2.14 ± 0.00f | 11.74 ± 0.00 cd | 20.77 ± 0.10ef | 38.50 ± 1.27e | 142.60 ± 0.73c | 10.02 ± 0.03d | 3.95 ± 0.01b | |
| 12 | 11.92 ± 0.01e | 0.00 ± 0.00c | 2.04 ± 0.01ab | 0.00 ± 0.00c | 3.15 ± 0.02c | 12.51 ± 0.11ab | 21.82 ± 0.18c | 44.56 ± 0.92 cd | 138.49 ± 1.13c | 10.30 ± 0.01b | 4.04 ± 0.01a | ||
| 24 | 13.12 ± 0.04d | 0.00 ± 0.00c | 2.07 ± 0.01a | 0.00 ± 0.00c | 3.62 ± 0.08b | 12.51 ± 0.11ab | 23.33 ± 0.18a | 43.58 ± 0.80d | 141.34 ± 0.36c | 10.37 ± 0.01a | 3.83 ± 0.00 cd | ||
| 36 | 13.21 ± 0.04d | 0.00 ± 0.00c | 2.02 ± 0.00b | 0.00 ± 0.00c | 3.76 ± 0.06a | 12.57 ± 0.20ab | 22.72 ± 0.13b | 47.85 ± 0.32b | 153.67 ± 1.41b | 10.23 ± 0.01c | 3.86 ± 0.01c | ||
| 48 | 19.68 ± 0.14a | 8.77 ± 0.02a | 2.03 ± 0.01b | 31.46 ± 0.03a | 3.79 ± 0.07a | 12.65 ± 0.10ab | 22.64 ± 0.18b | 58.68 ± 0.74a | 177.83 ± 1.44a | 10.03 ± 0.01d | 3.79 ± 0.01e | ||
CG: control group, sprouted brown rice without ultrasonic-assisted cellulase pretreatment; UC: sprouted brown rice without ultrasonic-assisted cellulase pretreatment. Values are presented as mean ± standard deviation (n = 3). Different lowercases indicate significant differences of the data among the different sprouting hours in the same column(p < 0.05). DW: dry basis weight.
Table 2.
Changes in the flavonoid compositions content of untreated and ultrasonic-assisted cellulase pretreated sprouted brown rice during 48 h sprouting.
| Sample | Time (h) | Flavonoid compositions (μg/g DW) |
||||||||
|---|---|---|---|---|---|---|---|---|---|---|
| Kaempferol | Naringenin | Myricetin | Quercetin | Daidzin | Luteolin | Rutin | Apigenin | |||
| Free |
CG |
0 | 3.55 ± 0.00d | 18.75 ± 0.00f | 3.50 ± 0.07 g | 19.13 ± 0.04bc | ND | 0.54 ± 0.02c | 5.21 ± 0.06f | 2.18 ± 0.03ef |
| 12 | 3.74 ± 0.01c | 18.25 ± 0.05 h | 4.67 ± 0.03b | 18.64 ± 0.05c | ND | 0.50 ± 0.01c | 6.04 ± 0.04e | 2.43 ± 0.04d | ||
| 24 | 3.72 ± 0.03c | 18.45 ± 0.04 g | 4.39 ± 0.04c | 18.87 ± 0.04bc | ND | 0.49 ± 0.00c | 7.00 ± 0.14d | 2.34 ± 0.04de | ||
| 36 | 4.06 ± 0.04a | 19.75 ± 0.02c | 4.35 ± 0.05 cd | 19.51 ± 0.04abc | ND | 0.53 ± 0.01c | 8.73 ± 0.03b | 2.70 ± 0.02c | ||
| 48 | 4.06 ± 0.03a | 20.00 ± 0.07b | 3.68 ± 0.06f | 18.93 ± 0.01bc | ND | 0.51 ± 0.01c | 9.00 ± 0.09b | 4.14 ± 0.04a | ||
| UC | 0 | 3.59 ± 0.01d | 18.96 ± 0.04e | 3.60 ± 0.07 fg | 19.27 ± 0.02abc | ND | 0.55 ± 0.03c | 5.13 ± 0.09f | 2.12 ± 0.03f | |
| 12 | 3.90 ± 0.03b | 19.92 ± 0.02b | 4.89 ± 0.08a | 20.02 ± 0.01abc | ND | 1.07 ± 0.02ab | 7.38 ± 0.15d | 2.82 ± 0.16c | ||
| 24 | 4.05 ± 0.01a | 20.49 ± 0.05a | 4.51 ± 0.02bc | 20.23 ± 0.01ab | ND | 2.60 ± 1.60a | 9.12 ± 0.12b | 2.78 ± 0.07c | ||
| 36 | 4.02 ± 0.01a | 20.38 ± 0.04a | 4.20 ± 0.07d | 19.95 ± 0.01abc | ND | 1.07 ± 0.03ab | 10.09 ± 0.20a | 2.87 ± 0.02c | ||
| 48 | 4.04 ± 0.03a | 19.11 ± 0.03d | 3.93 ± 0.08e | 20.63 ± 1.30a | ND | 0.91 ± 0.03ab | 8.30 ± 0.23c | 3.63 ± 0.07b | ||
| Bound | CG | 0 | 5.62 ± 0.07 fg | 23.37 ± 0.08e | 7.97 ± 0.17 h | 24.42 ± 0.05f | 48.44 ± 0.17d | 1.57 ± 0.07f | 500.45 ± 0.82 g | 4.37 ± 0.06e |
| 12 | 5.21 ± 0.02 h | 22.88 ± 0.04f | 8.86 ± 0.05 g | 23.94 ± 0.05 g | 45.24 ± 0.92e | 1.51 ± 0.02f | 491.85 ± 2.17 h | 4.01 ± 0.04f | ||
| 24 | 5.59 ± 0.05 fg | 23.01 ± 0.03f | 10.39 ± 0.07e | 24.81 ± 0.06e | 51.81 ± 0.53c | 1.94 ± 0.04e | 565.84 ± 2.73d | 4.39 ± 0.02e | ||
| 36 | 6.20 ± 0.13b | 24.43 ± 0.08c | 11.23 ± 0.09d | 25.88 ± 0.11d | 56.39 ± 0.82b | 2.13 ± 0.01d | 562.28 ± 0.94de | 4.64 ± 0.04d | ||
| 48 | 5.48 ± 0.04 g | 23.53 ± 0.06de | 13.45 ± 0.56b | 25.59 ± 0.10d | 57.83 ± 0.20b | 2.46 ± 0.04b | 576.82 ± 0.46c | 5.02 ± 0.03b | ||
| UC | 0 | 5.73 ± 0.03ef | 23.61 ± 0.02d | 7.98 ± 0.07 h | 24.88 ± 0.07e | 47.76 ± 0.10d | 1.58 ± 0.02f | 499.13 ± 1.10 g | 4.55 ± 0.09de | |
| 12 | 6.13 ± 0.02bc | 24.52 ± 0.07bc | 9.16 ± 0.03 fg | 27.24 ± 0.10b | 51.45 ± 0.48c | 1.92 ± 0.06e | 559.45 ± 1.05e | 4.54 ± 0.07de | ||
| 24 | 5.84 ± 0.08de | 24.67 ± 0.05b | 9.67 ± 0.04f | 26.82 ± 0.21c | 50.52 ± 0.38c | 2.08 ± 0.04d | 543.73 ± 0.34f | 4.69 ± 0.07 cd | ||
| 36 | 5.98 ± 0.06 cd | 24.51 ± 0.07bc | 12.41 ± 0.04c | 26.99 ± 0.08bc | 56.31 ± 0.18b | 2.26 ± 0.02c | 635.50 ± 0.96b | 4.86 ± 0.04bc | ||
| 48 | 8.02 ± 0.08a | 26.39 ± 0.05a | 20.21 ± 0.03a | 29.50 ± 0.17a | 88.44 ± 1.17a | 3.83 ± 0.03a | 798.19 ± 0.97a | 7.83 ± 0.07a | ||
CG: control group, sprouted brown rice without ultrasonic-assisted cellulase pretreatment; UC: sprouted brown rice without ultrasonic-assisted cellulase pretreatment. ND: not detectable. Values are presented as mean ± standard deviation (n = 3). Different lowercases indicate significant differences of the data among the different sprouting hours in the same column(p < 0.05). DW: dry basis weight.
The main reason for the enrichment of free phenolic acids in the process of grain sprouting is the activation of endogenous esterase [38]. Previous study showed that most p-coumaric acid, ferulic acid, and rutin existed in bound form in sprouted grains, which was similar to the findings of this research [39]. Another study showed that the bound p-coumaric acid and ferulic acid were enhanced during sprouting, possibly due to the polymerization of free phenolic [17]. During the sprouting of grain, the increase of the content of bound flavonoid compositions may be due to the conversion of some free flavonoid to bound flavonoid [40]. The increase in rutin content in sprouting grain during germination was associated with the inactivation of the rutin-degrading enzyme [37]. Moreover, the composition of phenolic acids and flavonoids in UC-SBR was greater than that in CG-SBR, primarily due to UC pretreatment enhancing the activity of PAL and CHI, thereby facilitating the accumulation of phenolic acids and flavonoids [14].
2.18. Antioxidant capacity
Table 3 presents the influence of UC pretreatment on antioxidant capacity in SBR. In terms of DPPH antioxidant activity, the DPPH scavenging activity of free, bound, and total phenolic in CG-SBR were 97.85–105.82 µmol Trolox/100 g DW, 94.17–101.71 µmol Trolox/100 g DW, and 192.03–207.53 µmol Trolox/100 g DW during sprouting. The DPPH scavenging activity of free, bound, and total phenolic in UC-SBR were 105.88–112.30 µmol Trolox/100 g DW, 98.01–106.31 µmol Trolox/100 g DW, and 203.89–218.43 µmol Trolox/100 g DW during sprouting. In terms of T-AOC, the T-AOC of free, bound, and total phenolics in CG-SBR were 58.66–80.70 U/mg DW, 51.86–75.08 U/mg DW, and 110.52–155.78 U/mg DW during sprouting. The DPPH scavenging activity of free, bound, and total phenolic in UC-SBR were 79.26–103.44 U/mg DW, 55.76–92.78 U/mg DW, and 135.02–196.22 U/mg DW during sprouting. UC pretreatment improved the antioxidant activity of SBR, which was consistent with the change trend of phenolics content.
Table 3.
Changes in the DPPH and T-AOC antioxidant activities of free, bound and total phenolic extracts from untreated and ultrasonic-assisted cellulase pretreated sprouted brown rice during 48 h sprouting.
| Sample | Time (h) | DPPH (µmolTrolox/100 g DW) |
T-AOC (U/mg DW) |
||||
|---|---|---|---|---|---|---|---|
| Free | Bound | Total | Free | Bound | Total | ||
| CG | 0 | 96.23 ± 1.39bF | 91.77 ± 0.08cEF | 188.00 ± 1.31cF | 50.57 ± 1.25dH | 45.70 ± 3.12dG | 96.27 ± 4.36eH |
| 12 | 97.85 ± 0.33bEF | 94.17 ± 1.95cDEF | 192.03 ± 2.28bcEF | 58.66 ± 1.25cG | 51.86 ± 0.61cdF | 110.52 ± 1.86dG | |
| 24 | 99.00 ± 1.05bE | 96.35 ± 0.08bcDEF | 195.34 ± 1.13bE | 73.14 ± 0.73bF | 57.01 ± 2.65bcEF | 130.15 ± 1.92cF | |
| 36 | 105.82 ± 0.84aC | 101.71 ± 0.24aABC | 207.53 ± 0.72aBCD | 77.19 ± 0.14abE | 63.47 ± 0.14bCD | 140.66 ± 0.28bDE | |
| 48 | 102.88 ± 0.13aD | 100.30 ± 2.13abBCD | 203.18 ± 2.00aD | 80.70 ± 1.63aD | 75.08 ± 1.74aB | 155.78 ± 0.11aC | |
| UC | 0 | 97.44 ± 0.67dEF | 90.97 ± 0.48bF | 188.41 ± 1.16cF | 49.84 ± 0.61eH | 45.14 ± 0.07dG | 94.98 ± 0.68eH |
| 12 | 105.88 ± 0.42cC | 98.01 ± 3.34abCDE | 203.89 ± 2.92bCD | 79.26 ± 0.82dDE | 55.76 ± 0.68cEF | 135.02 ± 1.50dEF | |
| 24 | 107.67 ± 0.70bcBC | 102.61 ± 3.46aABC | 210.28 ± 4.17abBC | 86.96 ± 1.15cC | 58.46 ± 0.15cDE | 145.42 ± 1.30cD | |
| 36 | 108.91 ± 0.56bB | 103.66 ± 2.50aAB | 212.57 ± 1.95abAB | 94.90 ± 0.07bB | 67.71 ± 3.39bC | 162.60 ± 3.32bB | |
| 48 | 112.30 ± 0.27aA | 106.31 ± 0.24aA | 218.43 ± 0.52aA | 103.44 ± 0.80aA | 92.78 ± 1.37aA | 196.22 ± 0.57aA | |
CG: control group, sprouted brown rice without ultrasonic-assisted cellulase pretreatment; UC: sprouted brown rice without ultrasonic-assisted cellulase pretreatment. Values are presented as mean ± standard deviation (n = 3). Different lowercases indicate significant differences of the data among the different sprouting hours in the same group (CG group or UC group) (p < 0.05), and different capital letters indicate significant differences in the same column (p < 0.05). DW: dry basis weight.
The increase of antioxidant activity in sprouted grain was mainly due to the enrichment of phenolic substances during sprouting [4]. Previous study showed that ultrasonic stimulation increased the total phenol content of sprouted oats, thereby increasing the DPPH clearance of sprouted oats [22]. In this study, the antioxidant activity of SBR was consistent with the change trend of phenolic substance content. Therefore, UC pretreatment can improve the activities of PAL and CHI, thereby promoting the accumulation of phenolic substances in SBR, and improving the antioxidant activity of SBR.
2.19. Phenolic bioaccessibility
Fig. 5 shows the influence of UC pretreatment on release and bioaccessibility of phenolic in SBR during in vitro digestion. With the extension of digestion time, the release of phenolic in CG-SBR (Fig. 5 A) and UC-SBR (Fig. 5 B) gradually increased, and tended to be stable at the end of digestion. The release of phenolic in CG-SBR and UC-SBR is mainly during the gastric digestion stage. With the increase of sprouting time, the release of phenolic in CG-SBR and UC-SBR also increased, and the release of phenolic in UC-SBR was higher than that in CG-SBR. Additionally, the bioaccessibility of CG-SBR (Fig. 5 C) in the gastric and intestinal stages was 21.41 %-26.54 % and 30.48 %–32.75 %, and the bioaccessibility of UC-SBR (Fig. 5 D) in the gastric and intestinal stages was 23.07 %-28.08 % and 31.76 %-35.50 %. The bioaccessibility of UC-SBR was higher than that of CG-SBR in both the gastric and intestinal stages.
Fig. 5.

The amount of release of phenolic and bioaccessibility of SBR during in vitro digestion. A: Release of phenolic in untreated SBR, B: Release of phenolic in SBR with UC pretreatment, C: Bioaccessibility of phenolic in gastric digestion, D: Bioaccessibility of phenols in intestinal digestion. UC: SBR with UC pretreatment, CG: Control group, SBR without UC pretreatment. p < 0.05 (*), p < 0.01 (**) and p < 0.001 (***) were considered statistically significant, highly significant, and extremely significant between UC and CG at the same sprouting time, respectively. Different letters at the top of the columns indicate significant differences (p < 0.05). DW: dry basis weight.
Under the action of trypsin and pepsin, bound phenolic are released during digestion, thus increasing the content of phenolic in digestive juice [41]. The phenolic in CG-SBR and UC-SBR are mainly released in the gastric juices, mainly because the acidic environment of the gastric juices is conducive to the release of phenolic acids [42]. Nevertheless, the low release of phenolic in intestinal juice may be due to the fact that the PH of intestinal juice is close to neutral, which has a certain degree of inhibition on the release of phenolic [16]. The phenolic release of UC-SBR is higher than that of CG-SBR, mainly because the total phenolic content in UC-SBR is higher. Previous showed that sprouting can improve the bioaccessibility of phenolic in sorghum [18]. The wall breaking effect generated by UC pretreatment may disrupt the binding of phenolic in UC-SBR to substances such as proteins, fats and starches, thus promoting the release of phenolic during digestion, increasing the phenolic bioaccessibility [43].
3. Conclusions
The effects of UC pretreatment on brown rice's surface microstructure, nutrients, key enzyme activities, phytic acid, and phenolic bioavailability during sprouting were examined in this study. The UC pretreatment altered SBR's surface structure, increased antioxidant capacity, and enhanced the activity of various metabolic key enzymes. Compared with the CG-SBR (12–48 h), the content of GABA, total γ-oryzanol, total phenolic and total flavonoid in UC-SBR increased by 2.57–5.48 mg/100 g DW, 23.71–27.16 µg/g DW, 7.28–20.70 GAE mg/100 g and 0.66–4.27 RE mg/100 g, and phytic acid content decreased by 0.30–1.01 mg/g DW. Furthermore, UC pretreatment increased SBR's bioaccessibility and phenolic release quantity during in vitro digestion. Compared with the CG-SBR (12–48 h), the bioaccessibility of UC-SBR in the gastric and intestinal digestion stages was increased by 1.54 %-3.74 % and 1.28 %-3.55 %. Therefore, UC pretreatment may present a novel strategy for enhancing the nutritional profile of SBR. This investigation initially probed the mechanisms underlying UC pretreatment's impact on SBR by assessing key enzyme activities and metabolite levels. Future studies should aim to comprehensively decipher these mechanisms through genomic and metabolomic analyses. Moreover, exploring the application of UC-pretreated SBR in the development of nutritionally superior grain products represents an emerging research avenue warranting further exploration.
CRediT authorship contribution statement
Ren Li: Writing – review & editing, Conceptualization. Tiancong Song: Investigation. Rui Kang: Methodology. Wenhao Ma: Methodology. Mengmeng Zhang: Formal analysis. Feiyue Ren: Writing – review & editing, Resources, Funding acquisition.
Declaration of competing interest
The authors declare that they have no known competing financial interests or personal relationships that could have appeared to influence the work reported in this paper.
Acknowledgements
This work was supported by National Natural Science Foundation of China (No. 32372365); the Beijing Natural Science Foundation (No. 6232001); Cultivation Project of Double First-Class Disciplines of Food Science and Engineering, Beijing Technology & Business University (No. 19008022213); and Key R&D Program of Shandong Province (2021CXGC010807).
Footnotes
Supplementary data to this article can be found online at https://doi.org/10.1016/j.ultsonch.2024.106878.
Appendix A. Supplementary data
The following are the Supplementary data to this article:
References
- 1.John C.B., Stephen M.B., Piebiep G. Health-promoting germinated rice and value-added foods: a comprehensive and systematic review of germination effects on brown rice. Crit. Rev. Food Sci. 2023;63:11570–11603. doi: 10.1080/10408398.2022.2094887. [DOI] [PubMed] [Google Scholar]
- 2.Chinma C.E., Adedeji O.E., Jolayemi O.S., Ezeocha V.C., Ilowefah M.A., Rosell C.M., Adebo J.A., Wilkin J.D., Adebo O.A. Impact of germination on the techno-functional properties, nutritional composition, and health-promoting compounds of brown rice and its products: A review. J. Food Sci. 2024;89:8–32. doi: 10.1111/1750-3841.16832. [DOI] [PubMed] [Google Scholar]
- 3.Li R., Feng Y.L., Zhang H.J., Liu J., Wang J. Recent advances in fabricating, characterizing, and applying food-derived fibers using microfluidic spinning technology. Food Hydrocoll. 2023;144 doi: 10.1016/j.foodhyd.2023.108947. [DOI] [Google Scholar]
- 4.Kathuria D., Hamid P., Chavan A.K., Jaiswal A., Thaku A.K., Dhiman A. Comprehensive review on sprouted seeds bioactives, the impact of novel processing techniques and health benefits. Food Rev. Int. 2024;40:370–398. doi: 10.1080/87559129.2023.2169453. [DOI] [Google Scholar]
- 5.Sun Y., Mehmood A., Battino M., Xiao J.B., Chen X.M. Enrichment of gamma-aminobutyric acid in foods: From conventional methods to innovative technologies. Food Rev. Int. 2022;162 doi: 10.1016/j.foodres.2022.111801. [DOI] [PubMed] [Google Scholar]
- 6.Prasad P., Sahu J.K. Effect of soaking and germination on grain matrix and glycaemic potential: A comparative study on white quinoa, proso and foxtail millet flours. Food Biosci. 2023;56 doi: 10.1016/j.fbio.2023.103105. [DOI] [Google Scholar]
- 7.Li R., Li Z.J., Wu N.N., Tan B. Effect of pre-treatment on the functional properties of germinated whole grains: A review. Cereal Chem. 2022;99:253–269. doi: 10.1002/cche.10500. [DOI] [Google Scholar]
- 8.Isaac Duah B., Kerry C. Trends in extracting Agro-byproducts' phenolics using non-thermal technologies and their combinative effect: Mechanisms, potentials, drawbacks, and safety evaluation. Food Chem. 2024;437 doi: 10.1016/j.foodchem.2023.137841. 137841. [DOI] [PubMed] [Google Scholar]
- 9.Amna T., Amna S., Muhammad U., Aysha S., Marriam A., Rimsha T., Rimsha Y., Issa Khan M. Extraction of dietary fiber and polyphenols from mango peel and its therapeutic potential to improve gut health. Food Biosci. 2023;53 doi: 10.1016/j.fbio.2023.102669. [DOI] [Google Scholar]
- 10.Wang D.L., Yan L.F., Ma X.B., Wang W.J., Zou M.M., Zhong J.J., Ding T., Ye X.Q., Liu D.H. Ultrasound promotes enzymatic reactions by acting on different targets: Enzymes, substrates and enzymatic reaction systems. Int. J. Biol. Macromol. 2018;119:453–461. doi: 10.1016/j.ijbiomac.2018.07.133. [DOI] [PubMed] [Google Scholar]
- 11.Umego E.C., He R.H., Ren W.B., Xu H.N., Ma H.L. Ultrasonic-assisted enzymolysis: Principle and applications. Process Biochem. 2021;100:59–68. doi: 10.1016/j.procbio.2020.09.033. [DOI] [Google Scholar]
- 12.Nadar S.S., Rathod V.K. Ultrasound assisted intensification of enzyme activity and its properties: a mini-review. World J. Microb. Biot. 2017;33 doi: 10.1007/s11274-017-2322-6. [DOI] [PubMed] [Google Scholar]
- 13.Li R., Li Z.J., Wu N.N., Tan B. The combined effect of cold plasma pretreatment and germination on nutritional quality and texture properties of brown rice cakes. Int. J. Food Sci. Tech. 2023;58:3511–3521. doi: 10.1111/ijfs.16397. [DOI] [Google Scholar]
- 14.Wu N.N., Li R., Li Z.J., Tan B. Effect of germination in the form of paddy rice and brown rice on their phytic acid, GABA, γ-oryzanol, phenolics, flavonoids and antioxidant capacity. Food Rev. Int. 2022;159 doi: 10.1016/j.foodres.2022.111603. [DOI] [PubMed] [Google Scholar]
- 15.Li R., Li Z.J., Wu N.N., Tan B. The effect of cold plasma pretreatment on GABA, γ-oryzanol, phytic acid, phenolics, and antioxidant capacity in brown rice during germination. Cereal Chem. 2023;100:321–332. doi: 10.1002/cche.10609. [DOI] [Google Scholar]
- 16.Li R., Wang Q., Peng H., Zhao G.L., Zhang D.J., Li Z.J. Exploring the effect of microwave treatment on phenolic flavonoids, antioxidant capacity, and phenolic in vitro bioaccessibility of sorghum. Int. J. Food Sci. Tech. 2022;57:2510–2522. doi: 10.1111/ijfs.15624. [DOI] [Google Scholar]
- 17.Ti H.H., Zhang R.F., Zhang M.W., Li Q., Wei Z.C., Zhang Y., Tang X.J., Deng Y.Y., Liu L., Ma Y.X. Dynamic changes in the free and bound phenolic compounds and antioxidant activity of brown rice at different germination stages. Food Chem. 2014;161:337–344. doi: 10.1016/j.foodchem.2014.04.024. [DOI] [PubMed] [Google Scholar]
- 18.Li R., Wang Q., Zhao G.L., Peng H., Zhang D.J., Li Z.J. Effects of germination time on phenolics, antioxidant capacity, in vitro phenolic bioaccessibility and starch digestibility in sorghum. Int. J. Food Sci. Tech. 2022;57:5175–5185. doi: 10.1111/ijfs.15827. [DOI] [Google Scholar]
- 19.Li Y., Hu A.J., Zheng J., Wang X.Y. Comparative studies on structure and physiochemical changes of millet starch under microwave and ultrasound at the same power. Int. J. Biol. Macromol. 2019;141:76–84. doi: 10.1016/j.ijbiomac.2019.08.218. [DOI] [PubMed] [Google Scholar]
- 20.Geng D.H., Lin Z.X., Liu L., Qin W.Y., Wang A.X., Wang F.Z., Tong L.T. Effects of ultrasound-assisted cellulase enzymatic treatment on the textural properties and in vitro starch digestibility of brown rice noodles. Lwt-Food Sci. Technol. 2021;146 doi: 10.1016/j.lwt.2021.111543. [DOI] [Google Scholar]
- 21.Ding J.Z., Hou G.G., Dong M.Y., Xiong S.B., Zhao S.M., Feng H. Physicochemical properties of germinated dehulled rice flour and energy requirement in germination as affected by ultrasound treatment. Ultrason. Sonochem. 2018;41:484–491. doi: 10.1016/j.ultsonch.2017.10.010. [DOI] [PubMed] [Google Scholar]
- 22.Ding J.Z., Johnson J., Chu Y.F., Feng H. Enhancement of gamma-aminobutyric acid, avenanthramides, and other health-promoting metabolites in germinating oats (Avena sativa L.) treated with and without power ultrasound. Food Chem. 2019;283:239–247. doi: 10.1016/j.foodchem.2018.12.136. [DOI] [PubMed] [Google Scholar]
- 23.Zhang Q., Jia F.G., Zuo Y.J., Fu Q., Wang J.T. Optimization of cellulase conditioning parameters of germinated brown rice on quality characteristics. J. Food Sci. Tech. Mys. 2015;52:465–471. doi: 10.1007/s13197-013-0982-2. [DOI] [Google Scholar]
- 24.Hou D.Z., Tang J., Feng Q.Q., Niu Z.T., Shen Q., Wang L., Zhou S.M. Gamma-aminobutyric acid (GABA): a comprehensive review of dietary sources, enrichment technologies, processing effects, health benefits, and its applications. Crit. Rev. Food Sci. 2023 doi: 10.1080/10408398.2023.2204373. [DOI] [PubMed] [Google Scholar]
- 25.Bai J.Y., Huang J.Y., Jiang P.L., Feng J.X., Zhu R., Dong L.W., Liu Z.D., Li L., Luo Z. Combined ultrasound and germination treatment on the fine structure of highland barley starch. Ultrason. Sonochem. 2023;95 doi: 10.1016/j.ultsonch.2023.106394. [DOI] [PMC free article] [PubMed] [Google Scholar]
- 26.Wang Y.C., Cao H.Z., Wang S.C., Guo J.M., Dou H.Y., Qiao J.F., Yang Q.H., Shao R.X., Wang H. Exogenous γ-aminobutyric acid (GABA) improves salt-inhibited nitrogen metabolism and the anaplerotic reaction of the tricarboxylic acid cycle by regulating GABA-shunt metabolism in maize seedlings. Ecotox. Environ. Safe. 2023;254 doi: 10.1016/j.ecoenv.2023.114756. [DOI] [PubMed] [Google Scholar]
- 27.Pan J., Shi Y.Y., Zhu S.H., Song Z.Y., Shi J.Y. Enhancing the resistance of peach fruit against Monilinia fructicola using exogenous nitric oxide by activating the gamma-aminobutyric acid shunt. Postharvest Biol. Tec. 2023;200 doi: 10.1016/j.postharvbio.2023.112314. [DOI] [Google Scholar]
- 28.Abrishamkar A., Nilghaz A., Saadatmand M., Naeimirad M., deMello A.J. Microfluidic-assisted fiber production: Potentials, limitations, and prospects. Biomicrofluidics. 2022;16 doi: 10.1063/5.0129108. [DOI] [PMC free article] [PubMed] [Google Scholar]
- 29.Fukushima A., Uchino G., Akabane T., Aiseki A., Perera I., Hirotsu N. Phytic Acid in Brown Rice Can Be Reduced by Increasing Soaking Temperature. Foods. 2021;10:23. doi: 10.3390/foods10010023. [DOI] [PMC free article] [PubMed] [Google Scholar]
- 30.Yodpitaka S., Mahatheeranont S., Boonyawan D., Sookwong P., Roytrakul S., Norkaew O. Cold plasma treatment to improve germination and enhance the bioactive phytochemical content of germinated brown rice. Food Chem. 2019;289:328–339. doi: 10.1016/j.foodchem.2019.03.061. [DOI] [PubMed] [Google Scholar]
- 31.Techo J., Soponronnarit S., Devahastin S., Wattanasiritham L.S., Thuwapanichayanan R., Prachayawarakorn S. Effects of heating method and temperature in combination with hypoxic treatment on γ-aminobutyric acid, phenolics content and antioxidant activity of germinated rice. Int J Food Sci Tech. 2019;54:1330–1341. doi: 10.1111/ijfs.14021. [DOI] [Google Scholar]
- 32.Seo D.H., Kim M.S., Choi H.W., Sung J.M., Park J.D., Kum J.S. Effects of millimeter wave treatment on the germination rate and antioxidant potentials and gamma-aminobutyric acid of the germinated brown rice. Food Sci. Biotechnol. 2016;25:111–114. doi: 10.1007/s10068-016-0016-8. [DOI] [PMC free article] [PubMed] [Google Scholar]
- 33.Galanakis C.M. Sustainable applications for the valorization of cereal processing by-products. Foods. 2022;11:241. doi: 10.3390/foods11020241. [DOI] [PMC free article] [PubMed] [Google Scholar]
- 34.Li H.Y., Xu M.H., Yao X., Wen Y.Y., Lu S.Y., Wang J., Sun B.G. The promoted hydrolysis effect of cellulase with ultrasound treatment is reflected on the sonicated rather than native brown rice. Ultrason. Sonochem. 2022;83 doi: 10.1016/j.ultsonch.2022.105920. [DOI] [PMC free article] [PubMed] [Google Scholar]
- 35.Rousseau S., Kyomugasho C., Celus M., Hendrickx M.E.G., Grauwet T. Barriers impairing mineral bioaccessibility and bioavailability in plant-based foods and the perspectives for food processing. Crit Rev Food Sci. 2020;60:826–843. doi: 10.1080/10408398.2018.1552243. [DOI] [PubMed] [Google Scholar]
- 36.Ling A., Li X.P., Hu X.Z., Ma Z., Wu K.M., Zhang H.W., Hao M., Wei S.F. Dynamic changes in polyphenol compounds, antioxidant activity, and PAL gene expression in different tissues of buckwheat during germination. J. Sci. Food Agr. 2018;98:5723–5730. doi: 10.1002/jsfa.9119. [DOI] [PubMed] [Google Scholar]
- 37.Chen Y., Zhu Y., Qin L. The cause of germination increases the phenolic compound contents of Tartary buckwheat (Fagopyrum tataricum) J Future Foods. 2022;2:372–379. doi: 10.1016/j.jfutfo.2022.08.009. [DOI] [Google Scholar]
- 38.Tian S., Nakamura K., Kayahara H. Analysis of phenolic compounds in white rice, brown rice, and germinated brown rice. J. Agric. Food Chem. 2004;52:4808–4813. doi: 10.1021/jf049446f. [DOI] [PubMed] [Google Scholar]
- 39.Zhou Z.K., Robards K., Helliwell S., Blanchard C. The distribution of phenolic acids in rice. Food Chem. 2004;87:401–406. doi: 10.1016/j.foodchem.2003.12.015. [DOI] [Google Scholar]
- 40.Suzuki T., Honda Y., Funatsuki W., Nakatsuka K. Purification and characterization of flavonol 3-glucosidase, and its activity during ripening in tartary buckwheat seeds. Plant Sci. 2002;163:417–423. doi: 10.1016/s0168-9452(02)00158-9. [DOI] [Google Scholar]
- 41.Ydjedd S., Bouriche S., López-Nicolás R., Sánchez-Moya T., Frontela-Saseta C., Ros-Berruezo G., Rezgui F., Louaileche H., Kati D.E. Effect of in Vitro gastrointestinal digestion on encapsulated and nonencapsulated phenolic compounds of carob (Ceratonia siliqua L.) pulp extracts and their antioxidant capacity. J. Agric. Food Chem. 2017;65:827–835. doi: 10.1021/acs.jafc.6b05103. [DOI] [PubMed] [Google Scholar]
- 42.Fu T.T., Cao H.W., Zhang Y., Guan X. Effect of milling on in vitro Digestion-Induced release and bioaccessibility of active compounds in rice. Food Chem. 2024;437 doi: 10.1016/j.foodchem.2023.137936. [DOI] [PubMed] [Google Scholar]
- 43.Zhang B., Zhang Y.J., Li H.Y., Deng Z.Y., Tsao R. A review on insoluble-bound phenolics in plant-based food matrix and their contribution to human health with future perspectives. Trends Food Sci Tech. 2020;105:347–362. doi: 10.1016/j.tifs.2020.09.029. [DOI] [Google Scholar]
Associated Data
This section collects any data citations, data availability statements, or supplementary materials included in this article.