



Abstract
Minimally invasive surgery (MIS) has expanded broadly in the field of abdominal and pelvic surgery. However, there are still prevalent issues surrounding intracorporeal surgery, such as iatrogenic injury, anastomotic leakage, or the presence of positive tumor margins after resection. Current approaches to address these issues and advance laparoscopic imaging techniques often involve fluorescence imaging agents, such as indocyanine green (ICG), to improve visualization, but these have drawbacks. Hyperspectral imaging (HSI) is an emerging optical imaging modality that takes advantage of spectral characteristics of different tissues. Various applications include tissue classification and digital pathology. In this study, we developed a dual-camera system for high-speed hyperspectral imaging. This includes the development of a custom application interface and corresponding hardware setup. Characterization of the system was performed, including spectral accuracy and spatial resolution, showing little sacrifice in speed for the approximate doubling of the covered spectral range, with our system acquiring 29 spectral images from 460–850 nm. Reference color tiles with various reflectance profiles were imaged and a RMSE of 3.56 ± 1.36% was achieved. Sub-millimeter resolution was shown at 7 cm working distance for both hyperspectral cameras. Finally, we image ex vivo tissues, including porcine stomach, liver, intestine, and kidney with our system and use a high-resolution, radiometrically calibrated spectrometer for comparison and evaluation of spectral fidelity. The dual-camera hyperspectral laparoscopic imaging system can have immediate applications in various surgeries.
Keywords: Hyperspectral imaging, minimally invasive surgery, image-guided intervention, laparoscopy
1. INTRODUCTION
Laparoscopic and robotic surgery have been increasing in prevalence across all surgical specialties for decades, including urology, neurology, and gynecology among others. Along with the development of minimally invasive surgical procedures and techniques, the hardware and imaging systems that allow such procedures have been developed, refined, and improved upon as well. This includes the development of fluorescence imaging, 3D stereoscopic visualization, and narrow-band imaging, all of which have been incorporated to minimally invasive surgical imaging systems with the hope of reducing the occurrence rate of anastomotic leakage, iatrogenic injury, and positive tumor margins, among other adverse outcomes. These state-of-the-art systems still have drawbacks, such as the quick half-life and saturation effect of indocyanine green (ICG) or the lack of objective, quantitative analysis in real time [1, 2].
Hyperspectral imaging (HSI) has been investigated for its non-invasive, label-free, and quantitative applications such as tissue classification [3–5] and measurement of blood-oxygen saturation in intestinal tissues [6–9]. HSI has also seen use in disease diagnosis, histopathology, and surgical guidance [10, 11], but a major drawback of current systems when implemented into a minimally invasive setting is long acquisition times which are usually on the order of seconds [12] as well as bulky systems that need further development in order to be translated into a feasible real-time operative workflow.
The recent development of high-speed HSI has begun to receive some attention [13], but generally the improved speed comes at the cost of reduced spectral and/or spatial dimension sizes. We seek to work towards addressing these drawbacks through the development of a dual-camera hyperspectral imaging setup for laparoscopic applications. Luthman et. al. implemented a similar imaging setup but with the use of a flexible Polyscope, working towards esophageal applications [14]. Overall, the dual-camera, high-speed HSI configuration has yet to be fully developed, integrated, and applied in a single system. Our work is to this end and builds upon our previous work [15] by widening the spectral range that can be analyzed by the system through the additional hyperspectral camera with little cost in acquisition speed. This is done not only through an improved hardware design, but also through the development of an application to interface with the system. This system can be used in future studies to address current setbacks in minimally invasive surgery (MIS) and improve patient outcomes through objective, quantitative means.
2. METHODS
Our HSI system is constructed to integrate with typical intracorporeal laparoscopic setups, with the entire imaging system being contained on the eyepiece of a clinical laparoscope. Technical validations are performed to assess the capabilities of the HSI technology for spectral fidelity and spatial resolution. Finally, ex vivo tissue images were acquired on porcine visceral tissues including stomach, intestine, liver, and kidney tissue specimens. A calibrated spectrometer was used alongside the imaging system for assessment of the absolute spectral reflectance curves of each tissue.
2.1. Imaging setup
The imaging setup (Figure 1) constructed for this work included a 10 mm, 0° laparoscope (Olympus UHD) along with a halogen source (OSL2 High-Intensity Fiber-Coupled Illuminator, Thorlabs, Newton, NJ), 605 nm dichroic mirror (Thorlabs, Newton, NJ), 35-mm VIS-NIR C-mount lens (Edmond Optics) and two snapshot hyperspectral cameras capable of capturing up to 120 hypercubes/sec through the use of mosaic filters in 4×4 configuration. Adapters were fabricated for the coupling of the eyepiece of the laparoscope with the dichroic mirror as well as the light guide from the halogen source to the light post of the scope. The spectral range of the visible (VIS) camera includes 16 wavelengths from 460–600 nm. The red/near-infrared (RNIR) camera includes 15 spectral images at different wavelengths in the range of 600–870 nm.
Figure 1.

Dual-camera hyperspectral laparoscopic imaging setup.
2.2. Image acquisition
To acquire images with each hyperspectral camera simultaneously, we developed an in-house software application written in C++, using the QT graphical user interface framework. Our application allows for five hyperspectral cameras to be connected simultaneously. The runtime parameters for acquisition and processing can be individually set for each camera. This includes integration time, F-number, focal length, and exit pupil distance of the optical setup. For efficient imaging with our stationary system, a burst capture feature was implemented to allow users to specify a number of images or an amount of time for which to capture. Images will either be stored as an entire stack or averaged for noise reduction. Visualization of each camera view can be toggled via tabs, as shown in Figure 2.
Figure 2.

Software application for concurrent hyperspectral imaging with the dual-camera system.
The workflow for acquiring hyperspectral images with the software and system is as follows. First, the integration time must be set for each camera, which is determined by relative intensity values of the white reference tile. Once set along with the other mentioned optical parameters, a dark reference/dark current image must be acquired by either shutting off the light source or blocking any incoming light at the distal end of the scope. Once the software has the dark reference stored with the given parameters, other images can be acquired, beginning with the white reference image of a 95% reflectance tile. Captured images can be displayed on tabs for post processing or stored directly into a specified directory.
2.3. System validation
To validate the spectral accuracy of the hyperspectral cameras in the system, standard reflectance tiles were used (Spectralon, Labsphere, Inc., North Sutton, New Hampshire) to compare spectral footprints from hyperspectral images with standard reflectance curves provided via spectroscopy. Eight tiles were included in the spectral analysis, each covering 360–830 nm. Each tile produces a unique spectral footprint throughout the range, as to validate the accuracy throughout the intensity range of the system. RMSE values were calculated to quantitatively evaluate the performance of the system. To evaluate the spatial resolution capabilities of the setup, a 1951 USAF Resolution Test Target (Thorlabs, Newton, NJ) was imaged at a working distance typical of laparoscopic procedures, 7 cm. Ex vivo tissue spectral validation was performed with a calibrated spectrometer (HR2000+ES, Ocean Insight, Orlando, FL) by fixing the probe in the field-of-view of the laparoscope. Calibration of the spectrometer was performed using a radiometrically calibrated source (HL-3P-CAL, Ocean Insight, Orlando, FL). The spectrometer was calibrated for absolute irradiance measurements from 190–1100 nm.
2.4. Data processing
Data processing was performed in MATLAB (MathWorks Inc, Natick, MA, USA) and included hypercube reconstruction, demosaicing, spectral analysis, glare removal, registration and other image processing. To evaluate the spatial resolution capabilities of the system, we implemented demosaicing algorithms outlined in our previous work, namely low-pass filtering and white reference calibration, as well as another developed technique, the filter convolution method. This technique involves attaining a filter-wise sum across the raw mosaic image to produce a 2D kernel equivalent in size to the mosaic pattern of the camera, 4×4 in our case. Then a convolution is performed over the image with the kernel and averaged with another convolution of the inverse kernel. The results can be visualized in Figure 3.
Figure 3.
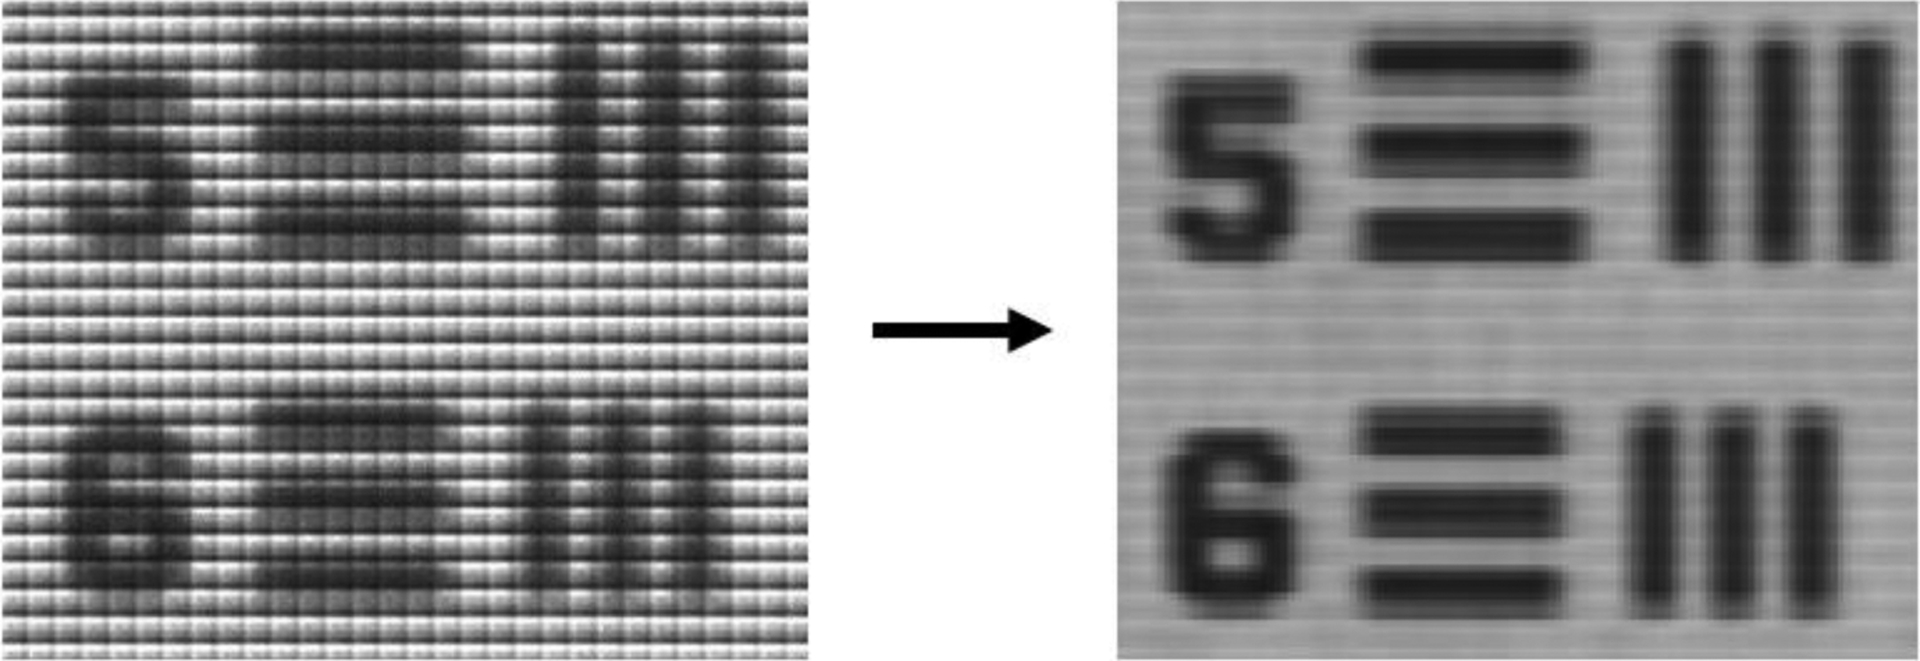
Demosaic methods visualized. The raw mosaic image (left) is processed into the demosaiced image (right).
To analyze the tissue spectra derived from the hyperspectral cameras, a binary mask of the tissue was generated. Hyperspectral images were calibrated according to Equation (1), where the used standard is 95% reflectance white reference:
| (1) |
where Ireflectance is the calibrated reflectance intensity, Iprocessed and IWR are the dark-reference corrected reflectance intensities of the tissue and white reference, respectively. Calibrated reflectance values were then acquired over the tissue masks in each hyperspectral image to produce spectral footprints of each imaged tissue. Thresholding was performed to mitigate the effects of glare from the tissue, although these pixels were not entirely removed as this processing could not be mirrored in the ground truth spectral data. Pseudo-RGB images are also created for each tissue image, selecting bands from the VIS hyperspectral camera corresponding to red (700.0 nm), green (546.1 nm), and blue (435.8 nm) channels. This was done by selecting the acquired bands closest to the pre-determined color channel wavelengths.
2.5. Evaluation
In order to measure spatial contrast, a Michelson contrast cutoff of 20% was used as shown in Equation (2) [16]:
| (2) |
The line elements were analyzed to produce a 1-D plot of intensities. A sine curve was then fit to the plot to get Smax and Smin values. Smax corresponds to the peak of the sine curve produced by the intensities of the line elements and Smin to the minimum of the curve. Smaller elements and groups of the resolution target were analyzed until the contrast threshold was surpassed. Contrast was analyzed on full resolution demosaic images outlined in our previous work, including low-pass filtering and white reference calibration demosaicing [15], as well as the newly proposed filter-convolution method.
2.6. Ex vivo tissue imaging
A porcine model was used for ex vivo tissue imaging including stomach, liver, intestine, and kidney tissues. Tissues were imaged at frame rates of 25 fps until 50–60 unprocessed images were acquired, resulting in as many hypercubes per tissue that were then averaged to reduce the effect of noise on the hyperspectral images and produced spectral curves. To validate the spectra of ex vivo tissues, a radiometrically calibrated spectrometer was used alongside our imaging system to acquire absolute reflectance values from the tissues. Manual segmentation of the hyperspectral images was performed for each camera through MATLAB in order to form tissue masks for registration of the hyperspectral cameras. Preprocessing included averaging the hypercube along the spectral dimension, then binarizing each resulting grayscale image. Further refinement was performed manually before performing affine, control point registration of the RNIR hypercube to the VIS hypercube. As the cameras were fixed, the same transformation matrix could be used on each hyperspectral image. A proposed region of interest (ROI) corresponding with the captured spectrometer readings was assumed for each tissue for comparison of spectral curves.
3. RESULTS
3.1. Validation result
Spectral validation was performed on eight reference tiles (Figure 4). Spectral footprints of each tile are provided from 360–830 nm, with a 1-nm step size. The dual-camera hyperspectral system with our optical configuration captures spectral images from 457–844 nm, as such the HSI curve extends marginally beyond the reference curves for the tiles. These values were excluded from quantitative analysis. Recorded reflectance values conformed to the reference curves well, with the largest RMSE resulting from the slight shift in the steep section of the graph of the blue tile. Error also seemed to accumulate in the extreme regions of the captured spectral range. Our proposed justification for this behavior is the light source used and the transmission of the filters used to form the hypercubes. The halogen source used emits a lower power density of light in the lower visible wavelength range. The filters used for the final RNIR wavelengths have relatively lower quantum efficiency than the others used in the system. Table 1 outlines the RMSE values for each tile.
Figure 4.

Results of spectral accuracy of VIS camera (solid) against the tile standard reflectance (dashed). A) Red reflectance tile. B) Green reflectance tile. C) Blue reflectance tile. D) Yellow reflectance tile. E) Violet reflectance tile. F) Cyan reflectance tile. G) Orange reflectance tile. H) Purple reflectance tile.
Table 1.
RMSE for each color tile.
| Color | RMSE |
|---|---|
| Red | 2.66 |
| Green | 1.95 |
| Blue | 5.70 |
| Yellow | 5.16 |
| Violet | 4.13 |
| Cyan | 3.84 |
| Orange | 2.56 |
| Purple | 2.52 |
Spatial validation showed sub-millimeter horizontal and vertical resolution for each camera and each demosaicing technique, with the white reference calibration demosaic edging out the filter-convolution technique, followed by the low-pass filtering for the VIS camera. Vertical and horizontal resolutions of 0.250 mm and 0.223 mm were achieved, respectively. For the RNIR camera, the filter-convolution technique was superior, equally distinguishing vertical and horizontal elements spaced 0.353 mm apart. The other two techniques performed equally with the RNIR camera in each direction, achieving 0.500 mm and 0.446 mm vertical and horizontal resolutions, respectively. While all techniques produced sub-millimeter resolutions, qualitative analysis suggests the superiority of the filter-convolution technique. Low-pass filtering retains some high frequency information and white reference calibration seemingly lacks global contrast, each resulting in lower quality images.
3.2. Ex vivo tissue spectra
Tissue imaging was carried out using the dual-camera system. Blood absorption coefficients also vary distinctly in the RNIR region, providing clearer tissue distinctions and estimation of blood content [17]. Tissues were imaged individually and collectively and tissue masks of spectrometer ROIs were created for each specimen after thresholding glare pixels. Figure 5 shows the pseudo-RGB images produced from the VIS hypercubes as well as the mean reflectance values for each tissue. The resulting spectral curves produced from the calibrated spectrometer are also plotted for reference. The values measured by the spectrometer underwent a similar calibration to the hypercubes, with each tissue spectral curve being normalized to the spectral reading of the white reference tile. After this calibration, a least squares regression was performed with one of the tissues to slightly adjust the scale further. Tissues are distinguished by their reflectance intensities in the RNIR range.
Figure 5.

Spectral footprint of liver, stomach, intestinal, and kidney tissue from laparoscopic system (solid) plotted alongside spectrometer readings (dotted). A) Pseudo-RGB endoscopic image of intestinal tissue. B) Pseudo-RGB endoscopic image of stomach tissue. C) Pseudo-RGB endoscopic image of liver tissue. D) Pseudo-RGB endoscopic image of kidney tissue.
As seen in some of the validation spectral curves, the features in the short VIS range from the laparoscopic system did not align as well with the spectrometer curves as in other wavelength ranges. Hyperspectral images were acquired with the spectrometer in the frame and subsequently without. The changing time was 10–15 seconds. Tissue drying, glare, field of view, and viewing angle of the spectrometer are all possible confounding variables in this workflow and should be considered. Tissues are fairly distinguishable via their spectral information alone. Kidney and liver tissues are the closest two, but even there is notable distinction in the curves produced by our system and the spectrometer.
4. DISCUSSION AND CONCLUSION
A high-speed dual-camera hyperspectral laparoscopic imaging system along with an acquisition and processing framework was developed to improve spectral capabilities with little sacrifice to imaging speeds. The system was validated to show acceptable spatial resolution and spectral accuracy. Ex vivo visceral tissues were imaged with the system to mimic tissues visualized during laparoscopic and robotic surgery and were analyzed according to their respective spectral footprints.
The high-speed dual-camera hyperspectral laparoscopic imaging system can have immediate applications in endoscopic surgery across many specialties. We also show a software tool under development that will interface with endoscopic systems and utilize the rich information, as well as provide interpretable results in the future. Our system addresses the drawbacks of long acquisition times and bulkiness of current HSI systems, as well as decreased spectral range of fast systems. Through various imaging and processing techniques we show sufficient spatial resolution and spectral accuracy in a high-speed, lightweight HSI system for laparoscopic applications. The constructed system shows the ability to distinguish different visceral tissues based on their spectral reflectance patterns, a capability that will be built upon in future studies. Future work will also explore the many applications of HSI as it relates to endoscopic, laparoscopic and robotic surgery and automated real-time intraoperative histopathological diagnosis, with an emphasis on different spectral ranges for various procedures.
ACKNOWLEDGMENTS
This research was supported in part by the U.S. National Institutes of Health (NIH) grants (R01CA156775, R01CA204254, R01HL140325, and R21CA231911), by the Cancer Prevention and Research Institute of Texas (CPRIT) grant RP190588.
REFERENCES
- [1].Alius C et al. , “Indocyanine Green-Enhanced Colorectal Surgery—between Being Superfluous and Being a Game-Changer,” Diagnostics, vol. 10, no. 10, p. 742, 2020. [DOI] [PMC free article] [PubMed] [Google Scholar]
- [2].Grosek J and Tomazic A, “Key clinical applications for indocyanine green fluorescence imaging in minimally invasive colorectal surgery,” J Minim Access Surg, vol. 16, no. 4, pp. 308–314, Oct-Dec 2020, doi: 10.4103/jmas.JMAS_312_18. [DOI] [PMC free article] [PubMed] [Google Scholar]
- [3].Baltussen EJM et al. , “Hyperspectral imaging for tissue classification, a way toward smart laparoscopic colorectal surgery,” J Biomed Opt, vol. 24, no. 1, pp. 1–9, Jan 2019, doi: 10.1117/1.JBO.24.1.016002. [DOI] [PMC free article] [PubMed] [Google Scholar]
- [4].Seidlitz S et al. , “Robust deep learning-based semantic organ segmentation in hyperspectral images,” Med Image Anal, vol. 80, p. 102488, Aug 2022, doi: 10.1016/j.media.2022.102488. [DOI] [PubMed] [Google Scholar]
- [5].Studier-Fischer A et al. , “Spectral organ fingerprints for machine learning-based intraoperative tissue classification with hyperspectral imaging in a porcine model,” Sci Rep, vol. 12, no. 1, p. 11028, Jun 30 2022, doi: 10.1038/s41598-022-15040-w. [DOI] [PMC free article] [PubMed] [Google Scholar]
- [6].Clancy NT, Arya S, Stoyanov D, Singh M, Hanna GB, and Elson DS, “Intraoperative measurement of bowel oxygen saturation using a multispectral imaging laparoscope,” Biomedical Optics Express, vol. 6, no. 10, pp. 4179–4179, 2015/10// 2015, doi: 10.1364/boe.6.004179. [DOI] [PMC free article] [PubMed] [Google Scholar]
- [7].Holmer A, Marotz J, Wahl P, Dau M, and Kammerer PW, “Hyperspectral imaging in perfusion and wound diagnostics - methods and algorithms for the determination of tissue parameters,” Biomed Tech (Berl), vol. 63, no. 5, pp. 547–556, Oct 25 2018, doi: 10.1515/bmt-2017-0155. [DOI] [PubMed] [Google Scholar]
- [8].Jansen-Winkeln B et al. , “Determination of the transection margin during colorectal resection with hyperspectral imaging (HSI),” Int J Colorectal Dis, vol. 34, no. 4, pp. 731–739, Apr 2019, doi: 10.1007/s00384-019-03250-0. [DOI] [PubMed] [Google Scholar]
- [9].Thomaßen MT et al. , “In vivo evaluation of a hyperspectral imaging system for minimally invasive surgery (HSI-MIS),” Surg Endosc, vol. 37, no. 5, pp. 3691–3700, May 2023, doi: 10.1007/s00464-023-09874-2. [DOI] [PMC free article] [PubMed] [Google Scholar]
- [10].Lu G and Fei B, “Medical hyperspectral imaging: a review,” J Biomed Opt, vol. 19, no. 1, p. 10901, Jan 2014, doi: 10.1117/1.JBO.19.1.010901. [DOI] [PMC free article] [PubMed] [Google Scholar]
- [11].Halicek M et al. , “Hyperspectral Imaging of Head and Neck Squamous Cell Carcinoma for Cancer Margin Detection in Surgical Specimens from 102 Patients Using Deep Learning,” Cancers (Basel), vol. 11, no. 9, Sep 14 2019, doi: 10.3390/cancers11091367. [DOI] [PMC free article] [PubMed] [Google Scholar]
- [12].Köhler H et al. , “Laparoscopic system for simultaneous high-resolution video and rapid hyperspectral imaging in the visible and near-infrared spectral range,” Journal of Biomedical Optics, vol. 25, no. 08, 2020/8// 2020, doi: 10.1117/1.jbo.25.8.086004. [DOI] [PMC free article] [PubMed] [Google Scholar]
- [13].Ayala L et al. , “Spectral imaging enables contrast agent–free real-time ischemia monitoring in laparoscopic surgery,” Science Advances, vol. 9, 10 March 2023. [DOI] [PMC free article] [PubMed] [Google Scholar]
- [14].Luthman AS et al. , “Bimodal reflectance and fluorescence multispectral endoscopy based on spectrally resolving detector arrays,” Journal of Biomedical Optics, vol. 24, no. 3, p. 14, October 2018, doi: 10.1117/1.JBO.24.3.031009. [DOI] [PMC free article] [PubMed] [Google Scholar]
- [15].Pruitt K, Johnson B, Gahan J, Ma L, and Fei B, “A high-speed hyperspectral laparoscopic imaging system,” in Medical Imaging 2023: Image-Guided Procedures, Robotic Interventions, and Modeling, 2023, vol. 12466: Proceedings of SPIE, doi: 10.1117/12.2653922. [DOI] [PMC free article] [PubMed] [Google Scholar]
- [16].Takamatsu T et al. , “Over 1000 nm Near-Infrared Multispectral Imaging System for Laparoscopic In Vivo Imaging,” Sensors (Basel), vol. 21, no. 8, April 9 2021, doi: 10.3390/s21082649. [DOI] [PMC free article] [PubMed] [Google Scholar]
- [17].Jacques SL, “Corrigendum: Optical properties of biological tissues: a review,” Physics in Medicine and Biology, vol. 58, no. 14, pp. 5007–5008, 2013, doi: 10.1088/0031-9155/58/14/5007. [DOI] [PubMed] [Google Scholar]