

Abstract
Objectives:
Overdose prevention centers (OPCs) provide a safe place where people can consume pre-obtained drugs under supervision so that a life-saving medical response can be provided quickly in the event of an overdose. OPCs are programs that are established in Canada and have recently become legally sanctioned in only a few United States jurisdictions.
Methods:
We conducted a systematic review that summarizes and identifies gaps of economic evidence on establishing OPCs in North America to guide future expansion of OPCs.
Results:
We included 16 final studies that were evaluated with the CHEERS and Drummond checklists. Eight studies reported cost-effectiveness results (e.g., cost per overdose avoided or cost per QALY), with six also including cost-benefit; five reported only cost-benefit results, and three cost-offsets. Health outcomes primarily included overdose mortality outcomes and/or HIV/HCV infections averted. Most studies used mathematical modeling and projected OPC outcomes using the experience of a single facility in Vancouver, BC.
Conclusions:
OPCs were found to be cost-saving, or to have favorable cost-effectiveness or cost-benefit ratios across all studies. Future studies should incorporate the experience of OPCs established in various settings and employ a greater diversity of modeling designs.
Keywords: cost-effectiveness analysis, overdose prevention centers, systematic literature review
INTRODUCTION
The fentanyl-driven opioid epidemic has fueled increasing overdose fatalities in the US and Canada.1 The public health response to overdose deaths includes expanded access to naloxone, a drug that reverses opioid overdoses.2 While naloxone saves lives, it requires that a witness is present to administer the medication and/or call emergency services. Fentanyl and other novel opioids, due to their high potency, may need additional units of naloxone or oxygen support to prevent death.3 Overdose prevention centers (OPCs) provide a safe place where people can consume pre-obtained drugs under supervision so that, in the event of an overdose, an appropriate medical response can be provided quickly. OPC models include “supervised injection facilities,” or broader “supervised consumption sites” which also allow drug inhalation, smoking, and oral ingestion on site.4 OPCs typically offer harm reduction services beyond naloxone and oxygen administration, such as providing sterile supplies, wound care, and referrals to substance use disorder (SUD), HIV, and HCV treatment programs. OPCs have been operating in Western Europe since the 1980s and Australia since 2001, as part of a comprehensive harm reduction strategy to reduce the risks of overdose and injection-associated infections such as HIV and HCV.5,6
While OPCs provide essential public health services, they face barriers to initiation and expansion in North America. The first OPC in North America opened in Vancouver in 2003, demonstrating public health benefits, including a 35% reduction in opioid overdose fatalities within the 500 meter area around the OPC.7 Over 30 OPCs have opened in Canada8 more recently after overcoming political or community opposition.9 In the United States, the only two legally sanctioned OPCs opened in New York City in November 2021,10 and Rhode Island is preparing to implement a pilot OPC. 11 Adoption in both countries has been hindered by legal barriers, such as a US federal statute that may be used to prosecute OPC operators and Canadian federal regulations establishing preconditions for approval.9
A better understanding of the economic evidence about OPCs in North America can help policymakers weigh benefits and potential downsides of OPCs. This systematic review summarizes the economic evidence to date, including identifying gaps in the literature that can be addressed in future work from newly established North American OPCs.
METHODS
Search Strategy
Our search strategy followed the Preferred Reporting Items for Systematic Reviews and Meta-Analyses (PRISMA) methodology.12,13 The protocol was registered with PROSPERO (CRD42020176033) which details information about the population, interventions comparator control, and other items. Studies were identified by searching PubMed, Embase, Web of Science, EconLit, PsycINFO, and Cost-Effectiveness Analysis (CEA) Registry. Authors conducted the most recent literature search in February 2023.
Inclusion and exclusion criteria
To be included, studies had to be peer-reviewed, written in English, and compare one or more OPC interventions to at least one alternative (e.g., no OPC) in North America using an economic approach (e.g., cost-offset, cost-effectiveness analysis, cost-benefit analysis). Commentaries/editorials, theses/dissertations, reviews, and studies without a comparator were excluded.
Selection process
Study selection, quality appraisal, and data collection were performed by two authors independently. Search terms included combinations of terms for “overdose prevention” and “economic” using Boolean operators and key words related to OPC and costs (Supplemental Table 1). Studies were included from database inception through December 2022. Records were uploaded to Covidence® software (Covidence; Melbourne, Australia). In Covidence®, studies first underwent title and abstract screening, followed by full text review. Disagreements between the two reviewers’ independent assessment during the selection process were reconciled by a third author.
Data extraction
For each study, we extracted: 1) study design, 2) population, 3) outcomes, 4) perspectives and time horizon, 5) design, 6) health economic measures, and 7) findings. Primary outcomes of interest were comparisons of costs (e.g., healthcare utilization, cost-offsets), cost-effectiveness (e.g., cost per overdose avoided, cost per quality-adjusted life year or QALY), and cost-benefit (e.g., cost to benefit ratios). Modeling techniques were categorized as decision tree, Markov model, microsimulation model, dynamic model, or discrete event simulation, as suggested by Kuntz et al.14 Results are presented by geographic location in the currency and year in which they were published. We conducted a narrative synthesis of results as studies varied in setting, population, and outcome measure; therefore, combining data across studies was not feasible.1,2
Reporting and Quality Assessments
We used the Consolidated Health Economic Evaluation Reporting Standards (CHEERS) 15,16 and the Drummond checklists17 to evaluate the study reporting and quality, respectively. The CHEERS checklist consists of 28 items that were scored using ‘yes’ (met the criteria in total), ‘no’ (not met), or ‘not applicable.’ For the Drummond 10-item checklist, we allocated points for each question and categorized articles as poor (1 to 3), average (4 to 7), or good (8 to10) quality, as was done in a previous study.18 Two reviewers independently scored each article using both checklists and discrepancies were resolved by a third reviewer.
RESULTS
Descriptive Characteristics
We identified 6,712 references for initial screening and removed 2,470 duplicates. Of the 4,242 remaining studies, 31 references received full-text screening, and 16 studies were included (Figure 1). Key characteristics of these studies are reported in Table 1. All of the articles, except for one, were evaluated as “good” quality according to the Drummond checklist (Supplemental Table 2), and reporting was generally complete except for four studies that failed to report three or more items from the CHEERS checklist (Supplemental Table 3). The authors of the 16 studies reported no conflicts of interest and funding sources were predominantly from government or not-for-profit agencies (Supplemental Table 4).
Figure 1:
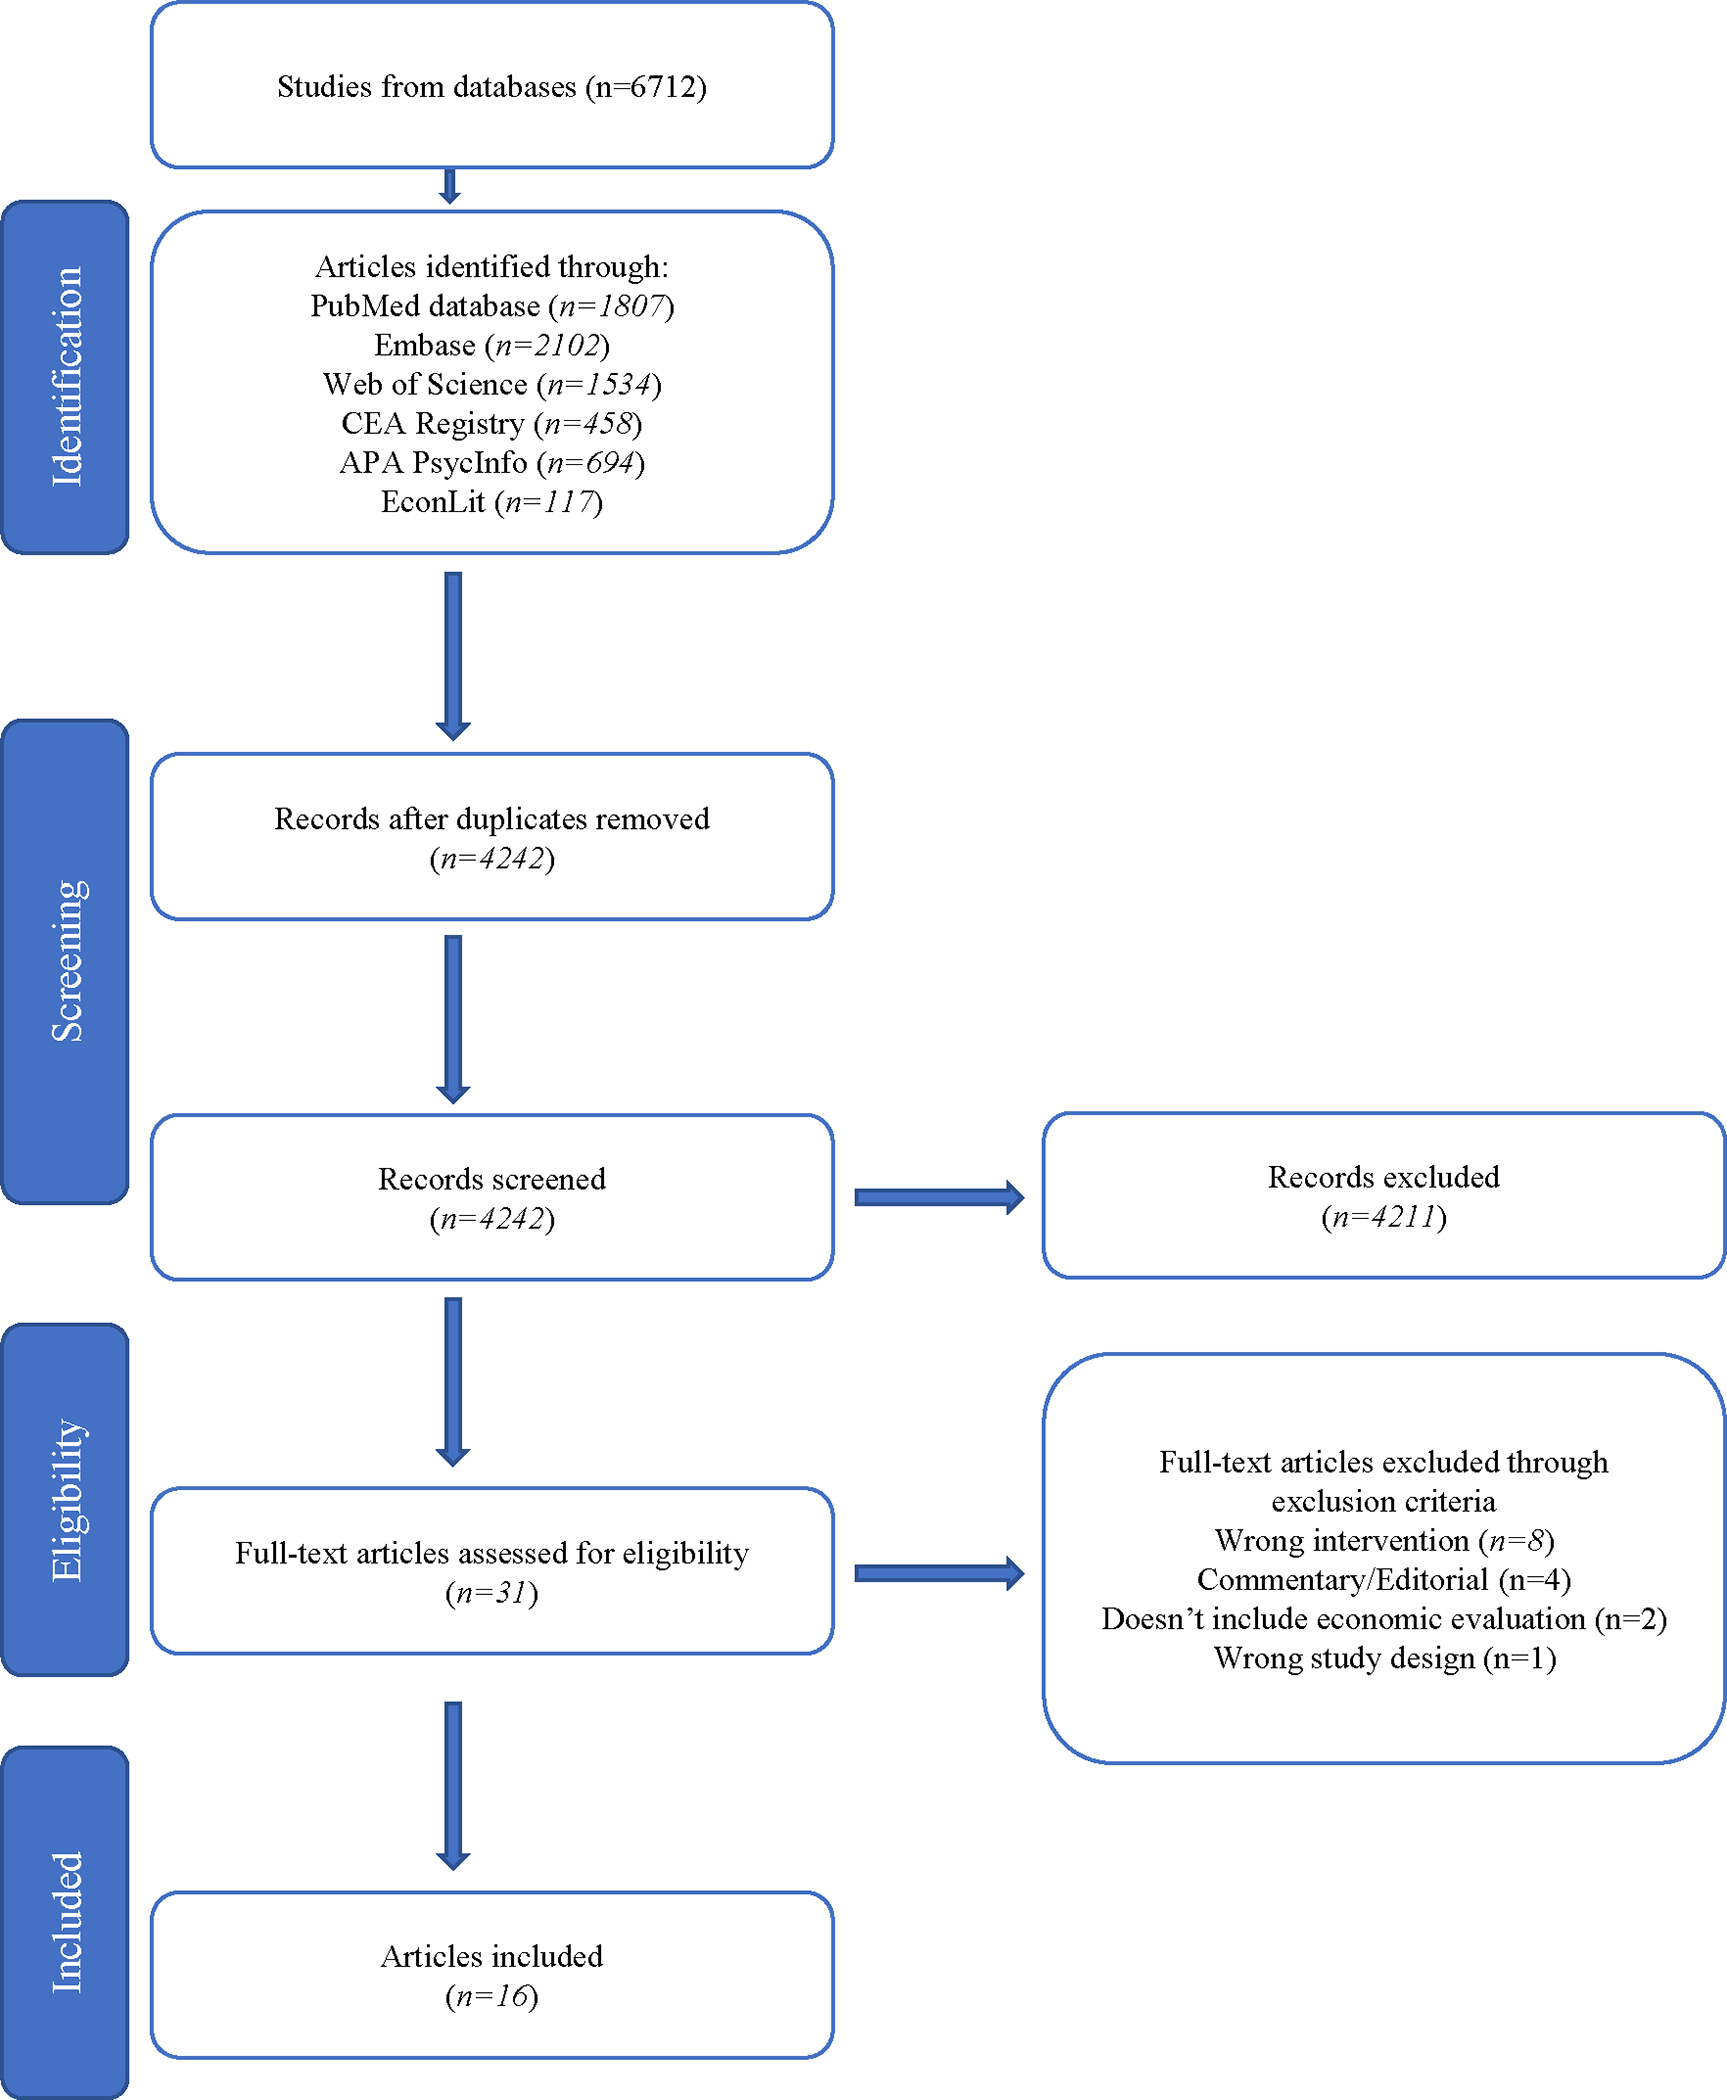
PRISMA Flow Diagram
Table 1.
Summary of health economic evidence on overdose prevention centers
| Study | Population | Outcomes | Perspective, Time Horizon | Design, Number of OPC | Health Economic Measures | Key Findings |
|---|---|---|---|---|---|---|
| Canada | ||||||
| Bayoumi & Zaric 200820 | People who inject drugs [7,000 people] in Vancouver, BC | Prevented HCV and HIV infections, and life-years gained | Healthcare, 10 years | Dynamic compartmental model, 0–1 | Cost-effectiveness: $ per LY gained (2008 CAD) | Maintaining one OPC is economically preferred to no OPCs and can save nearly CAD $14 million and gain 920 life-years over ten years. In scenarios with increased safer needle sharing practices off-site or greater methadone uptake, savings and life-years gained grow further. |
| Andresen & Boyd 201019 | People who inject drugs [5,000 people] in Vancouver, BC | Prevented HIV infections, HIV deaths, and overdose deaths | Healthcare,a 1 year | Mathematical modeling,b 0–6 | Cost-effectiveness: $ per HIV infection avoided (2006 CAD) cost-benefit: cost-benefit ratio |
The existing OPC provides benefits of more than CAD $6 million per year at a cost-benefit ratio of 4.06:1 and varies between 3.00:1 to 8.04:1 based on HIV model structure assumptions. |
| Pinkerton 201026 | People who inject drugs [13,500 people] in Vancouver, BC | Prevented HIV infections | Healthcare,a 1 year | Mathematical modeling,b 0–1 | Cost-offset: healthcare costs averted (2008 CAD) | The existing OPC and syringe service facility, prevents 83.5 HIV infections per year, saving CAD $17.6 million, which more than offsets Insite’s annual operating cost of CAD $3 million. Without considering decreased off-site syringe sharing, the OPC component of Insite is responsible for 2.8 of the 83.5 averted HIV infections. If syringe sharing among regular clients is reduced by 35% and 70%, 1.4 and 3.8 additional HIV infections would be averted, which correspond to an added savings of CAD $294,777 and CAD $800,109, respectively. |
| Andresen & Jozaghi 201227 | People who inject drugs [4,700 people] in Vancouver, BC | Prevented HIV infections | Healthcare,a 1 year | Mathematical modeling,b 1–15 | Cost-benefit: Cost-benefit ratio | Implementing additional OPCs is economically beneficial. Assuming one-third, two-thirds, or the entire population of PWID are reached and decreases of off-site needle sharing, implementing up to two OPCs, five OPCs, and eight OPCs, respectively, would have economic benefits at least as great as expenses. A decreased initial needle sharing rate lowers the number of economically viable OPCs by one to two based on proportion of PWID recruited. |
| Jozaghi et al. 201323 | People who inject drugs [4,300–12,500 people] in Montreal, QC | Prevented HIV and HCV infections | Healthcare,a 1 year | Mathematical modeling, 0–7 | Cost-effectiveness: $ per HIV and HCV averted (2012 CAD) cost-benefit: cost-benefit ratio |
Implementing up to three OPCs would have economic benefits at least as great as expenses when considering averted HCV and HIV infections separately. Lower assumptions of local needle sharing rates suggest as few as one OPC may be economically viable. |
| Jozaghi et al. 201424 | People who inject drugs [3,000–5,000 people] in Ottawa, ON | Prevented HIV and HCV infections | Healthcare, a 1 year | Mathematical modeling,b 0–7 | cost-effectiveness: $ per HIV infection averted and $ per HCV infection averted (2013 CAD) & cost-benefit: cost-benefit ratio |
Implementing any number of OPCs would yield economic benefits lesser than expenses when the benefits of averted HCV and HIV infections are considered separately, but when considered together, up to two OPCs would have economic benefits greater than expenses. Results are highly sensitive to the local needle sharing rate, with a lower estimate suggesting no OPCs may be economically favored. |
| Jozaghi & VANDU 201425 | People who smoke crack cocaine [4,330 people] in Vancouver, BC | Prevented HCV infections | Healthcare,a 1 year | Mathematical modeling, b 0–7 | Cost-effectiveness: $ per HCV averted (2012 CAD) cost-benefit: cost-benefit ratio |
When considering averted HCV infections, implementing up to seven SSFs is expected to provide substantial savings when compared to costs. High cost-benefit ratios—from 20.6:1 for one SSF to 5.9:1 for seven SSFs—are driven largely by the low operating costs of SSFs and the high rate of pipe sharing. |
| Jozaghi et al. 201529 | People who inject drugs [1,500–2,000 people] in Victoria, BC | Prevented HIV and HCV infections, prevented overdose deaths | Societal, 1 year | Mathematical modeling,b 0–4 | Cost-effectiveness: $ per HIV infection averted and $ per HCV infection averted (2013 CAD) cost-benefit: Cost-benefit ratio |
If two OPCs were to open in Victoria, BC, it would have a benefit-cost ratio of 1.25:1. The cost-benefit ratios suggest that opening up to two OPCs in Victoria may save taxpayers’ dollars for the resources that they consume. |
| Jozaghi & Jackson 201522 | People who inject drugs [2,000 people] in Saskatoon, SK | Prevented HIV infections | Healthcare, 1 year | Mathematical modeling,b 0–4 | Cost-effectiveness: $ per HIV averted (CAD, year unknown) cost-benefit: cost-benefit ratio |
Implementing up to four OPCs would have economic benefits at least as great as expenses when considering averted HIV infections. Results are highly sensitive to the local needle sharing rate, with a lower estimate suggesting no OPCs may be economically viable. |
| Enns et al. 201621 | People who inject drugs in Toronto, ON [10,000 people] and Ottawa, ON | Prevented HCV and HIV infections, and QALYs | Healthcare, 20 years | Dynamic compartmental model, 0–5 | Cost-effectiveness: $ per QALY gained (2012 CAD) | In Ottawa and Toronto, up to two and three OPCs, respectively, would be cost-effective at a $50,000 per QALY threshold when considering the health effects of HIV and HCV. Results were sensitive to variations in facility operating costs, the population of PWID, and changes in syringe sharing. |
| Khair et al. 202228 | People who inject drugs [22,425 clients served] in Calgary, AB | Prevented need for ambulance, emergency department services | Payer, 2 years and 3 months | Descriptive statistics | Cost-offset: Ambulance and ED services averted (CAD, year unknown) | The OPC in Calgary was able to save $2,364,876 CAD within 2 years and 3 months of being open. Additionally, within the most recent full year of operation (2019), 698 overdoses were managed at the OPC site. |
| United States | ||||||
| Irwin et al. 201632 | People who inject drugs [22,500 people] in San Francisco, CA | Prevented HIV and HCV infections, overdose deaths, SSTI hospitalizations, and increased methadone uptake | Societal, 1 year | Mathematical modeling,b 0–1 | Cost-benefit: Cost-benefit ratio (USD, year unknown) | If an OPC were implemented, a 2.33:1 ratio of total benefits to costs is expected over the first year. Savings from four factors, averted HIV and HCV infections, increased MOUD referrals, and reduced skin and soft tissue infections, generated a significant majority of the projected benefits in roughly equal proportions. |
| Irwin et al. 201733 | People who inject drugs [20,950 people] in Baltimore, MD | methadone uptake, prevented HCV and HIV infections, SSTIs, and overdose ambulance calls, ED encounters, hospitalizations, and deaths | Societal, 1 year | Mathematical modeling,b 0–1 | Cost-benefit: cost-benefit ratio (USD, year unknown) | If an OPC in Baltimore, Maryland was implemented, a 4.35:1 ratio of total benefits to costs is expected over the first year. Cost-benefit results were robust but were most affected by variation in the facility’s projected operating cost. |
| Hood et al. 201931 | People who inject drugs [21,863 people] in King County, WA | Prevented overdose deaths and ambulance calls, increased MOUD uptake, and prevented ED visits, hospitalizations from overdose, and HIV and HCV infections | Societal,a 1 year | Mathematical modeling, 0, 1, or 1 scaled-up | Cost-benefit: cost-benefit ratio (2016 USD) | Implementing one OPC is expected to save over $5.1 million with a ratio of total benefits to costs of 4.22:1 over one year. If a scaled-up program were implemented, the ratio of benefits to costs would rise to 5.32:1. An increased local overdose raises the projected cost-benefit ratio to 7.70:1. |
| Behrends et al. 201930 | People who inject drugs in New York, NY | Prevented overdose deaths, ambulance calls, ED visits, and hospitalizations | Healthcare, 1 year | Mathematical modeling, 0, 1, or 4 | Cost-offset: healthcare costs averted (2016 USD) | One OPC is expected to save, or offset, at least $700,000 per year in healthcare costs from averted overdoses, while four OPCs would save at least $2,214,700 per year. Prevented hospitalizations constitute a significant majority of projected savings. |
| Chambers et al. 202234 | People who inject drugs in Providence, RI | Prevented overdose related deaths, ambulance runs, ED encounters, and hospitalizations | Modified Societal, 1 year | Decision analytic model, 0, 1 | Cost-benefit: cost-benefit ratio (2020 USD) | If an OPC were to open in Providence, Rhode Island, it is estimated to save $1,104,454 per year compared to just a syringe service program. Findings were robust under all sensitivity analyses. |
CAD = Canadian dollar; ED = emergency department; HCV = hepatitis c virus; MOUD = medications for opioid use disorder; OPC = opioid prevention center; PWID = people who inject drugs; SSTI = skin and soft tissue infection; USD = United States dollar; VANDU = Vancouver Area Network of Drug Users
analysis perspective is not explicitly stated in article and inferred by authors based on model valuation
basecase assumes use of Jacobs et al. to determine HIV infection rates
Geography and Currency
Eleven studies examined Canadian sites and presented costs in Canadian dollars (CAD).19–29 Four of these studies examined a single OPC (3 in Vancouver, 1 in Calgary) after the programs had been established. The remaining 7 Canadian studies examined scenarios of expanding OPC services in Vancouver, or opening OPCs in other Canadian cities where they had not yet been established. Five studies analyzed the establishment of OPCs in the United States, where, at the time, no legally sanctioned OPCs had been established.30–34 Six studies failed to report the currency year.20,22,27,28,32,33
Population
All studies focused on a local population of people who use drugs. The population of people who use drugs who were served by an existing OPC or could be served by a hypothetical OPC varied from 1,500 to 22,500 (Table 1). Fifteen studies considered people who inject drugs.19–24,26–34 One study assessed supervised smoking facilities (SSFs) and only considered people who smoke crack cocaine.25
Perspective
The study’s stakeholder perspective informs which costs and savings are included in the analysis. Thirteen papers explicitly reported the stakeholder perspective: seven reported a healthcare system perspective,20,21,24,25,30 one a payer perspective,28 and five a societal perspective.19,29,32–34 Of the three studies that did not explicitly report a perspective, we inferred that two adopted a healthcare system perspective26,27 and one a societal perspective31 based on the cost-categories included.
Interventions and Comparators
Six studies considered the health and economic impact of one OPC vs. zero,20,26,28,32–34 nine studies compared the impact of zero, one, or multiple OPCs,19,21–25,29–31 and one study considered the impact of expanding from the existing OPC up to 15 additional OPCs.27
Study Analytic Approaches
Design
Fourteen studies used decision tree-type mathematical modeling,19,22–34 and two used dynamic compartmental modeling.20,21 Nine of the studies that used mathematical modeling estimated HIV outcomes based on previously published HIV infection models, with substantial overlap among the models used. Four of these papers used the Jacobs et al. model only,23,25,27,32 one used the Kaplan & O’Keefe model only,26 three used both of these models only,22,24,29 and one used these two models in combination with two others. 19 Similarities in study designs may be partially attributed to the substantial author overlap among the papers (Figure 2).
Figure 2:

Author Social Network
Notes: Co-authorship diagram for authors of two or more publications. The size of each circle is proportional to the number of publications an author is included in. The weight of the lines between authors is proportional to the number of publications both authors appear on. Note: Size of circle is proportional to the number of publications by a given author. Weight of the line between authors is proportional to the number of publications on which both authors appear. For example, Andresen co-authored 5 papers included in this review including 2 with Reid and Jozaghi and another 2 with Jozaghi. Chambers et al. and Khair et al. had no co-authorship with any of the authors in the review and are excluded from the figure.
Health Economic Approach
Five studies reported cost-benefit results only,27,31–34 two reported cost-effectiveness results only,20,21 six reported both,19,22–25,29 and the remaining three reported cost-offsets.26,28,30 Cost-benefit studies report a ratio of costs avoided to costs incurred, with a ratio of >1 implying a positive return on investment, or net economic benefit results in currency or QALYs. Although reporting results as net benefit is preferred,35 all cost-benefit results in these studies were reported as ratios. Cost-effectiveness studies report the cost per unit of health improvement achieved (such as infection avoided, life saved, or QALY saved) which can be compared to a threshold value that a decision maker is willing to pay. Cost-offset studies quantify the amount of costs avoided as a result of the program’s impact on health outcomes.17
Time Horizon and Discounting
Twelve studies used a one-year time horizon only,19,22,24–27,29–34 one reported results for a 27 month horizon,28 one reported 1-year and 10-year results,23 one used a 10-year horizon20; and one used a 20-year horizon.21 Two studies discounted their results at 5% for 10 year and 20 year horizons in accordance with Canadian guidelines,20,21 and one study did not report a discount rate for their 10-year estimate.23
Sensitivity and Scenario Analyses
All but one study28 performed sensitivity or scenario analyses to assess the robustness of their results. Of these 15 studies, 11 varied the baseline sharing rate of drug consumption equipment (syringes or pipes),19–27,29,32,33 and five varied the facility cost.20,21,32–34 Nine studies only included one parameter in their sensitivity/scenario analysis and the remaining six studies reported multiple sensitivity or scenario analyses by varying 5 to 69 parameters.20,21,26,32–34 Only one study reported a probabilistic sensitivity analysis.21
Outcomes and Findings
Summary of Health Outcomes
The health outcomes considered varied widely (Table 2), but the studies can be divided into two categories: 1) those focusing primarily on HIV and/or HCV infections averted, and 2) those focusing primarily on opioid overdose fatality outcomes.The first group included ten studies 19–27,29 all examined Canadian cities and were published between 2008 and 2015. Two studies included life-years gained and QALYs as health outcomes in addition to HCV or HIV cases avoided.20,21 The second group included six studies, assessing five cities in the U.S.30–34 and one city in Canada;28 all were published between 2016 and 2022.Most of this group also included other health outcomes (e.g, HIV and HCV, skin and soft tissues infections (SSTIs), emergency room visits, and uptake of medication for opioid use disorder (MOUD)) (Supplemental Table 5).
Table 2.
Summary of key study parameters for overdose prevention centers
| Location | Base Case Estimate | Estimate Source and Rationale | |
|---|---|---|---|
| Value of HIV-infection Averted | |||
| Canada | |||
| Vancouver19,20 | 150,000 over lifetime (2006 CAD)19 | Authors selected the base case value as slightly lower than the median of three previous estimates from Holtgrave and Pinkerton 199743 (132,000 2006 CAD), Jacobs et al 199944 (179,000 2006 CAD) and Gold et al 199745 (154,000 2006 CAD). HIV treatment costs generally represent the standard of care at the time with either antiretroviral monotherapy or 2-drug combinations. | |
| 15,564 per year (2008 CAD)20 | Estimate taken from Krentz et al 200846 and includes cost for all drugs, in-patient, and out-patient care from a national Canadian cohort of individuals between 1995 and 2001. | ||
| Montreal23 Ottawa24 Saskatoon22 Vancouver26,27 Victoria29 |
210,555 over lifetime (2008 CAD) | 2011 Cost estimate of medical care over entire lifetime derived from Canadian research Network47 and based on most recent research.26,48,49 | |
| Toronto21 Ottawa21 |
16,947 per year (2012 CAD) | Assumes treatment with antiretroviral therapy. Estimate taken from Krentz et al 2008 representing care delivered between 1995 and 2001.46 | |
| United States32,33 | 402,000 over lifetime (2011 USD) | Estimate of average lifetime treatment costs cites the Centers for Disease Control and Prevention 201550 which likely uses Farnham et al’s estimate51 of patients who initiate HIV treatment with high CD4 counts representing guidelines of immediate initiation upon diagnosis. | |
| Value of HCV-infection averted | |||
| Canada | |||
| Montreal23 Ottawa24 Vancouver25 Victoria29 |
35,143 (2012 CAD) | Undiscounted lifetime productivity loss per person with incident HCV derived from 2010 Australian report estimate of 35,143 (2008 AUD).39 Does not include cost of HCV treatment. | |
| Vancouver20 | 2,650 per year (2008 CAD) | Annual cost based on U.S. lifetime cost of $35,000 to $40,000 for treatment including labs, medications (including use of interferon containing regimens), and provider visits. Estimated annual cost of HCV derived from Krahn et al 2005.52 | |
| Toronto21 Ottawa21 |
60,000 (2012 CAD) | Cost of 12-week pharmaceutical treatment with direct-acting antivirals derived from 2015 newspaper article36 and a 2015 Canadian Agency for Drugs and Technologies in Health report.37 | |
| United States32,33 | 68,219 (2014 USD) | Average lifetime medical cost for a patient with untreated HCV adjusted for inflation, based on $64,490 (2011 USD) from Razavi et al 2013.38 The cost of HCV treatment is not included. | |
| Value of a death averted | |||
| Canada | |||
| Vancouver19 | 660,000 (2006 CAD) | Includes tangible (i.e., value person may add to the economy) only and valued at British Columbia GDP at that time ($33,640 2006 CAD; 35,143 2013 CAD) and an average age of 35 based on epidemiologic data53 and assumed the age of death as 65. | |
| Victoria29 | 978,924 (2013 CAD) | ||
| United States | |||
| Baltimore City33 | $503,869 (USD, year unknown) | Considers “tangible” costs only and is based on average retirement age of 65,54 median wage for Baltimore City 55and 3% discount.19 | |
| New York City30 | $3,872 (2016 USD) | Calculated by valuing emergency medical services ($392),56,57 ED ($684),58 and Inpatient ($14,154) and assumed 90% of overdose fatalities included EMS services, 25% of fatalities59 took place in the ED. | |
| San Francisco32 | $1,170,000 (USD, year unknown) | Followed methods reported in Andresen 201019 and adjusted for California per capita income. | |
| Seattle31 | $566,539 (2016 USD) | Used a productivity valuation approach based on median per capita income in King County, WA (e.g., $41,664 in 2016)60 weighted by probability of being alive61,62 from one year to the next assuming average age of 39 based on published King County Syringe Exchange Survey data and assuming retirement age of 65. | |
| Annual Per Person Savings from Increase in MOUD Uptake | |||
| United States | |||
| Baltimore City33 San Francisco32 |
14,000 (USD, year unknown) per person, per year | Assumes average annual cost of MOUD at $4,00063 and a cost-benefit ratio of 4·5 that incorporates savings from reduced crime and health costs, reductions in HIV, HCV, and SSTI infection due to decreases in injection drug use.49,63–68 | |
| Seattle31 | $14,651 (2016 USD) per person per year | $11,531 in 2004 USD adjusted to 2016 USD represents healthcare savings per person per year valued at the mean difference in annual healthcare expenditures between OUD-diagnosed patients enrolled in methadone versus not methadone conducted by Kaiser Permanente Northwest.69 | |
| Value of Wound Care Hospitalization averted | |||
| Baltimore City33 | $15,000 per SSTI hospitalization averted (USD, year unknown)a | Assuming $2,500 per day hospitalized70,71 for 6 days.72–75 | |
| San Francisco32 | $24,000 per SSTI hospitalization averted (USD, year unknown)a | Assuming $4,000 per day hospitalized70,71 for 6 days.72–75 | |
| Seattle31 | $18,568 per hospitalization averted (2016 USD) $6,815 per ED encounter averted (2016 USD) |
$18,568 is the mean cost of hospitalization (including an ED encounter) and $6,815 is the mean cost for an ED encounter for drug-related wounds and infections.76 Proportion of patients with ICD-10 drug-related codes is from unpublished data from local medical centers. | |
| OPC operating cost, $ per year | |||
| Canada | |||
| Vancouver | 1,500,000 (2006 CAD)19 | Annual Insite operation costs for supervised consumption services only77 | |
| 3,000,000 (2008 CAD)26 | Annual Insite operating costs including syringe exchange and supervised consumption services66 | ||
| 2,948,101 (2008 CAD)20 | Annual Insite operating costs based on data provided by the Scientific Evaluation of Supervised Injecting investigators | ||
| 97,203 (2012 CAD)25 | Annual operating cost of existing supervised smoking facility in Vancouver, Canada (50,000 in rent + 47,203 in volunteer stipends) | ||
| Montreal | 2,182,000 (2012 CAD)23 | 1,530,000 per year estimate (Insite property rental, client provisions, staff salaries, and equipment48) adjusted to 2012 CAD and multiplied by 4/3 to account for expanding services from 18-to-24 hours per day. | |
| 1,500,000 + 131 per client (2012 CAD)22 | Used Insite’s $3 million operating cost26 and assumed ratio of fixed to total costs was similar to Sydney, Australia’s OPC64 | ||
| Ottawa | 2,183,000 (2013 CAD)24 | Authors cite Jozaghi et al 2013 SATPPs23 rationale and estimate for Montreal as well as 2008 television interview77 | |
| 1,500,000 + 131 per client (2012 CAD)21 | Used Insite’s $3 million operating cost26 and assumed ratio of fixed to total costs was similar to Sydney, Australia’s OPC64 | ||
| Saskatoon, Saskatchewan22 | 2,182,000 (2013 CAD) | 1,530,000 per year estimate (INSITE property rental, client provisions, staff salaries and equipment)48,78 and other adjustments used in other health economic analyses that have used this estimate | |
| Calgary28 | 3,048,708 (2020 CAD) | Includes costs of administering oxygen, naloxone, nurses’ wages, equipment costs, and emergency medical services for overdoses | |
| Victoria29 | 2,182,000 (2013 CAD) | 1,530,000 per year estimate (Includes the costs of Insite when accounting only for equipment, staff, and property costs)23 and expanded the hours from 18 to 24 | |
| United States | |||
| Baltimore33 | $1,725,252 per year (USD, year unknown) | 4% adjustment to Insite estimate of $1,500,000 to account for Baltimore cost of living. Also includes 1.5 million in start-up costs amortized over 25 years. |
|
| San Francisco32 | $2,575,336 per year (USD, year unknown) | 57% adjustment79 to Insite estimate of $1,500,000 account for San Francisco cost of living as documented by Jozaghi 2015 Also includes 2.0 million in start-up costs amortized over 25 years. |
|
| Seattle31 | 1,222,332 (2016 USD) | Based upon King County internal estimates80 for pilot study including staff salaries, fringe benefits, supplies, training, communications, rent, janitorial services, and indirect rate | |
| Providence34 | $1,602,334 (2020 USD) | Based on upfront loan, operating costs, ambulance run costs, ED visit costs, inpatient hospitalization costs; additionally based on full operating budget of Insite as reported by Institute for Clinical and Economic Review report.42 | |
Note: Insite is the first sanctioned supervised drug injection site in North America that opened in Vancouver, BC in 2003.
Authors assume 2 out of every 3 SSTIs requiring hospitalizations are averted72
AUD = Australian Dollar; CAD = Canadian Dollars; ED = emergency department; EMS = emergency medical services; GDP = gross domestic product; HCV = hepatitis c virus; ICD-10: International Classification of Diseases, Tenth Revision; OUD = opioid use disorder; SSTI = skin and soft tissue infection; USD = United States Dollar
Seven studies included overdose deaths averted as a health outcome.19,29–34 Nine studies reported HIV cases averted annually based on low, base case, and high syringe sharing rates, with half of these studies estimating between 1 and 5 cases averted, and the other half estimating at least 10 cases averted and upwards of 40 (Supplemental Figure 1a). Five studies reported HCV cases averted annually based on low, base case, and high syringe sharing rates, with at least 10 cases averted estimated across all sites with one OPC and upwards of approximately 115 cases averted in the most optimistic scenario (Supplemental Figure 1b).
Summary of OPC Operational Costs
All but one study included the cost of operating an OPC (Table 2). Twelve studies estimated the local cost of an OPC based on the operating budget of the OPC located in Vancouver, Canada,19–24,26,27,29,32–34 with local cost estimates ranging between $1,500,000 (2006 CAD) and $2,575,336 (USD, year unknown). Three studies estimated the local costs of opening a stand-alone OPC for injection drug use ranging between $1,222,332 (2016 USD) and $3,048,708 (2020 CAD); the estimate for a stand-alone OPC for smoking was $97,203 (2012 CAD).25,28,31
Healthcare Costs Avoided
To calculate the monetary impact of establishing or expanding OPCs, all studies included estimates of healthcare costs avoided by the operation of these facilities (Table 2). Nine Canadian and two US studies incorporated savings from HIV infections averted.19–24,26,27,29,32,33 Of the nine Canadian studies, two used the annual cost of HIV treatment per year, $16,947 (2012 CAD),20,21 to estimate the savings per HIV infection avoided, and seven used the lifetime cost of medical care for a person living with HIV.19,22–24,26,27,29 The two US papers used the lifetime cost of HIV treatment in the US.32,33
Eight papers, six from Canada20,21,23–25,29 and two from the US,32,33 considered the savings from averted HCV infections, of which seven estimated the costs averted over a lifetime.21,23–25,29,32,33 One study used $60,000 (2012 CAD)36,37 representing the cost of a pharmaceutical treatment for HCV,21 two studies used the average lifetime cost of medical care of $68,219 (2014 USD) representing the additional healthcare costs for untreated HCV,32,33,38 and four employed the average productivity loss per person with incident HCV of $35,143 (2012 CAD)39 based on an 2008 Australian report.23–25,29 Only two studies explicitly included medication costs in their study, with one including interferon containing regimens,20 and another including direct-acting antivirals.21
Seven studies calculated the savings from each overdose death averted.19,29–34 One study estimated that the value of an overdose death avoided was $660,000 (2006 CAD) based on productivity estimates, and another used the same estimates but in 2013 CAD ($978,924).19,29 Three US studies used the same productivity method,31–33 and estimated savings from each averted overdose death between $503,869 and $1,170,000 (USD). The remaining US study and Canadian study tabulated only the healthcare costs avoided by averting an overdose, resulting in comparatively small values of $3,872 (2016 USD)30 and $1,622 (2020 CAD).28
Three studies from the US incorporated the projected savings from MOUD referrals.31–33 Two of these estimated that society saves $14,000 per person receiving MOUD per year, based on an annual MOUD cost of $4,000.32,33 The third study estimated that the healthcare system saves $14,651 per person per year, which is the previously reported mean difference in annual healthcare expenditures between patients with OUD enrolled in methadone treatment, versus those not enrolled.31
Three US studies included the projected savings to the healthcare system from this reduction in SSTIs due to wound care offered by OPCs.31–33 Two of these studies assumed that 67% of SSTI hospitalizations would be averted among OPC clients. All three estimated savings between $15,000 USD33 and $25,000 USD32 per hospitalization averted.31–33
Economic Outcomes
Cost-Benefit Results
Ten papers published cost-benefit ratios associated with the operation of one or more OPCs.19,22–25,27,29,31–33 Three of these focused on extant OPCs in Vancouver.19,25,27 Cost-benefit ratios ranged between 2.32 and 5.12 for one OPC,19,27 and between 1.07 to 5.90 for seven OPCs.25,27
Four studies examined cost-benefit ratios for hypothetical OPCs in Saskatchewan, Ottawa, Montreal, and Victoria.22–24,29 The cost-benefit ratios were similar across these cities, ranging from 1.26 to 1.40 for one OPC. For implementing multiple OPCs, these studies generated cost-benefit ratios >1 for up to two OPCs in Ottawa,27 three OPCs in Montreal,23 and four OPCs in Saskatchewan.22
Three papers reported cost-benefit ratios in US cities.31–33 Implementing one OPC was reported to have an estimated cost-benefit ratio of 2.33 in San Francisco,32 4.35 in Baltimore,33 and 4.22 in Seattle.31 Hood et al.31 also found that if overdose rates continued to trend upward, the cost-benefit ratio for one OPC in Seattle would increase to 7.70.
Cost-Effectiveness Results
Eight studies, all Canadian, published cost-effectiveness results.19–25,29 Five studies reported the cost per HIV infection averted19,22–24,29 and four reported the cost per HCV infection averted.23–25,29 The cost per HIV infection averted for one OPC ranged from $26,316 to $784,447 (2006 CAD)19 in Vancouver and $436,560 (2013 CAD)24 in Ottawa. The cost per HCV infection averted for one OPC ranged from $1,705 (2006 CAD)25 in Vancouver, to $45,475 in Ottawa.24 Both HIV and HCV cost-effectiveness ratios increased when more OPCs were considered, reflecting smaller incremental gains as more OPCs were added in the same city.
Two papers reported cost-effectiveness results in terms of life-years or QALYs gained. One paper20 evaluating a Vacouver OPC analyzed the cost per life-year gained over 10 years and found that implementing one OPC dominates (i.e., has a lower cost and results in more life years gained) compared to having no OPC. The other paper21 reported the cost per QALY gained over 20 years by establishing one or more OPCs in two Canadian cities, and found that up to three OPCs in Toronto and up to two OPCs in Ottawa had an incremental cost-effectiveness ratio (ICER) of less than $50,000 (2012 CAD) per QALY gained, and up to five OPCs in Toronto and up to three OPCs in Ottawa had an ICER of less than $100,000 (2012 CAD) per QALY gained.
Cost-Offset Results
Three studies, two based in Canada26,28 and one based in the US,30 presented cost-offset results. One Canadian paper26 evaluated a Vancouver OPC and found that the $3 million (2008 CAD) facility annual operating costs would be offset by $17·6 million (2008 CAD) in lifetime HIV treatment savings. Another Canadian paper28 reported that the OPC in Calgary produced $2,364,876 (2020 CAD) in savings over 27 months by avoiding the need for ambulance and emergency department services. The US paper30 reported $831,700 in annual averted costs to the New York City healthcare system if one OPC was implemented, and $2,945,000 (2016 USD) if four OPCs were implemented, but did not include OPC costs in the offset estimates.
Limitations
The main limitations that were identified by the studies focus on model limitations, with a majority of studies noting a likely underestimation of benefits related to not being able to include all potential health and social benefits of the OPC.19–30,33,34 Several studies also indicated the limitations of using a mathematical modeling approach, including the short time horizon.19,22,26,27,29,34 Mathematical models also limit the ability to estimate long term benefits from HIV and HCV prevention efforts in preventing secondary infections and improved quality of life over time.20,22,24,26,29,34 Finally, several studies indicated that a major limitation was not being able to use local or recent data for all the inputs.19–21,25,26,30–33
DISCUSSION
We identified 16 articles published from 2007 to 2022 that reported economic evaluations of OPCs in North American cities. The studies used a variety of modeling techniques to project economic outcomes; all but one had good quality ratings using the Drummond checklist, and most had complete reporting using the CHEERS checklist. Three studies estimated economic and health outcomes for an existing OPC,19,20,28 while the remainder projected the potential impact of implementing one or more new OPCs.21–27,29–34 Regardless of economic analysis performed (cost-benefit, cost-effectiveness, or cost-offset analysis) or the health outcomes considered (HIV, HCV, overdose fatalities, or SSTIs prevented; MOUD initiations; life years or QALYs saved), all studies estimated considerable financial and health benefits of opening one or more OPCs. For cost-effectiveness studies that reported QALYs saved, the estimated incremental cost-effectiveness ratios for various health outcomes were under $50,000 and $100,000 per QALY, the willingness to pay thresholds often cited in Canada and the US.19–25 Cost-benefit studies all reported ratios that were greater than one (range = 1.26 to 20.6). Finally, cost-offset studies estimated between $831,700 (2016 USD) and $2,945,000 (2016 USD) of annual cost offsets to the healthcare system after implementing one OPC.26,30
We identified substantial economic and health benefits in these studies, but this literature has important gaps. The studies identified in this review predominantly used data from one OPC in Vancouver, which was identified as a limitation by several studies. Given that there are now over 30 OPCs operating in Canada and two legally sanctioned OPCs in the US, data from other OPCs can provide insights for a variety of operating and substance use environments. For example, they could help distinguish between the operating costs of an OPC opening in a new location versus one that opens within as existing space, such as a harm reduction program. To simulate the impact of different environments, Chambers et al.34 provide an online tool that allows end-users to adjust the reported results to their own local environment based on city characteristics, HIV/HCV infection reduction metrics, population parameters, infection treatment costs, and MOUD utilization by OPC clients. The tool also considers differences in annual costs of stand-alone OPCs versus OPCs implemented alongside syringe service programs. Obtaining data that reflects local conditions for study parameters, as well as for sensitivity analyses, would allow results to be better tailored to each jurisdiction. Although most studies conducted sensitivity analyses to examine the impact of different syringe sharing rates and facility costs, other inputs were not typically varied. For decision makers, understanding what OPC models might be most effective in their local communities, taking into consideration local drug use dynamics and the OPC models they are able to feasibly implement, would help guide adoption and future implementation. For example, one study had found that given the geographical spread of opioid overdose fatalities in NYC, multiple OPCs would need to be implemented to make a considerable impact on reducing opioid overdose fatality rates compared to other cities with more concentrated drug use in one area.30 Nearly all studies utilized decision analytic modeling, with most relying on decision tree-type mathematical modeling, and only two employing dynamic compartmental modeling.20,21 There were substantial similarities in mathematical modeling approaches reflecting overlaps in authorship. A greater diversity of modeling approaches and greater use of more advanced modeling methods, such as dynamic compartmental modeling, could provide a more nuanced understanding of the factors that impact economic and health outcomes from OPC implementation. Dynamic compartmental modeling approaches often measure long-term benefits, such as improvements in quality of life over time, unlike the mathematical studies included here that predominantly accounted for only one year time horizons. Comparing a variety of modeling approaches could also identify results that are most sensitive to each model’s structure and assumptions.40
The majority of the studies were from Canada and published between 2008 and 2015 with a primary focus on HIV or HCV health outcomes. While this work demonstrated the potential impact of OPCs on HIV and HCV outcomes at that time, many of these findings are now outdated in that they either did not include medication costs for HCV or included older medication regimens, such as interferon-based medications for HCV, that had substantially different treatment cure rates and costs than current treatment regimens. Moreover, the increase in opioid overdose fatality rates among people who inject opioids since that time has been unprecendented, whereas the risks of HIV infection among people who inject drugs have declined over this time.41 The recent studies from 2016 to 2022 (5 from the US and 1 from Canada) modeled a wider breadth of health outcomes, such as SSTIs avoided, but these studies did not have the opportunity to incorporate either the steep upward trend of opioid-related mortality as a result of fentanyl entering into the drug market or the subsequent impacts of the COVID-19 pandemic. Given these changes, we need new studies that consider the full economic benefits of existing OPCs across a range of contemporary health care utilization and health outcome scenarios to provide more current information on how this may impact the magnitude of costs and effects.
Our study and results are subject to several limitations. The language used to describe overdose prevention centers is rapidly evolving and it is possible we may have failed to identify relevant articles. We limited our search to the peer-reviewed published literature and did not include reports not published in peer-reviewed journals (e.g., a report published by the Institute for Clinical and Economic Review42). Because of the stark differences between the U.S. and Canadian health systems, results are not easily compared between these countries. For instance, Canada’s universal health system enables all Canadian citizens access to care, which would increase overall healthcare utilization in comparison to the U.S’s multi-payer system that results in barriers to healthcare access for some people. It is also important to note that our systematic review did not uncover studies conducted in Mexico, which may have been limited by our search criteria of only including English language studies. We used the CHEERS checklist to evaluate study reporting, as suggested by the Second Panel on Cost-effectiveness in Health and Medicine, but acknowledge that most studies were published prior to the release of these guidelines.
CONCLUSION
This systematic review found that the implementation of OPCs is consistently projected to result in greater benefits than costs or to be cost-effective. Future studies should incorporate the experience of OPCs established in various settings, employ a greater diversity of modeling designs, and consider both overdose and infectious disease prevention outcomes. However, taken together, these studies make a compelling economic case for the public health benefits of OPCs.
Supplementary Material
Acknowledgments
The authors gratefully acknowledge the institutional librarian for assistance with developing database search strategies.
This research was supported by the NIH. The content of this article is solely the responsibility of the authors and does not necessarily represent the official views of the funding agencies or the U.S. government.
Footnotes
Declarations of interest
Author 9 reports providing consultation to Sandoz INC. outside the submitted work.
Clinical trial registration
Not applicable.
Human Participant Protection
This systematic review was limited to published research and did not involve human participants and as such, human participant protection was not required.
Compliance with Ethical Standards
Not applicable.
REFERENCES
- 1.Ahmad FB CJ, Rossen LM, Sutton P. Provisional drug overdose death counts. Accessed October 24, 2023. https://www.cdc.gov/nchs/nvss/vsrr/drug-overdose-data.htm
- 2.Razaghizad A, Windle SB, Filion KB, et al. The Effect of Overdose Education and Naloxone Distribution: An Umbrella Review of Systematic Reviews. Am J Public Health. 2021;111(8):1516–1517. [DOI] [PMC free article] [PubMed] [Google Scholar]
- 3.Amaducci A, Aldy K, Campleman SL, et al. Naloxone Use in Novel Potent Opioid and Fentanyl Overdoses in Emergency Department Patients. JAMA Netw Open. 2023;6(8):e2331264. [DOI] [PMC free article] [PubMed] [Google Scholar]
- 4.Barry CL, Sherman SG, McGinty EE. Language Matters in Combatting the Opioid Epidemic: Safe Consumption Sites Versus Overdose Prevention Sites. Am J Public Health. 2018;108(9):1157–1159. [DOI] [PMC free article] [PubMed] [Google Scholar]
- 5.Potier C, Laprevote V, Dubois-Arber F, Cottencin O, Rolland B. Supervised injection services: what has been demonstrated? A systematic literature review. Drug Alcohol Depend. 2014;145:48–68. [DOI] [PubMed] [Google Scholar]
- 6.Houborg E, Jauffret-Roustide M. Drug Consumption Rooms: Welfare State and Diversity in Social Acceptance in Denmark and in France. Am J Public Health. 2022;112(S2):S159–S165. [DOI] [PMC free article] [PubMed] [Google Scholar]
- 7.Marshall BD, Milloy MJ, Wood E, Montaner JS, Kerr T. Reduction in overdose mortality after the opening of North America’s first medically supervised safer injecting facility: a retrospective population-based study. Lancet. 2011;377(9775):1429–1437. [DOI] [PubMed] [Google Scholar]
- 8.A review of structural, process, and outcome measures for supervised consumption services. Accessed October 24, 2023. https://www.ohtn.on.ca/rapid-response-a-review-of-structural-process-and-outcome-measures-for-supervised-consumption-services/#:~:text=The%20first%20legally%20sanctioned%20supervised,hold%20valid%20exemptions%20(15).
- 9.Kerr T, Mitra S, Kennedy MC, McNeil R. Supervised injection facilities in Canada: past, present, and future. Harm Reduct J. 2017;14(1):28. [DOI] [PMC free article] [PubMed] [Google Scholar]
- 10.Harocopos A, Gibson BE, Saha N, et al. First 2 Months of Operation at First Publicly Recognized Overdose Prevention Centers in US. JAMA Netw Open. 2022;5(7):e2222149. [DOI] [PMC free article] [PubMed] [Google Scholar]
- 11.Rhode Island’s Harm Reduction Center Pilot Program. Accessed October 24, 2023. https://health.ri.gov/publications/factsheets/Harm-Reduction-Center-Pilot-Program.pdf [Google Scholar]
- 12.Moher D, Liberati A, Tetzlaff J, Altman DG. Preferred reporting items for systematic reviews and meta-analyses: the PRISMA statement. PLoS Med. 2009;6(7):e1000097. [DOI] [PMC free article] [PubMed] [Google Scholar]
- 13.Page MJ, McKenzie JE, Bossuyt PM, et al. The PRISMA 2020 statement: An updated guideline for reporting systematic reviews. J Clin Epidemiol. 2021;134:178–189. [DOI] [PubMed] [Google Scholar]
- 14.Kuntz K, Sainfort F, Butler M, et al. Decision and Simulation Modeling in Systematic Reviews. 2013. Report No.: 11(13)-EHC037–EF. Accessed October 24, 2023. https://www.ncbi.nlm.nih.gov/pubmed/23534078 [PubMed] [Google Scholar]
- 15.Husereau D, Drummond M, Petrou S, et al. Consolidated Health Economic Evaluation Reporting Standards (CHEERS)--explanation and elaboration: a report of the ISPOR Health Economic Evaluation Publication Guidelines Good Reporting Practices Task Force. Value Health. 2013;16(2):231–250. [DOI] [PubMed] [Google Scholar]
- 16.Neumann PJ, Sanders GD, Russell LB, Siegel JE, Ganiats TG. Cost-effectiveness in Health and Medicine. New York. Oxford University Press; 2016. [Google Scholar]
- 17.Drummond MF, Sculpher MJ, Claxton K, Stoddart GL, Torrance GW. Methods for the Economic Evaluation of Health Care Programmes. New York, NY. Oxford University Press; 2015. [Google Scholar]
- 18.Doran CM. Economic evaluation of interventions to treat opiate dependence. Pharmacoeconomics. 2008;26(5):371–393. [DOI] [PubMed] [Google Scholar]
- 19.Andresen MA, Boyd N. A cost-benefit and cost-effectiveness analysis of Vancouver’s supervised injection facility. Int J Drug Policy. 2010;21(1):70–76. [DOI] [PubMed] [Google Scholar]
- 20.Bayoumi AM, Zaric GS. The cost-effectiveness of Vancouver’s supervised injection facility. Cmaj. 2008;179(11):1143–1151. [DOI] [PMC free article] [PubMed] [Google Scholar]
- 21.Enns EA, Zaric GS, Strike CJ, Jairam JA, Kolla G, Bayoumi AM. Potential cost-effectiveness of supervised injection facilities in Toronto and Ottawa, Canada. Addiction. 2016;111(3):475–489. [DOI] [PubMed] [Google Scholar]
- 22.Jozaghi E, Jackson A. Examining the potential role of a supervised injection facility in Saskatoon, Saskatchewan, to avert HIV among people who inject drugs. Int J Health Policy Manag. 2015;4(6):373–379. [DOI] [PMC free article] [PubMed] [Google Scholar]
- 23.Jozaghi E, Reid AA, Andresen MA. A cost-benefit/cost-effectiveness analysis of proposed supervised injection facilities in Montreal, Canada. Subst Abuse Treat Prev Policy. 2013;8:25. [DOI] [PMC free article] [PubMed] [Google Scholar]
- 24.Jozaghi E, Reid AA, Andresen MA, Juneau A. A cost-benefit/cost-effectiveness analysis of proposed supervised injection facilities in Ottawa, Canada. Subst Abuse Treat Prev Policy. 2014;9:31. [DOI] [PMC free article] [PubMed] [Google Scholar]
- 25.Jozaghi E A cost-benefit/cost-effectiveness analysis of an unsanctioned supervised smoking facility in the Downtown Eastside of Vancouver, Canada. Harm Reduct J. 2014;11(1):30. [DOI] [PMC free article] [PubMed] [Google Scholar]
- 26.Pinkerton SD. Is Vancouver Canada’s supervised injection facility cost-saving? Addiction. 2010;105(8):1429–1436. [DOI] [PubMed] [Google Scholar]
- 27.Andresen MA, Jozaghi E. The Point of Diminishing Returns: An Examination of Expanding Vancouver’s Insite. Urban Studies. 2012;49(16):3531–3544. [Google Scholar]
- 28.Khair S, Eastwood CA, Lu M, Jackson J. Supervised consumption site enables cost savings by avoiding emergency services: a cost analysis study. Harm Reduct J. 2022;19(1):32. [DOI] [PMC free article] [PubMed] [Google Scholar]
- 29.Jozaghi E, Hodgkinson T, Andresen MA. Is there a role for potential supervised injection facilities in Victoria, British Columbia, Canada? Article. Urban Geography. 2015;36(8):1241–1255. [Google Scholar]
- 30.Behrends CN, Paone D, Nolan ML, et al. Estimated impact of supervised injection facilities on overdose fatalities and healthcare costs in New York City. J Subst Abuse Treat. 2019;106:79–88. [DOI] [PubMed] [Google Scholar]
- 31.Hood JE, Behrends CN, Irwin A, et al. The projected costs and benefits of a supervised injection facility in Seattle, WA, USA. Int J Drug Policy. 2019;67:9–18. [DOI] [PubMed] [Google Scholar]
- 32.Irwin A, Jozaghi E, Bluthenthal RN, Kral AH. A cost-benefit analysis of a potential supervised injection facility in San Francisco, California, USA. Journal of Drug Issues. 2017;47(2):164–184. [Google Scholar]
- 33.Irwin A, Jozaghi E, Weir BW, Allen ST, Lindsay A, Sherman SG. Mitigating the heroin crisis in Baltimore, MD, USA: a cost-benefit analysis of a hypothetical supervised injection facility. Harm Reduct J. 2017;14(1):29. [DOI] [PMC free article] [PubMed] [Google Scholar]
- 34.Chambers LC, Hallowell BD, Zang X, et al. The estimated costs and benefits of a hypothetical supervised consumption site in Providence, Rhode Island. Int J Drug Policy. 2022;108:103820. [DOI] [PMC free article] [PubMed] [Google Scholar]
- 35.Gold MR, Siegel JE, Russell LB. Cost-effectiveness in Health and Medicine. New York. Oxford University Press; 1996. [Google Scholar]
- 36.Ferguson R Ontario urged to provide better access to breakthrough hepatitis C drugs. Accessed October 24, 2023. https://www.thestar.com/news/canada/2015/06/20/ontario-urged-to-provide-better-access-to-breakthrough-hepatitis-c-drugs.html
- 37.Canadian Agency for Drug and Technologies in Health. Summary Report: Drugs for Chronic Hepatitis C Infection. Accessed October 24, 2023. https://www.cadth.ca/sites/default/files/pdf/TR0008_Summary_e.pdf
- 38.Razavi H, ElKhoury AC, Elbasha E, et al. Chronic hepatitis C virus (HCV) disease burden and cost in the United States. Hepatology. 2013;57(6):2164–2170. [DOI] [PMC free article] [PubMed] [Google Scholar]
- 39.National Centre in HIV Epidemiology and Clinical Research. Epidemiological and economical impact of potential increased hepatitis C treatment uptake in Australia Accessed October 24, 2023. http://optimamodel.com/pubs/hcv%202010.pdf
- 40.McMahon PM, Hazelton WD, Kimmel M, Clarke LD. Chapter 13: CISNET lung models: comparison of model assumptions and model structures. Risk Anal. 2012;32 Suppl 1(Suppl 1):S166–178. [DOI] [PMC free article] [PubMed] [Google Scholar]
- 41.Green TC, McGowan SK, Yokell MA, Pouget ER, Rich JD. HIV infection and risk of overdose: a systematic review and meta-analysis. AIDS. 2012;26(4):403–417. [DOI] [PMC free article] [PubMed] [Google Scholar]
- 42.Armbrecht E GG, Hansen R, Pandey R, Fazioli K, Chapman R, Pearson SD, Rind DM. Supervised Injection Facilities and Other Supervised Consumption Sites: Effectiveness and Value; Evidence Report. Institute for Clinical and Economic Review. Accessed October 24, 2023. https://icer-review.org/material/supervised-injection-facilities-evidence-report/ [Google Scholar]
- 43.Holtgrave DR, Pinkerton SD. Updates of cost of illness and quality of life estimates for use in economic evaluations of HIV prevention programs. J Acquir Immune Defic Syndr Hum Retrovirol. 1997;16(1):54–62. [DOI] [PubMed] [Google Scholar]
- 44.Jacobs P, Calder P, Taylor M, Houston S, Saunders LD, Albert T. Cost effectiveness of Streetworks’ needle exchange program of Edmonton. Can J Public Health. 1999;90(3):168–171. [DOI] [PMC free article] [PubMed] [Google Scholar]
- 45.Gold M, Gafni A, Nelligan P, Millson P. Needle exchange programs: an economic evaluation of a local experience. Cmaj. 1997;157(3):255–262. [PMC free article] [PubMed] [Google Scholar]
- 46.Krentz HB, Auld MC, Gill MJ, Group HIVES. The changing direct costs of medical care for patients with HIV/AIDS, 1995–2001. Cmaj. 2003;169(2):106–110. [PMC free article] [PubMed] [Google Scholar]
- 47.Albert T, Williams GT, Legowski B, Remis R. The Economic Burden of HIV/AIDS in Canada. Ottawa. Canadian Policy Research Networks; Ottawa; 1998. [Google Scholar]
- 48.O’Neil P Vancouver’s supervised injection site will survive new federal rules, supporter say. Vancouver Sun. Accessed October 24, 2023. http://www.vancouversun.com/health/Vancouver+supervised+injection+site+will+survive+federal/8488985/story.html [Google Scholar]
- 49.Pinkerton SD. How many HIV infections are prevented by Vancouver Canada’s supervised injection facility? International Journal of Drug Policy. 2011;22(3):179–183. [DOI] [PubMed] [Google Scholar]
- 50.Centers for Disease Control and Prevention. HIV/AIDS, viral hepatitis, sexually transmitted infections, & tuberculosis (FY 2016 President’s Budget Request). Accessed October 24, 2023. https://www.cdc.gov/nchhstp/dear_colleague/2015/dcl-020415-2016-presidents-budget.html [Google Scholar]
- 51.Farnham PG, Gopalappa C, Sansom SL, et al. Updates of lifetime costs of care and quality-of-life estimates for HIV-infected persons in the United States: late versus early diagnosis and entry into care. J Acquir Immune Defic Syndr. 2013;64(2):183–189. [DOI] [PubMed] [Google Scholar]
- 52.Krahn MD, John-Baptiste A, Yi Q, et al. Potential cost-effectiveness of a preventive hepatitis C vaccine in high risk and average risk populations in Canada. Vaccine. 2005;23(13):1549–1558. [DOI] [PubMed] [Google Scholar]
- 53.Kerr T, Stoltz J-A, Tyndall M, et al. Impact of a medically supervised safer injection facility on community drug use patterns: a before and after study. Bmj. 2006;332(7535):220–222. [DOI] [PMC free article] [PubMed] [Google Scholar]
- 54.Genberg BL, Gange SJ, Go VF, Celentano DD, Kirk GD, Mehta SH. Trajectories of injection drug use over 20 years (1988–2008) in Baltimore, Maryland. American Journal of Epidemiology. 2011;173(7):829–836. [DOI] [PMC free article] [PubMed] [Google Scholar]
- 55.Census Bureau. Quickfacts for Baltimore City, Maryland. Accessed October 24, 2023. http://www.census.gov/quickfacts/table/RHI805210/24510
- 56.Wright S Memorandum Report: Utilization of Medicare Ambulance Transports, 2002–2011. Accessed October 24, 2023. https://oig.hhs.gov/oei/reports/oei-09-12-00350.pdf [Google Scholar]
- 57.Centers for Medicare and Medicaid Services. Ambulance Fee Schedule. Accessed October 24, 2023. https://www.cms.gov/Medicare/Medicare-Fee-for-Service-Payment/AmbulanceFeeSchedule/index.html
- 58.Agency for Healthcare Research and Quality. Medical Expenditure Panel Survey. Accessed October 24, 2023. https://meps.ahrq.gov/mepsweb/index.jsp [PubMed]
- 59.New York State Department of Health. Statewide Planning and Research Cooperative System (SPARCS). Accessed October 24, 2023. https://www.health.ny.gov/statistics/sparcs/
- 60.Department of Commerce. Personal income summary: Personal income, population, per capita personal income, King County. Accessed October 24, 2023. https://www.bea.gov/itable
- 61.Arias E, Heron M, & Xu J. United States life tables. National vital statistics reports. Accessed October 24, 2023. https://www.cdc.gov/nchs/data/nvsr/nvsr66/nvsr66_04.pdf [PubMed] [Google Scholar]
- 62.Mathers BM, Degenhardt L, Bucello C, Lemon J, Wiessing L, Hickman M. Mortality among people who inject drugs: a systematic review and meta-analysis. Bulletin of the World Health Organization. 2013;91:102–123. [DOI] [PMC free article] [PubMed] [Google Scholar]
- 63.Schwartz RP, Alexandre PK, Kelly SM, O’Grady KE, Gryczynski J, Jaffe JH. Interim versus standard methadone treatment: a benefit–cost analysis. Journal of substance abuse treatment. 2014;46(3):306–314. [DOI] [PMC free article] [PubMed] [Google Scholar]
- 64.Committee ME. Final report of the evaluation of the Sydney Medically Supervised Injecting Centre. 2003. Accessed October 24, 2023. https://www.drugsandalcohol.ie/5706/1/MSIC_final_evaluation_report.pdf
- 65.Cartwright WS. Cost–benefit analysis of drug treatment services: review of the literature. The journal of mental health policy and economics. 2000;3(1):11–26. [DOI] [PubMed] [Google Scholar]
- 66.Health Canada. Vancouver’s INSITE Service and Other Supervised Injection Sites: What Has Been Learned from Research? - Final Report of the Expert Advisory Committee on Supervised Injection Site Research. Accessed October 24, 2023. https://www.canada.ca/en/health-canada/corporate/about-health-canada/reports-publications/vancouver-insite-service-other-supervised-injection-sites-what-been-learned-research.html
- 67.Harris AH, Gospodarevskaya E, Ritter AJ. A randomised trial of the cost effectiveness of buprenorphine as an alternative to methadone maintenance treatment for heroin dependence in a primary care setting. Pharmacoeconomics. 2005;23(1):77–91. [DOI] [PubMed] [Google Scholar]
- 68.Center for Health Program Development and Management. Review of cost-benefit and cost-effectiveness literature for methadone or buprenorphine as a treatment for opiate addiction. Accessed October 24, 2023. http://www.hilltopinstitute.org/publications/Cost_benefit_Opiate_Addiction_August_29_2007.pdf
- 69.McCarty D, Perrin NA, Green CA, Polen MR, Leo MC, Lynch F. Methadone maintenance and the cost and utilization of health care among individuals dependent on opioids in a commercial health plan. Drug and alcohol dependence. 2010;111(3):235–240. [DOI] [PMC free article] [PubMed] [Google Scholar]
- 70.Rosenthal E As hospital prices soar, a stitch tops $500. Accessed October 24, 2023. https://www.nytimes.com/2013/12/03/health/as-hospital-costs-soar-single-stitch-tops-500.html
- 71.Harris HW, Young DM. Care of injection drug users with soft tissue infections in San Francisco, California. Archives of Surgery. 2002;137(11):1217–1222. [DOI] [PubMed] [Google Scholar]
- 72.Lloyd-Smith E, Wood E, Zhang R, et al. Determinants of hospitalization for a cutaneous injection-related infection among injection drug users: a cohort study. BMC Public Health. 2010;10(1):327. [DOI] [PMC free article] [PubMed] [Google Scholar]
- 73.Stein MD, Sobota M. Injection drug users: hospital care and charges. Drug and alcohol dependence. 2001;64(1):117–120. [DOI] [PubMed] [Google Scholar]
- 74.Palepu A, Tyndall MW, Leon H, et al. Hospital utilization and costs in a cohort of injection drug users. Cmaj. 2001;165(4):415–420. [PMC free article] [PubMed] [Google Scholar]
- 75.Hsieh Y-H. Personal correspondence of Dr. Yu-Hsiang Hsieh, Johns Hopkins Department of Emergency Medicine, with Andrew Lindsay. [Google Scholar]
- 76.Washington Department of Health. Charity Care in Washington Hospitals. Accessed October 24, 2023. https://www.doh.wa.gov/Portals/1/Documents/2300/HospPatientData/2015CharityCareReport.pdf
- 77.CTV News. Experts table findings on drug-injection site. Accessed October 24, 2023. https://www.ctvnews.ca/experts-table-findings-on-drug-injection-site-1.288775 [Google Scholar]
- 78.Warren J Fewer needles found during annual cleanup. The Star Phoenix. Accessed October 24, 2023. https://thestarphoenix.com/news/local-news/500-needles-2 [Google Scholar]
- 79.Expatistan Cost of Living Index. Cost of living comparison between San Francisco, California, United States and Vancouver, British Columbia, Canada. Accessed October 24, 2023. https://www.expatistan.com/cost-of-living/comparison/vancouver/san-francisco
- 80.Office of Financial Management. Official Population Estimates. Accessed October 24, 2023. https://www.ofm.wa.gov/washington-data-research/population-demographics/population-estimates/april-1-official-population-estimates
Associated Data
This section collects any data citations, data availability statements, or supplementary materials included in this article.