Abstract
Four genomic DNAs of differing GC content (Micrococcus luteus, 72% GC; Escherichia coli, 50% GC; calf thymus, 42% GC; Clostridium perfringens, 27% GC) have been employed as targets of interaction by the cationic polyamines spermidine {[H3N(CH2)3NH2(CH2)4NH3]3+} and spermine {[(CH2)4(NH2(CH2)3NH3)2]4+}. In solutions containing 60 mM DNA phosphate (~20 mg DNA/ml) and either 1, 5 or 60 mM polyamine, only Raman bands associated with the phosphates exhibit large spectral changes, demonstrating that B-DNA phosphates are the primary targets of interaction. Phosphate perturbations, which are independent of base composition, are consistent with a model of non-specific cation binding in which delocalized polyamines diffuse along DNA while confined by the strong electrostatic potential gradient perpendicular to the helix axis. This finding provides experimental support for models in which polyamine-induced DNA condensation is driven by non-specific electrostatic binding. The Raman spectra also demonstrate that major groove sites (guanine N7 and thymine C5H3) are less affected than phosphates by polyamine–DNA interactions. Modest dependence of polyamine binding on genome base composition suggests that sequence context plays only a secondary role in recognition. Importantly, the results demonstrate that polyamine binding has a negligible effect on the native B-form secondary structure. The capability of spermidine or spermine to bind and condense genomic B-DNA without disrupting the native structure must be taken into account when considering DNA organization within bacterial nucleoids or cell nuclei.
INTRODUCTION
Linear multivalent polyamines such as spermidine {[H3N(CH2)3NH2(CH2)4NH3]3+} (Spd) and spermine {[(CH2)4(NH2(CH2)3NH3)2]4+} (Spm) are abundant in living cells (1,2) and play a key role in maintaining cellular DNA in a compact state. Polyamines also facilitate the packaging of double-stranded DNA in certain viruses (3). Depletion of polyamine levels in vivo inhibits cell growth and interferes with gene expression (2,4). The molecular mechanism of polyamine function in DNA condensation is presumed to involve neutralization of the negatively charged DNA backbone by the positively charged amino groups of Spd and Spm (5–7). Both polyamine-induced DNA charge stabilization and macromolecular condensation are also considered essential for the cellular uptake of DNA in gene therapeutic applications (8,9).
Solution studies of the binding of polyamines to B-DNA by equilibrium dialysis (10–12), calorimetry (13) and NMR measurements on 23Na (14–16), 14N (16) and 1H nuclei (17) imply a binding model characterized by non-specific interactions between polyamines and DNA. The experimental results are supported by polyelectrolyte and counterion condensation theories (18–21) in which non-specific electrostatic interactions between the DNA phosphates and cationic polyamines hold the cations in a thin, condensed layer near the DNA surface. In contrast, X-ray crystallographic analyses indicate that polyamines occupy specific sites on non-B-DNA crystal structures, including A-DNA (22–24), Z-DNA (25) and tRNA (26). However, the oligodeoxyribonucleotides employed in crystal structure analyses are usually rich in GC, which may tend to bias crystallization toward either the A or Z conformation. The high affinity of polyamines toward non-B-DNA forms suggests that both secondary structure and base composition may be determinants in polyamine recognition. This is consistent with NMR solution studies indicating that hexammine cobalt(III) binds preferentially to GC-rich DNA (27) and may help to promote the B→A secondary structure transformation (28).
Raman spectroscopy is a versatile technique for investigating nucleic acid structure perturbations in both the solution and condensed states (29). Specific Raman ‘marker’ bands undergo measurable displacements in wavenumber and/or intensity, depending upon the sites altered by complexing agents, temperature changes or other perturbing factors (30). Even changes affecting a relatively small percentage (∼1–2%) of the nucleotides of genomic B-DNA can be identified under favorable conditions (31,32). In recent Raman applications we have characterized interactions of genomic DNA with divalent metal cations (33,34), determined thermodynamic parameters governing denaturation (35) and probed sequence-related structural differences among several genomic DNA species (36). Here we extend the earlier studies to probe base composition dependence of interactions of the polyamines Spd and Spm with four genomic DNAs: Micrococcus luteus (ML, 72% GC), Escherichia coli (EC, 50% GC), calf thymus (CT, 42% GC) and Clostridium perfringens (CP, 27% GC). Raman spectroscopic assignments and structural interpretations for these genomic DNAs in the absence of polyamines have been reported previously (36).
Raman data were collected on aqueous DNA (∼20 mg/ml, pH 7) for polyamine:phosphate molar ratios of 1:60, 1:12 and 1:1. At the two lower polyamine densities each genomic DNA remained in solution, whereas at the highest density the complex precipitated and was examined as a precipitate suspended in supernatant. The Raman spectra reveal the nature of interactions of Spd and Spm with each genomic DNA at each binding density. The results provide new insights into the molecular mechanism of polyamine–DNA recognition and its potential biological significance.
MATERIALS AND METHODS
Sample preparation
Stock solutions containing 100 mM Spd or Spm in deionized water were prepared from chloride salts of the polyamines (Sigma, St Louis, MO) and were adjusted to pH 6.5 ± 0.2 with HCl or NaOH. High molecular weight CT DNA and bacterial DNAs (ML, EC and CP) were obtained from Amersham Pharmacia Biotech (Little Chalfont, UK). Each DNA was purified by phenol extraction, precipitated with ethanol, dialyzed serially against NaCl solutions (1 M, 10 mM and 1 mM) and deionized water and prepared as a stock solution containing ∼1 mg DNA/ml at pH 7.5. Further details of DNA sample preparations have been described (34,35). Reagent grade NaCl was obtained from Mallinkrodt (Hazelwood, MO).
Aliquots of DNA stock solutions were lyophilized and the DNA lyophilisates were redissolved in the appropriate volume of polyamine stock solution to yield a final DNA concentration of ∼20 mg/ml (∼60 mM in DNA phosphate) and a final polyamine concentration of either 1, 5 or 60 mM at pH 7.0 ± 0.4. The resulting polyamine/DNA mixtures thus contained 1:60, 1:12 or 1:1 molar ratios of polyamine:DNA (phosphate). An aliquot (∼7 µl) of each solution mixture was sealed in a Kimax 34502 capillary tube for Raman analysis. At the highest polyamine:DNA ratio (1:1), the complex invariably precipitated and its Raman spectrum was collected as a precipitate suspended in supernatant.
Raman spectroscopy
Raman spectra were excited with the 514.5 nm line of an argon laser (Coherent Innova 70; Santa Clara, CA) and were collected on a single spectrograph (SPEX Model 500M; ISA, Edison, NJ) consisting of a holographic notch filter, 0.5 m spectrograph and liquid nitrogen cooled, back-thinned, charge coupled device detector (Spectrum One; SPEX, Edison, NJ). The effective spectral resolution of this instrumentation is 3 cm–1. Additional details have been described (37). All samples were maintained at room temperature (21°C). The reported DNA Raman frequencies, accurate to ±1 cm–1, were calibrated using the 459.5 cm–1 band of CCl4 and the vibrational spectrum of liquid toluene. Spectra shown below are the accumulated averages of 25–30 exposures of 20 s each.
RESULTS
Raman characteristics of polyamine–DNA complexes
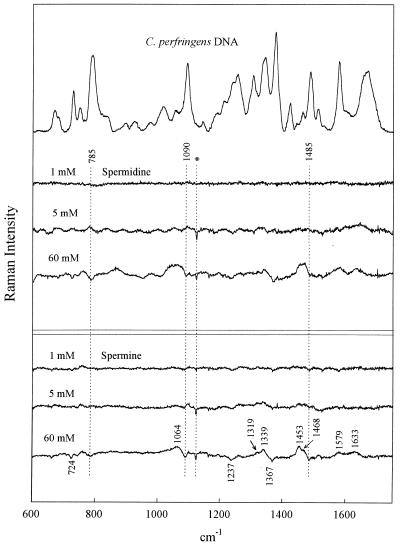
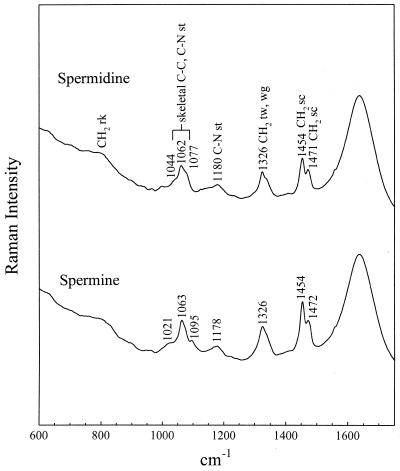
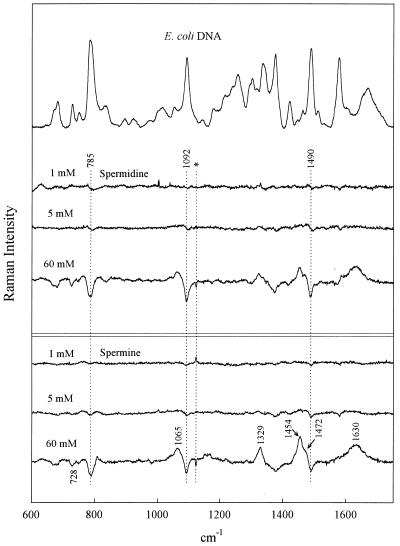
The Raman spectrum of CP DNA (27% GC) in the absence of polyamines is shown in the top trace of Figure 1. The second, third and fourth traces of Figure 1 show the difference spectra obtained by subtracting the Raman spectrum of polyamine-free CP DNA (top trace) from those of the complexes formed by this DNA in the presence of 1, 5 and 60 mM concentrations of Spd, respectively. Difference spectra for corresponding Spm complexes of CP DNA are shown in the bottom three traces of Figure 1. In the computation of all difference spectra, the minuend (polyamine–DNA complex) and subtrahend (free DNA) were normalized using the following constraints: (i) contributions from DNA at 1420 cm–1 (band assigned to a localized vibration of the deoxyribosyl C5′H2 group) and in the interval 1200–1300 cm–1 (bands assigned to localized vibrations of the DNA bases) (29,30,38,39) were compensated for as much as possible; (ii) the Raman signature of the free polyamine (Fig. 5) was preserved. Thus, Raman bands of the polyamine have not been compensated for in these subtractions. Analogous data for Spd and Spm complexes of CT DNA (42% GC), EC DNA (50% GC) and ML DNA (72% GC) are presented in Figures 2–4, respectively.
Figure 1.
Raman spectrum of C.perfringens DNA (20 mg/ml, pH 7.0) in the absence of polyamines (top trace) and the difference spectra obtained by subtraction of the top trace from spectra of C.perfringens DNA in the presence of 1, 5 and 60 mM spermidine [H3N(CH2)3NH2(CH2)4NH3]3+ and 1, 5 and 60 mM spermine [(CH2)4(NH2(CH2)3NH3)2]4+, as labeled. Mixtures contain DNA at 20 mg/ml, pH 7.5 (21°C). Spectral resolution, 3 cm–1; spectral averaging, 25–30 exposures of 20 s each; spectral accuracy, ±1 cm–1. For normalization, contributions from DNA at 1420 cm–1 and in the interval 1200–1300 cm–1 have been compensated for (minimized) in difference spectra. The Raman signature of the free polyamine has not been compensated for and contributes positive difference peaks (cf. Fig. 5). The artifact occurring in some difference spectra at 1122 cm–1 (Hg emission line) is marked by an asterisk.
Figure 5.
Raman spectra of spermidine (top trace) and spermine (bottom trace), each at 60 mM in H2O solution, 21°C, pH 6.5. Labels indicate proposed vibrational assignments (st, stretch; tw, twist; wg, wag; sc, scissor). The 1454 cm–1 band is assigned to the sc mode of methylene groups linked to a nitrogen atom.
Figure 2.
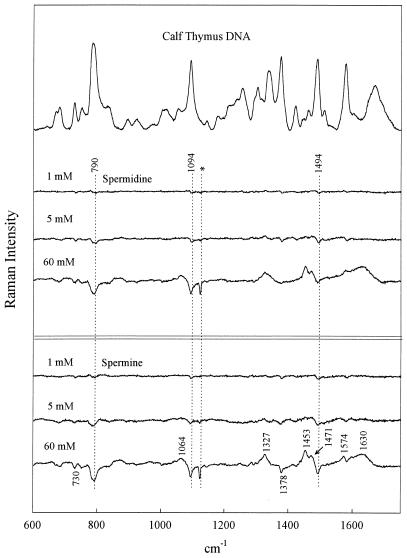
Raman spectrum of calf thymus DNA (20 mg/ml, pH 7.0) in the absence of polyamines (top trace) and the difference spectra obtained by subtraction of the top trace from spectra of calf thymus DNA in the presence of 1, 5 and 60 mM spermidine and 1, 5 and 60 mM spermine, as labeled. Other conditions are given in the legend to Figure 1.
Figure 4.
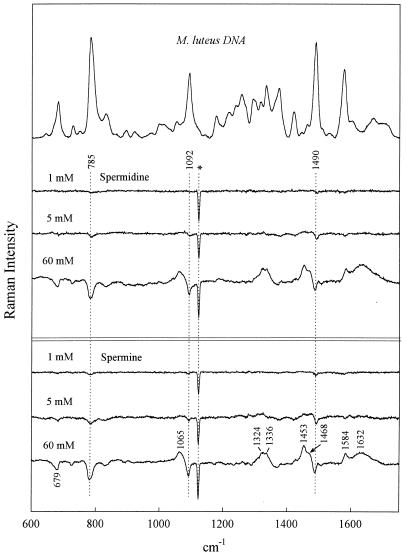
Raman spectrum of M.luteus DNA (20 mg/ml, pH 7.0) in the absence of polyamines (top trace) and the difference spectra obtained by subtraction of the top trace from spectra of M.luteus DNA in the presence of 1, 5 and 60 mM spermidine and 1, 5 and 60 mM spermine, as labeled. Other conditions are given in the legend to Figure 1.
As seen in Figure 1, the 1:1 complexes (60 mM polyamine) generate the largest perturbations to the CP DNA Raman signature, whereas the 1:60 complexes (1 mM polyamine) generate the smallest perturbations. This general pattern is sustained for all genomic DNA species (cf. Figs 2–4). It should be kept in mind that because polyamine contributions have not been compensated for in any of the difference spectra, Raman bands of the polyamines appear as positive difference features (peaks). However, it is apparent that for solutions containing the lowest polyamine concentration (1 mM) such differences are close to the margin of detectability. Assignments for the Spd and Spm contributions to the difference spectra of Figures 1–4 can be discerned by reference to the Raman spectra of the free polyamines, shown in Figure 5.
Spermidine and spermine employ similar DNA-binding mechanisms. The data of Figures 1–4 show that a given genomic DNA suffers similar spectral perturbations from binding of either Spd or Spm. This indicates that Spd and Spm exploit a common molecular mechanism of DNA binding.
Phosphates are the primary DNA-binding sites of spermidine and spermine. As noted above, the precipitated 1:1 complexes (60 mM polyamine/60 mM DNA phosphate; Figs 1–4) exhibit the largest perturbations to the genomic DNA Raman signature. Among the salient difference features are troughs near 785 and 1090 cm–1. Prominent troughs at 785 and 1090 cm–1 are also observed for the 1:12 complexes of CT DNA, EC DNA and ML DNA and indications of weak troughs at these wavenumber values are seen even in 1:60 complexes (Figs 2–4). Because the parent Raman bands are due to vibrations localized in phosphate groups of the DNA backbone (C3′–O–P–O–C5′ phosphodiester stretch at 785 cm–1 and PO2– phosphodioxy stretch at 1090 cm–1) (29,30), DNA phosphates are indicated as the primary sites of polyamine binding. This finding represents direct experimental evidence in favor of non-specific binding of polyamines to genomic DNAs of differing GC:AT ratios; it is consistent with models proposing electrostatic attractions between the DNA phosphates and polyamine cationic groups as the driving force for polyamine-induced DNA condensation.
The major groove of B-DNA is also involved in spermidine and spermine recognition. The DNA Raman band near 1480 ± 10 cm–1 is due primarily to a vibration localized in the guanine imidazolium ring (40). The precise wavenumber value of this Raman marker is sensitive to the average hydrogen bonding environment of guanine N7 sites (41,42). Such sensitivity can be exploited to monitor interactions of major groove-binding molecules (42–44). In CT DNA, EC DNA and ML DNA (Figs 2–4) we observe a difference trough near 1485 cm–1 and a companion difference peak near 1475 cm–1, indicating a shift of Raman intensity from ∼1485 to ∼1475 cm–1 with polyamine binding. This implicates the guanine N7 sites along the major groove of genomic B-DNAs in polyamine recognition and suggests further that the bound polyamine molecules either undergo hydrogen bonding interactions with guanine N7 acceptors or alter existing interactions (or environments) in the vicinity of the guanine N7 sites.
The intensity of the DNA Raman band near 1375 cm–1 is sensitive to the average amphipathic environment of thymine C5H3 groups in the major groove of B-DNA and generally increases with increasing hydrophobicity of the major groove environment (42–44). The troughs near 1375 cm–1 in the difference spectra (Figs 1–4) imply more hydrophobic environments in polyamine-free genomic DNAs than in corresponding polyamine–DNA complexes. The 1375 cm–1 trough correlates with the observed intensity change in the 1475–1485 cm–1 interval. Together, these results indicate that the major groove of genomic B-DNA is perturbed by polyamine binding.
Dependence of spectral perturbations on genomic DNA base composition
Although the pattern of polyamine–DNA recognition revealed by the difference spectra of Figures 1–4 is generally very similar at both the qualitative and semi-quantitative levels, base composition-specific signals of polyamine binding are suggested by the major groove Raman markers discussed in the preceding section. In particular, the difference spectra of CP DNA complexes (Fig. 1) do not exhibit a trough/peak pattern at 1485/1475 cm–1 that is as prominent as those observed in other genomic DNA complexes. Conversely, the CP DNA complexes exhibit a trough feature near 1375 cm–1 that is more prominent than the corresponding feature in other genomic DNA complexes. These findings are consistent with the genomic DNA base compositions and presumably reflect the low GC and high AT content of CP DNA, rather than different binding mechanisms for the different genomic species. Thus, while Spd and Spm presumably bind as effectively to phosphates of CP DNA as to phosphates of other genomic DNAs and apparently similarly perturb the respective B-DNA major grooves, such perturbations are signaled differently in GC-rich DNA (1485/1475 cm–1 markers) than in AT-rich DNA (1375 cm–1 marker).
DISCUSSION AND CONCLUSIONS
We have employed Raman difference spectroscopy to compare the Raman vibrational signatures of genomic B-DNA from M.luteus (72% GC), E.coli (50% GC), calf thymus (42% GC) and C.perfringens (27% GC) in both the absence and presence of the polyamines Spd and Spm. Solutions containing low (1:60), moderate (1:12) and high (1:1) molar ratios of polyamine to DNA phosphate have been examined. The Raman difference spectra establish that binding of Spd and Spm to each genomic DNA can be detected definitively for polyamine:phosphate ratios as low as 1:12. Even at the lowest polyamine density examined (1:60), Raman evidence of polyamine binding is suggested for GC-rich genomic DNA by marginal perturbations to the guanine N7 (major groove marker) band near 1485 cm–1.
The Raman difference spectra are indicative of a non-specific molecular mechanism of polyamine–DNA recognition, i.e. binding is largely independent of genomic DNA base composition. Because Raman bands due to localized vibrations of the DNA phosphates (785 and 1090 cm–1) suffer the greatest perturbations in the presence of Spd and Spm, we propose that the polyvalent cations bind electrostatically near the DNA phosphates. This conclusion is in accord with the observation that all genomic DNAs precipitate within a relatively narrow range of polyamine concentration, between 5 and 60 mM.
Our results show that localized phosphate vibrations are influenced by Coulombic interactions with non-localized, electrostatically bound multivalent cations. This is not surprising, because the force field experienced by the phosphates should be sensitive to an electrical potential gradient, whether produced by specific site binding or by averaging the fields of mobile ions. Such fields will certainly differ for multivalent and monovalent cations.
Polyamine interaction with DNA phosphates is also accompanied by perturbation of the major groove of B-DNA, evident in GC-rich genomes as a shift to lower wavenumber of the guanine 1485 cm–1 marker and in AT-rich genomes by suppression of the intensity of the thymine 1375 cm–1 marker. Similarities among the difference spectra obtained on the three genomic DNAs (CT, EC and ML) of highest GC content (42, 50 and 72%) suggest that a binding threshold (∼42% GC) may exist above which additional structural perturbation of the major groove is not significant. Although the present study does not address the question of whether DNA-bound polyamines actually reside along the major groove and interact not only with phosphates but also with accessible base sites (such as N7 of guanine and C5H3 of thymine), such interactions are not inconsistent with the Raman data. Molecular dynamics simulations of spermine–phosphate interactions in GC-containing nucleic acid models also support major groove binding (45).
Very low concentrations of polyamines (polyamine:phosphate <1:60) reduce the persistence length of DNA, presumably through an electrostatic mechanism that increases the local curvature and/or flexibility of the double helix (46–49). Although Raman markers of bent B-DNA have been proposed recently (43), no evidence of such markers is apparent in the difference spectra reported here at low polyamine concentrations. This is not surprising, because the proposed structural fluctuations are relatively infrequent and are expected to affect <1% of the nucleotide residues, thus producing little or no detectable change in the DNA Raman signature. At higher polyamine concentrations, the Raman difference spectra clearly reveal that both Spd and Spm bind to the DNA backbone and ultimately perturb the guanine N7 and thymine C5H3 sites. These findings are consistent with previous studies of model nucleic acids showing that spermine inhibits guanine N7 alkylation induced by the crosslinking reagent 2,5-diaziridinylbenzoquinone (50).
Of particular interest is the present finding that polyamine binding has a negligible effect on the B-form secondary structure of genomic DNA. Recent NMR studies of oligonucleotide solution structures in the absence and presence of polyamines have led to the proposal that polyamines can promote B→A (51) or B→Z (52) secondary structure transformations. We find no evidence to suggest similar transformations in any genomic DNA. Indeed, polyamine-bound genomic DNA maintains the B-form structure even upon precipitation (condensation). The capability of both Spd and Spm to bind and condense genomic DNA while conserving the native B-form secondary structure may have important biological implications.
We have shown previously that divalent transition metal ions bind primarily to the DNA bases and radically disrupt the structure of B-DNA (33,34). In contrast, polyamines bind primarily to the DNA phosphates to preserve and stabilize the B duplex (53). (Similar binding also occurs for divalent alkaline earth metal cations; 33,34.) A comparison of perturbations to the genomic DNA Raman signatures generated by the binding of polyamines, transition metals and alkaline earth metals is given in Table 1. The contrasting differences between transition metal and polyamine binding can be rationalized in terms of the proposed mechanisms. Thus, the transition metals bind prolifically to nitrogenous base sites (including N7 as well as imino and amino nitrogens), which induces rupturing of interbase hydrogen bonds, proton release and destabilization of base stacking. This facilitates strand separation and, subsequently, strand crosslinking through metal bridge formation. Ultimately, the metalated and crosslinked DNA strands precipitate from solution (34). Conversely, polyamines, like alkaline earth metals, bind to the phosphates of the DNA backbone, without significantly perturbing either base pairing or base stacking interactions of B-DNA. The trivalent (Spd) and tetravalent (Spm) ligands presumably mediate the compaction of genomic B-DNA by binding electrostatically to neighboring helix surfaces and forming self-organized but mobile surface lattices of ions. These lattices adjust to those on the adjoining surface to form a configuration of minimum free energy (54). Thus, electrostatic shielding of the phosphates facilitates closer helix–helix surface contacts and, ultimately, polymer condensation.
Table 1. Effects of binding of polyamines and various divalent metal cations on selected Raman bands of genomic B-DNA.
| Banda | Assignmentb | Polyaminesb,c | Transition metalsb,d | Group IIA metalsb,e |
|---|---|---|---|---|
| 668 | dT | – | ↑ | ↑ |
| 681 | dG | ↓ | ↓, ← | – |
| 728 | dA | ↓ | ↑ | ↑ |
| 750 | dT | – | + | – |
| 785 | bk (OPO str); dC | ↓↓ | ↑ | ↑↑ |
| 835 | bk (OPO str) | ↓ | ↓↓ | ↓ |
| 1092 | bk (PO2– str) | ↓ | + | + |
| 1240 | dT | – | ↑↑ | – |
| 1257 | dC | – | ↑↑ | ↑ |
| 1305 | dA | – | ↓ | – |
| 1338 | dA, dG | – | ↓ | ↑ |
| 1376 | dT | ↓ | ↓ | ↓ |
| 1421 | dA, bk (2′CH2 def) | – | ↑ | ↑ |
| 1490 | dG, dA | ← | ↓↓, ← | ← |
| 1578 | dG, dA | ← | ↑ | ← |
| 1668 | dT (C=O str) | – | ↑, ← | ↑, ← |
aApproximate wavenumber value (±2 cm–1) of band center.
bBand assignments are to specific types of vibrations (str, stretch; def, deformation) or to deoxynucleosides (dA, dT, dG, dC) or backbone linkages (bk) in accordance with previous work (see refs 33–36 and citations therein). Intensity increases (↑) or decreases (↓) and wavenumber increases (→) or decreases (←) with binding are also indicated. (Very large effects are designated with double arrows.) The + symbol indicates that different effects are observed for different cations within the indicated class (column); the – symbol indicates that no effect is observed for any cation within the indicated class.
cThis work.
dFrom Duguid et al. (33).
eFrom Duguid et al. (34).
It has also been proposed that spermine can act as an intra-helical tether of B-DNA by bridging the minor groove to form electrostatic bonds with phosphates of the two strands in the B duplex (55). A similar polyamine cross-strand interaction has been proposed in the crystal structure of the A-DNA oligomer d(GTGTACAC) (22). We find no direct evidence of such interactions in the higher molecular weight genomic DNAs examined here.
Although polyamine binding does not promote reorganization of the B-form secondary structure of genomic DNA, the impact of polyamine binding to phosphates may be sufficient to interfere with the binding or release of gene regulatory proteins. Polyamines may also fulfill a role in gene regulation either directly through major groove occupancy or indirectly through modulation of major groove dimensions. The importance of both phosphate and major groove sites in gene regulation is well established (56). Future work will focus on gaining insight into the potential role of polyamines in regulating interactions of DNA-binding proteins with their DNA target sites.
Figure 3.
Raman spectrum of E.coli DNA (20 mg/ml, pH 7.0) in the absence of polyamines (top trace) and the difference spectra obtained by subtraction of the top trace from spectra of E.coli DNA in the presence of 1, 5 and 60 mM spermidine and 1, 5 and 60 mM spermine, as labeled. Other conditions are given in the legend to Figure 1.
Acknowledgments
ACKNOWLEDGEMENTS
Support of this research by grants GM28093 (to V.A.B.) and GM54378 (to G.J.T.) from the US National Institutes of Health is gratefully acknowledged.
REFERENCES
- 1.Cohen S.S. (1998) A Guide to Polyamines. Oxford University Press, New York, NY.
- 2.Tabor C.W. and Tabor,H. (1984) Annu. Rev. Biochem., 53, 749–790. [DOI] [PubMed] [Google Scholar]
- 3.Marx K.A. and Reynolds,T.C. (1982) Proc. Natl Acad. Sci. USA, 79, 6484–6488. [DOI] [PMC free article] [PubMed] [Google Scholar]
- 4.Pegg A.E. (1986) Biochem. J., 234, 249–262. [DOI] [PMC free article] [PubMed] [Google Scholar]
- 5.Gosule L.C. and Schellman,J.A. (1976) Nature, 259, 333–335. [DOI] [PubMed] [Google Scholar]
- 6.Gosule L.C. and Schellman,J.A. (1978) J. Mol. Biol., 121, 311–326. [DOI] [PubMed] [Google Scholar]
- 7.Wilson R.W. and Bloomfield,V.A. (1979) Biochemistry, 18, 2192–2196. [DOI] [PubMed] [Google Scholar]
- 8.Saminathan M., Antony,T., Shirahata,A., Sigal,L.H., Thomas,T. and Thomas,T.J. (1999) Biochemistry, 38, 3821–3830. [DOI] [PubMed] [Google Scholar]
- 9.Antony T., Shirahata,A. and Thomas,T.J. (1999) Biochemistry, 38, 10775–10784. [DOI] [PubMed] [Google Scholar]
- 10.Braunlin W.H., Strick,T.J. and Record,M.T.,Jr (1982) Biopolymers, 21, 1301–1314. [DOI] [PubMed] [Google Scholar]
- 11.Hirschman S.Z., Leng,M. and Felsenfeld,G. (1967) Biopolymers, 5, 227–233. [DOI] [PubMed] [Google Scholar]
- 12.Shapiro J.T., Stannard,B.S. and Felsenfeld,G. (1969) Biochemistry, 8, 3233–3241. [DOI] [PubMed] [Google Scholar]
- 13.Plum G.E. and Bloomfield,V.A. (1990) Biopolymers, 29, 13–27. [DOI] [PubMed] [Google Scholar]
- 14.Braunlin W.H., Anderson,C.F. and Record,M.T.,Jr (1986) Biopolymers, 25, 205–214. [DOI] [PubMed] [Google Scholar]
- 15.Burton D.R., Forsén,S. and Reimarsson,P. (1981) Nucleic Acids Res., 9, 1219–1228. [DOI] [PMC free article] [PubMed] [Google Scholar]
- 16.Padmanabhan S., Richey,B., Anderson,C.F. and Record,M.T.,Jr (1988) Biochemistry, 27, 4367–4376. [DOI] [PubMed] [Google Scholar]
- 17.Wemmer D.E., Srivenugopal,K.S., Reid,B.R. and Morris,D.R. (1985) J. Mol. Biol., 185, 457–459. [DOI] [PubMed] [Google Scholar]
- 18.Anderson C.F. and Record,M.T.,Jr (1982) Annu. Rev. Phys. Chem., 33, 191–222. [Google Scholar]
- 19.Manning G.S. (1978) Q. Rev. Biophys., 11, 179–246. [DOI] [PubMed] [Google Scholar]
- 20.Manning G.S. (1979) Acc. Chem. Res., 12, 443–449. [Google Scholar]
- 21.Rouzina I. and Bloomfield,V.A. (1996) J. Phys. Chem., 100, 4292–4304. [Google Scholar]
- 22.Jain S., Zon,G. and Sundaralingam,M. (1989) Biochemistry, 28, 2360–2364. [DOI] [PubMed] [Google Scholar]
- 23.Tippin D.B. and Sundaralingam,M. (1997) J. Mol. Biol., 267, 1171–1185. [DOI] [PubMed] [Google Scholar]
- 24.Wahl M.C. and Sundaralingam,M. (1997) Biopolymers, 44, 45–63. [DOI] [PubMed] [Google Scholar]
- 25.Gessner R.V., Frederick,C.A., Quigley,G.J., Rich,A. and Wang,A.H.-J. (1989) J. Biol. Chem., 264, 7921–7935. [DOI] [PubMed] [Google Scholar]
- 26.Quigley G.J., Teeter,M.M. and Rich,A. (1978) Proc. Natl Acad. Sci. USA, 75, 64–68. [DOI] [PMC free article] [PubMed] [Google Scholar]
- 27.Braunlin W.H. and Xu,Q. (1992) Biopolymers, 32, 1703–1711. [DOI] [PubMed] [Google Scholar]
- 28.Xu Q., Shoemaker,R.K. and Braunlin,W.H. (1993) Biophys. J., 65, 11754–11760. [Google Scholar]
- 29.Thomas G.J. Jr and Tsuboi,M. (1993) Adv. Biophys. Chem., 3, 1–70. [Google Scholar]
- 30.Erfurth S.C. and Peticolas,W.L. (1975) Biopolymers, 14, 247–264. [DOI] [PubMed] [Google Scholar]
- 31.Aubrey K.L., Casjens,S.R. and Thomas,G.J.,Jr (1992) Biochemistry, 31, 11835–11842. [DOI] [PubMed] [Google Scholar]
- 32.Overman S.A., Aubrey,K.L., Reilly,K.E., Osman,O., Hayes,S.J., Serwer,P. and Thomas,G.J.,Jr (1998) Biospectroscopy, 4, S47–S56. [DOI] [PubMed] [Google Scholar]
- 33.Duguid J., Bloomfield,V.A., Benevides,J.M. and Thomas,G.J.,Jr (1993) Biophys. J., 65, 1916–1928. [DOI] [PMC free article] [PubMed] [Google Scholar]
- 34.Duguid J.G., Bloomfield,V.A., Benevides,J.M. and Thomas,G.J.,Jr (1995) Biophys. J., 69, 2623–2641. [DOI] [PMC free article] [PubMed] [Google Scholar]
- 35.Duguid J.G., Bloomfield,V.A., Benevides,J.M. and Thomas,G.J.,Jr (1996) Biophys. J., 71, 3350–3360. [DOI] [PMC free article] [PubMed] [Google Scholar]
- 36.Deng H., Bloomfield,V.A., Benevides,J.M. and Thomas,G.J.,Jr (1999) Biopolymers, 50, 656–666. [DOI] [PubMed] [Google Scholar]
- 37.Movileanu L., Benevides,J.M. and Thomas,G.J.,Jr (1999) J. Raman Spectrosc., 30, 637–649. [Google Scholar]
- 38.Thomas G.J. Jr, Benevides,J.M., Overman,S.A., Ueda,T., Ushizawa,K., Saitoh,M. and Tsuboi,M. (1995) Biophys. J., 68, 1073–1088. [DOI] [PMC free article] [PubMed] [Google Scholar]
- 39.Chan S.S., Austin,R.H., Mukerji,I. and Spiro,T.G. (1997) Biophys. J., 72, 1512–1520. [DOI] [PMC free article] [PubMed] [Google Scholar]
- 40.Lane M.J. and Thomas,G.J.,Jr (1979) Biochemistry, 18, 3839–3846. [DOI] [PubMed] [Google Scholar]
- 41.Nishimura Y., Tsuboi,M., Sato,T. and Akoi,K. (1986) J. Mol. Struct., 146, 123–153. [Google Scholar]
- 42.Benevides J.M., Weiss,M.A. and Thomas,G.J.,Jr (1991) Biochemistry, 30, 5955–5963. [DOI] [PubMed] [Google Scholar]
- 43.Benevides J.M., Li,T., Lu,X.-J., Srinivasan,A.R., Olson,W.K., Weiss,M.A. and Thomas,G.J.,Jr (2000) Biochemistry, 39, 537–547. [DOI] [PubMed] [Google Scholar]
- 44.Benevides J.M., Weiss,M.A. and Thomas,G.J.,Jr (1994) J. Biol. Chem., 269, 10869–10878. [PubMed] [Google Scholar]
- 45.Feuerstein B.G., Pattabiraman,N. and Marton,L.J. (1989) Nucleic Acids Res., 17, 6883–6892. [DOI] [PMC free article] [PubMed] [Google Scholar]
- 46.Baumann C.G., Smith,S.B., Bloomfield,V.A. and Bustamante,C. (1997) Proc. Natl Acad. Sci. USA, 94, 6185–6190. [DOI] [PMC free article] [PubMed] [Google Scholar]
- 47.Porschke D. (1984) Biochemistry, 23, 4821–4828. [DOI] [PubMed] [Google Scholar]
- 48.Wang M.D., Yin,H., Landick,R., Gelles,J. and Block,S.M. (1997) Biophys. J., 72, 1335–1346. [DOI] [PMC free article] [PubMed] [Google Scholar]
- 49.Rouzina I. and Bloomfield,V.A. (1998) Biophys. J., 74, 3152–3164. [DOI] [PMC free article] [PubMed] [Google Scholar]
- 50.Yuki M., Grukhin,V., Lee,C.-S. and Haworth,I.S. (1996) Arch. Biochem. Biophys., 325, 39–46. [DOI] [PubMed] [Google Scholar]
- 51.Robinson H. and Wang,A.H.-J. (1996) Nucleic Acids Res., 24, 676–682. [DOI] [PMC free article] [PubMed] [Google Scholar]
- 52.Howell M.L., Schroth,G.P. and Ho,P.S. (1996) Biochemistry, 35, 15373–15382. [DOI] [PubMed] [Google Scholar]
- 53.Thomas T.J. and Bloomfield,V.A. (1984) Biopolymers, 23, 1295–1306. [DOI] [PubMed] [Google Scholar]
- 54.Rouzina I. and Bloomfield,V.A. (1996) J. Phys. Chem., 100, 9977–9989. [Google Scholar]
- 55.Tsuboi M. (1964) Bull. Chem. Soc. Jpn, 37, 1514–1522. [Google Scholar]
- 56.Steitz T.A. (1990) Q. Rev. Biophys., 23, 105–180. [DOI] [PubMed] [Google Scholar]


