


Abstract
This work presents the first structural analysis of an RNA–DNA complex consisting of an 18 nt RNA hairpin and a 20 nt DNA aptamer. The DNA molecule was previously selected, from a randomly synthesized library, against the transactivation response element (TAR) involved in transcriptional regulation of the HIV genome. The DNA aptamer used in the present study is an imperfect stem–loop with the sequence 5′-ACTCCCAT-3′, characteristic of the selected candidates, in the apical loop. This octameric motif contains five bases complementary to the TAR loop sequence 5′-CUGGGA-3′. The use of homo- and heteronuclear NMR spectroscopy allowed assignment of the complex resonances and resolution of its secondary structure. Evidence is given for a kissing complex fold, which consists of a quasi-continuous helix formed by one stem of DNA, one stem of RNA and a central hybrid helix comprising 5 bp. Two out of helices residues of DNA and one of RNA connect the DNA–RNA loop–loop helix to the stem of either partner in the complex. In addition, two thymines of the DNA stem are engaged in a non-canonical T·T base pair.
INTRODUCTION
The transactivation response element (TAR) at the 5′-end of the long terminal repeat of human immunodeficiency virus type 1 (HIV-1) RNA is essential for HIV replication (1,2). TAR consists of a 59 nt hairpin with a highly conserved 6 nt loop sequence 5′-CUGGGA-3′ (3,4). This TAR loop sequence is critical for in vivo transactivation and has been shown to be the binding site of viral and cellular proteins (5,6). DNA molecules were previously selected in vitro for their specific binding to the TAR sequence (7). All the DNA molecules identified at the end of this SELEX process displayed an imperfect stem–loop with a consensus sequence 5′-ACTCCCAT-3′ containing five bases complementary to the TAR loop sequence, suggesting the possible formation of a loop–loop interaction. In addition, D-04, the aptamer displaying the highest affinity among the selected candidate, exhibited a thymine residue in the upper part of the stem, which was suggested to form a single base bulge in a previous study (7). Such anti-TAR aptamers might be of interest for the control of HIV development. Rationalization of the sequences obtained requires a better understanding of the recognition processes between the DNA aptamer and its RNA target. In this context, we undertook a structural study by NMR of the interaction between TAR and a motif derived from the anti-TAR D-04 DNA aptamer. This work presents the characterization of the secondary structure of the resulting complex by proton and 15N NMR spectroscopy, which constitutes the first step in the rational optimization and design of new active oligonucleotides.
MATERIALS AND METHODS
Oligonucleotide preparation and characterization
The DNA oligonucleotide was synthesized by standard solid phase phosphoramidite chemistry on a Millipore Cylone Plus DNA synthesizer. TAR-18 RNA was transcribed in vitro using T7 RNA polymerase and a synthetic DNA template (8). Uniformly 15N-13C-labeled TAR-18 RNA was produced from 15N-13C-labeled nucleotide monophosphates isolated from Escherichia coli MRE 600 cells grown on Martek 9 medium, following published procedures (9,10). Both DNA and TAR-18 RNA were purified using 20% PAGE under denaturing conditions. The concentration of oligonucleotide solutions was calculated using 274 and 166 mM/cm as molar extinction coefficients at 260 nm for the DNA and TAR-18 RNA sequences, respectively. DNA and RNA samples were dialyzed against a 50 mM NaCl, 10 mM sodium phosphate buffer, pH 6.5.
NMR spectroscopy
All NMR experiments were recorded on a Bruker DRX-600 spectrometer or a Bruker DRX-800 spectrometer equipped with triple resonance, three-axis gradient probes. The final NMR sample concentrations were ∼1 mM in 150 mM NaCl, 10 mM sodium phosphate buffer, pH 6.5. The 1D and 2D exchangeable proton spectra were recorded at 278 and 288K using a hybrid jump-and-return (11) WATERGATE (12) water suppression sequence. For the 1D spectra, free induction decays were acquired with 2048 complex data points. Proton spectral widths were 15 and 10.5 p.p.m. in H2O and D2O, respectively. For the 2D proton experiments, 512 and 256 free induction decays of 32 scans were acquired along the F1 dimension for NOESY and COSY experiments, respectively. A total of 2K complex points were acquired along the F2 dimension. A recycle delay of 1 s was used. The 1H carrier was positioned on the H2O resonance. For the 1H-15N HSQC experiment, spectral widths of 9.3 and 120 p.p.m. were used in F2 and F1, respectively. The 1H carrier was positioned in the middle of the imino–amino resonances (10.5 p.p.m.) and the 15N carrier was positioned at 133.5 p.p.m. A total of 512 complex points were collected in the F2 dimension; 256 complex free induction decays of 32 scans were acquired along the F1 dimension. For the 1H-15N experiment across hydrogen bonds, spectral widths of 5 and 88.8 p.p.m. were used in F2 and F1, respectively. The 1H carrier was positioned in the middle of the imino resonances (12.5 p.p.m.) and the 15N carrier was positioned in the middle of the N1-N3 resonances (182 p.p.m.). A total of 1024 complex points were collected in the F2 dimension; 128 free induction decays of 256 scans were acquired along the F1 dimension. For both experiments, water suppression was performed by an on resonance WATERGATE sequence (12). All data were processed with the GIFA 4.10 program (13). NMR samples contained a trace of TSP as an internal proton chemical shift reference. Indirect referencing was used for 15N resonances (14).
RESULTS AND DISCUSSION
The TAR–DNA aptamer: a loop–loop interaction
Footprint studies performed on TAR bound to different DNA aptamers confirmed the loop–loop interaction suggested by the complementarity of their loop sequences (7). Preliminary 1D NMR studies were performed on a 29 nt RNA (TAR-29) corresponding to the apical region of the wild-type TAR sequence known to retain complete biological activity in vivo (1). The spectra obtained indicated that the bulge region of TAR-29 was not involved in DNA binding (data not shown). Thus, all NMR structural studies were performed on an 18 nt TAR hairpin (TAR-18) obtained after deletion of the bulge region. This sequence was similar to the TAR-16 sequence previously used by Tinoco et al. (15) except that it contained an extra G·C base pair at the bottom of the stem (Fig. 1). The DNA finally retained for the NMR studies was a 20 nt oligonucleotide derived from D-04, the aptamer showing the highest affinity for the TAR element (7), by deletion of the bottom part of the stem. This shortened version displayed binding properties to TAR similar to the full-length aptamer (7). The assignments of the imino proton resonances of TAR-18 free in solution were obtained from 2D NOESY spectra recorded in H2O at 15°C and were very similar to those previously reported for TAR-16 (15). The 1D spectrum of the DNA free in solution exhibited only four imino proton resonances, showing the formation of a partially folded hairpin with a 4 bp stem (data not shown). Titration of TAR-18 by the DNA was monitored in the imino region of 1D spectra. The appearance of an extra set of resonances that did not belong to the free DNA with increasing amounts of DNA substantiated the formation of a complex in slow exchange on the NMR time scale (Fig. 1). However, free RNA resonances were still observed at equivalence on the 1D spectrum in the present NMR conditions. Variation of the NaCl concentration yielded a spectrum in which the free RNA resonances were undetectable. This occurred for a 150 mM NaCl concentration. Only minor changes of chemical shifts of the imino proton resonances of the TAR-18 stem were observed. Changes of chemical shifts being sensitive indicators of local environment modifications that result from binding or conformational changes, our results were consistent with a loop–loop interaction between the two hairpins.
Figure 1.

Titration of TAR-18 by the DNA aptamer at 15°C. Secondary structures of TAR-18 and of the 20 nt DNA aptamer are shown at the top of the figure. (A) 1D imino proton spectrum assignment of TAR-18 based on H2O NOESY experiments. (B) 1D imino proton spectrum at equivalence ([DNA] = [RNA] ≈ 1 mM) in 50 mM NaCl, 10 mM sodium phosphate buffer, pH 6.5. The remaining free RNA resonance of G4 is indicated on the spectrum. (C) 1D imino proton spectrum at equivalence after optimization of the experimental conditions (150 mM NaCl, 10 mM sodium phosphate buffer, pH 6.5). Disappearance of the free G4 imino proton resonance is indicated.
Three stacked helices in the complex
The melting temperature of the TAR–DNA complex was evaluated by NMR spectroscopy. All imino proton resonances of the complex disappeared above 25°C. The DNA aptamer was already melted at this temperature and only the free TAR-18 resonances were observable above this temperature. The low thermal stability of the TAR–DNA complex prevented investigations over a large temperature range.
The assignment of the imino protons was performed on a 2D NOESY spectrum in H2O at 5°C on the unlabeled sample. Sixteen major imino proton resonances were observed in the spectrum of the complex. Except for the dT5 and dT14 imino protons, it was possible to walk sequentially through all the imino protons (Fig. 2). This was consistent with the existence of a quasi-continuous helix formed by three helical segments: two of them corresponded to the stem of each hairpin (TAR-18 and DNA); the third one was a new helix created by the loop–loop interaction. As will be further discussed in detail, this third helix of the TAR–DNA kissing complex could potentially involve 5 or 6 bp. The second case would require disruption of the TAR rC6·rG13 base pair at the top of the stem (Fig. 2B). At that point we could not establish the actual secondary structure from 2D NOESY spectra because the two types of secondary structures would exhibit the same sequential imino connectivities. A striking observation was the presence in the 2D NOESY spectra of strong cross-peaks between two high field chemical shift imino protons (at 10.00 and 10.75 p.p.m.) observed even for a mixing time of 50 ms. These imino protons, assigned to residues dT16 and dT5, exhibited nOe connectivities with the imino proton of dG4 (Fig. 2A). This suggested a non-canonical structure of the DNA helix around residues dG4, dT5 and dT16. Six of the eight adenine H2 protons were assigned to rA12 and rA3 of TAR-18 and dA2, dA6, dA13 and dA18 of the DNA sequence from strong nOe connectivities seen between the imino protons of the A·U or A·T base pairs and the H2 of the adenine residue.
Figure 2.

Sequential walk through imino protons and anomeric/aromatic protons of the kissing complex. The TAR-18 and the DNA aptamer residues are shown in blue and black, respectively. (A) Resonance assignment of imino protons is shown on a 2D NOESY spectrum recorded in H2O on a 600 MHz spectrometer (5°C, mixing time 300 ms). The sequential walk is drawn in red. (B) Schematic representation of the two possible arrangements of the two oligonucleotides in the complex consistent with the observed sequential imino connectivities. (C) Anomeric/aromatic protons region of a 2D NOESY spectrum recorded in D2O on a 800 MHz spectrometer (15°C, mixing time 300 ms). The extreme residues of the four continuous sequential walks are indicated: from G1 to T9, from C11 to G20, from C1 to A6 and from U8 to C18. The blue and black lines sketch the sequential walks through RNA protons and DNA protons, respectively.
Most non-exchangeable protons were assigned from the 2D NOESY spectra recorded in D2O for various mixing times (50, 180 and 300 ms) and temperatures (0, 5 and 15°C). Sequential nOe correlations between ribose H1′ protons and aromatic H6, H8 protons allowed a continuous sequential walk from rG1 of TAR-18 to dT9 of the DNA sequence, from dC11 to dG20 of the DNA and, for the opposite strand, from dC1 to dA6 and from rU8 to rC18 (Fig. 2C). This indicated stacking between the three helices. In addition, intra- and interstrand correlations [on the one hand rA12H2-rG13H1′ (RNA–RNA) and rA12H2-dT9H1′ (RNA–DNA); on the other hand dA13H2-dT14H1′ (DNA–DNA) and dA13H2-rG9H1′ (DNA–RNA)] also indicated the existence of a continuous helix with the central kissing loop helix stacked on the 3′-side of the TAR-18 and DNA stem helices. Furthermore, these cross-strand nOe interactions, commonly observed in A-form helices (16), indicated that riboses of the central helix were predominately in the C3′-endo conformation. This was confirmed by the very small JH1′-H2′ coupling constants obtained from analysis of the COSY spectrum along the RNA helix and the central kissing loop helix. The large JH1′-H2′ coupling constants obtained along the DNA helix in the COSY spectrum indicated that the deoxyribose sugars of the DNA stem were mostly C2′-endo.
Five base pairs in the hybrid central helix
It was specified above that the central helix could involve 5 or 6 bp. In the first hypothesis (Fig. 2B, right), the central hybrid helix would be constituted of 5 bp and the rC6·rG13 base pair of TAR-18 would be preserved. Two residues of the DNA (dA7 and dC8) and one of the RNA (rC7) would be out of the helix and a sequential nOe connectivity would then be expected between rC5H1′and rC6H6 in the RNA. In the second hypothesis, the rC6·rG13 base pair of TAR-18 localized at the top of the stem would be opened to form a hybrid DNA–RNA dC8·rG13 base pair. In this case, the two residues rC6 and rC7 of TAR-18 and only one residue, dA7, of the DNA would be out of the helix (Fig. 2B, left). A sequential nOe connectivity between rC5H1′ of TAR-18 and dC8H6 of DNA would then be expected. Although sequential nOe connectivities were obtained for most residues along the three helices, it was not possible in the 1H-1H NOESY spectra to distinguish the C5H1′-C8H6 nOe interaction from the C5H1′-C6H6 nOe interaction. In order to solve this ambiguity, we resorted to heteronuclear NMR spectroscopy. Moreover, this will be very helpful for a more precise structural characterization of the complex.
The 1H-15N HSQC spectrum of the TAR–DNA kissing complex was recorded in H2O at 15°C on a 800 MHz spectrometer. As expected from the number and type of the RNA imino protons in the TAR–DNA complex, the 1H-15N HSQC spectrum exhibited two major imino protons of uracils and seven major imino protons of guanines. This 2D HSQC experiment not only validated the imino proton assignment, but also allowed characterization of the loop–loop interaction. In a G·C base pair, strong nOe cross-peaks are usually observed from the guanine imino proton to each amino proton of the paired cytosine. Indeed, on the 1H-1H NOESY spectra recorded in H2O, the TAR-18 imino proton of rG13 exhibited nOe connectivities with two amino protons of a cytosine. The rG13 residue is base paired either with a deoxycytidine (dC8) or a cytidine (rC6) residue, depending on the number of base pairs involved in the central hybrid helix (Fig. 2B). The two amino protons of the cytosine base paired with rG13 were correlated with an amino 15N in the 1H-15N HSQC spectrum. Since only TAR-18 was labeled, these two amino protons belonged to a cytidine residue and rG13 was thus base paired with rC6. The rC6·rG13 base pair of TAR-18 was preserved and the central helix was composed of only five residues of each loop. To confirm this result, we performed a NMR experiment that allows correlation along the F1 dimension of two imino 15N1/15N3 across the hydrogen bond in nucleic acid base pairs, via internucleotide 2JNN scalar coupling (17,18). This experiment was performed on the 15N-13C labeled TAR–DNA sample on a 600 MHz spectrometer in H2O at 15°C (Fig. 3). As expected, a total of nine intranucleotide peaks were observed for guanine (145–150 p.p.m.) and uracile imino groups (160–165 p.p.m.), of which five yielded a 15N-15N correlation with a cytosine 15N3 or an adenine 15N1. The most interesting internucleotide correlation corresponded to that connecting the rG13 15N1 proton with the 15N3 of a cytidine. This validated the formation of the RNA rC6·rG13 base pair and thus the hypothesis of a central hybrid helix involving only 5 bp. The kissing complex secondary structure is reported in Figure 4 with the most informative nOe connectivities.
Figure 3.

2D 2JNN HNN-COSY spectrum showing the correlation along the F1 dimension of two imino 15N1/15N3 across the hydrogen bond in nucleic acid base pairs, by internucleotide 2JNN scalar coupling. The experiment was recorded on a 600 MHz spectrometer at 15°C on an ∼1 mM TAR-18–DNA complex sample in 150 mM NaCl, 10 mM sodium phosphate buffer, pH 6.5. The magnetization transfer time from the 15N(H) of one strand to the hydrogen bonded 15N of the opposite strand was set to 40 ms. The five correlations showing the base pairing along the RNA stem are shown as dotted lines.
Figure 4.
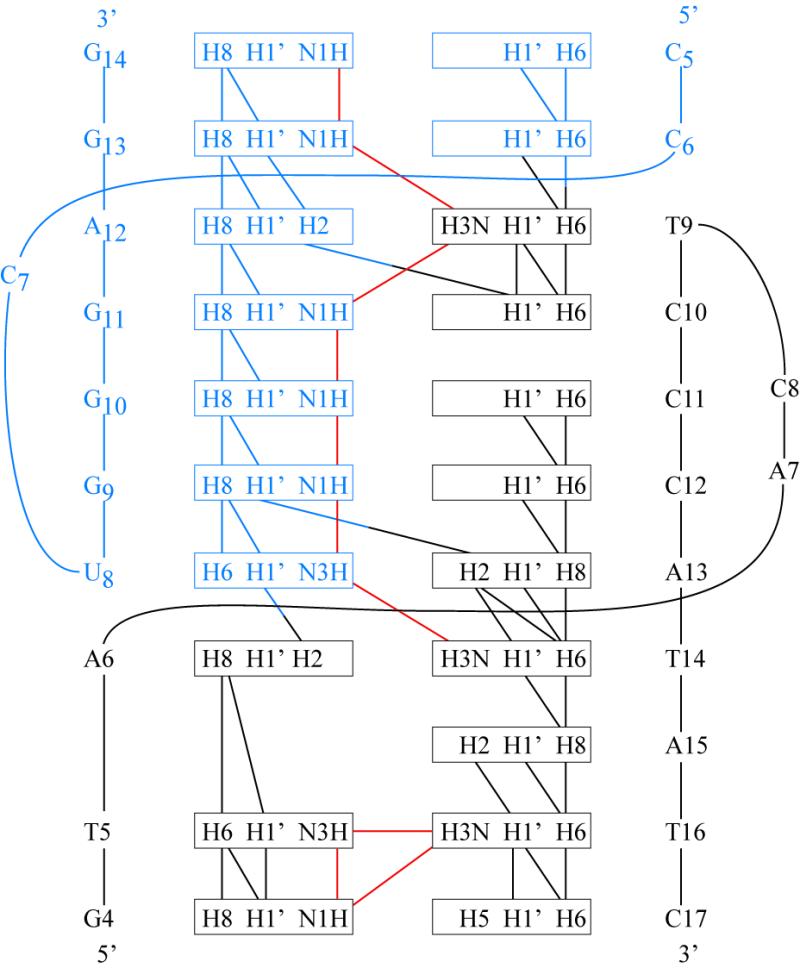
Summary of the nOe connectivities critical for characterization of the secondary structure of the TAR–DNA aptamer complex. Stem residues are not shown in the figure. The color coding is as in Figure 2.
Comparison with other kissing complexes
To our knowledge, the present study is the first structural characterization of a hybrid RNA–DNA kissing complex. Four RNA–RNA kissing complexes have been studied by NMR spectroscopy: the HIV TAR–TAR* complex (15) and the R1i–R2i complex from the ColE1 antisense control region (19), the three-dimensional structures of which have been solved, and two DIS–DIS complexes from the dimerization initiation site of HIV-1 (20,21). These complexes share many common features with the present TAR–DNA aptamer complex. They all display a quasi-continuous helix formed by two stems and a central loop–loop interaction stacked on the 3′-side of each stem. The stacking of the central helix on the 3′-side of each stem creates, for each chain, a gap between the 5′-side residue located at the top of the stem and the residue located at the opposite extremity of the central helix (Fig. 5) bridged by a linker. The main difference lies first in the number of residues in the linkers between the two stems and the central helix and in the number of residues in the central helix. The HIV TAR–TAR* and R1i–R2i complexes contain 6 and 7 bp in the central helix, respectively, with no extra residue in the linker. In the symmetrical DIS–DIS complexes, the central helix involves six residues and the linkers contain either one guanine residue (20) or two adenine residues involved in triple base stacks, with one adenine base of each strand crossing the interface to stack between two residues of the opposite strand (21). In the case of kissing complexes, the two linkers cross the major groove in a way similar to the L1 loop of pseudoknots. Groove dimensions and loop lengths crossing minor and major grooves have been described for A-form and B-form helices (22,23). The inter-phosphorus distance is 1.00, 1.04 and 1.27 nm when 7, 6 and 5 bp are bridged over the major groove, respectively. Five and six nucleotide loop–loop RNA–RNA complexes should be accommodated by a connector of at least 2 nt crossing the major groove of the helix (24). It thus appears that in all known cases the central RNA–RNA helix of the kissing complexes is significantly different from an A-form helix. Indeed, solved NMR structures of kissing complexes did show a bending of the kissing complex toward the major groove and an overwound helix which combine to reduce the distance between the two strands to allow crossing of the major groove (25).
Figure 5.

Schematic structures of a kissing complex (left) and of a pseudoknot (right) showing the conformation similarities. The terms stems (S1 and S2) and loops (L1 and L2) are used as usual (24). The arrows along the backbone of the kissing complex indicate the link which would correspond to the L2 loop of the pseudoknot.
The different lengths of the connectors for the previously characterized RNA–RNA kissing complexes (a single phosphodiester link) and for our RNA–DNA heterocomplex (one RNA residue, rC7, and two DNA residues, dA7 and dC8) likely reflects the different geometries of helices. In our case, in contrast to the RNA pseudoknots or the RNA–RNA kissing complexes, the central helix is a DNA–RNA hybrid helix. We have shown that the central helix involves 5 bp and the linkers consist of one RNA residue (rC7) and two DNA residues (dA7 and dC8). According to the previously mentioned inter-phosphorus distances, the presence of 5 bp in the central helix is likely to require at least 2 nt to bridge the gap. Although it is difficult to speculate about the distance to be spanned over the major groove of the loop–loop helix in the TAR–D-04 complex until the structure is solved, for the above reasons it will likely be larger than that in RNA–RNA kissing complexes. At first sight, the number of base pairs in the central helix seems to be close to what can be expected from such simple distance considerations, possibly indicating a less distorted helix than in the RNA–RNA kissing complexes. That this DNA–RNA loop–loop helix has a conformation different from that observed in RNA–RNA kissing complexes or in DNA–RNA linear hybrids is supported by the fact that the TAR–D-04 complex is recognized neither by the Rom protein, which is specific for RNA–RNA kissing complexes (Cazenave, unpublished results), nor by E.coli RNase H, which recognizes RNA–DNA hybrids (26).
Another interesting feature of the TAR–D-04 complex lies if the presence of non-canonical structures. The HIV TAR–TAR* and the R1i–R2i complexes contain no such structures. As in the symmetrical DIS–DIS complex, for which an A·A base pair has been reported, the complex TAR–D-04 contains a T·T base pair (dT5·dT16).
The dT16 DNA residue has been reported to be important for stability of the TAR RNA–DNA aptamer complex (7). Substitution of T by any other residue (G, C or A) or by a propylene glycol linker induced a limited reduction in affinity, whereas deletion of this T or introduction of a paired A in the opposite strand induced a large destabilization of the complex. In the present work, the formation of a T·T base pair between dT16 and dT5 was clearly demonstrated by nOe connectivities: strong nOe cross-peaks between the imino protons of dT5 and dT16 were observed; these two protons were also correlated to the dG4 imino proton belonging to the flanking dG·dC base pair. In addition, the sequential anomeric/aromatic nOe correlations from dC1 to dA6 and dC11 to dG20 were consistent with the stacking of dA6 and dT5 and of dA15 and dT16 in the stem. All these results support a structural role, rather than a sequence specificity, for residue dT16. It has been shown previously that substantial flexibility of the two oligonucleotides was necessary for formation of a kissing hairpin complex (27). In our case, the non-canonical structure in the DNA stem could lead to an increased adaptability of the DNA and consequently to a higher stability of the complex. Indeed, all DNA aptamers exhibiting a strong affinity for the TAR stem–loop displayed a weakly organized stem region, next to the loop. No G-C pair was observed in any of the selected candidates, whereas several winners had potential bulged residues.
The aptamer strategy has led to the selection of DNA molecules specific for the TAR RNA element (7). The present work allowed us to fully demonstrate the formation of a kissing complex between the DNA molecule and TAR forecast from the complementary loop sequences and to give insights into its global fold. Interpretation of the selected sequences is complicated since the role of conserved nucleotides is not yet fully understood.
The positioning of the rC7 RNA residue and of the two DNA residues dA7 and dC8 could not yet be established. The two residues of the consensus sequence of the DNA (5′-ACTCCCAT-3′) most certainly play a key role in complex stability, even if they are not directly involved in the loop–loop interaction. Precise characterization of the three-dimensional structure of the TAR–DNA aptamer complex is currently under way. It will enable a better understanding of the recognition processes between DNA and RNA, a prerequisite towards a significant improvement in the rational design of oligonucleotides specific for given RNA structures of biological interest.
REFERENCES
- 1.Muesing M.A., Smith,D.H. and Capon,D.J. (1987) Cell, 48, 691–701. [DOI] [PubMed] [Google Scholar]
- 2.Isel C. and Karn,J. (1999) J. Mol. Biol., 290, 929–941. [DOI] [PubMed] [Google Scholar]
- 3.Feng S. and Holland,E.C. (1988) Nature, 334, 165–167. [DOI] [PubMed] [Google Scholar]
- 4.Berkhout B., Silverman,R.H. and Jeang,K.T. (1989) Cell, 59, 273–282. [DOI] [PubMed] [Google Scholar]
- 5.Sheline C.T., Milocco,L.H. and Jones,K.A. (1991) Genes Dev., 5, 2508–2520. [DOI] [PubMed] [Google Scholar]
- 6.Wei P., Garber,M.E., Fang,S.-M., Fischer,W.H. and Jones,K.A. (1998) Cell, 92, 451–462. [DOI] [PubMed] [Google Scholar]
- 7.Boiziau C., Dausse,E., Yurchenko,L. and Toulmé,J. (1999) J. Biol. Chem., 18, 12730–12737. [DOI] [PubMed] [Google Scholar]
- 8.Milligan J.F., Groebe,D.R., Witherell,G.W. and Uhlenbeck,O.C. (1987) Nucleic Acids Res., 15, 8783–8798. [DOI] [PMC free article] [PubMed] [Google Scholar]
- 9.Batey R.T., Inada,M., Kujawinski,E., Puglisi,J.D. and Williamson,J.R. (1992) Nucleic Acids Res., 20, 4515–4523. [DOI] [PMC free article] [PubMed] [Google Scholar]
- 10.Nikonowicz E.P., Sirr,A., Legault,P., Jucker,F.M., Baer,L.M. and Pardi,A. (1992) Nucleic Acids Res., 20, 4507–4513. [DOI] [PMC free article] [PubMed] [Google Scholar]
- 11.Plateau P. and Gueron,M. (1982) J. Am. Chem. Soc., 104, 7311–7312. [Google Scholar]
- 12.Piotto M., Saudek,V. and Skelnár,V. (1992) J. Biomol. NMR, 2, 661–665. [DOI] [PubMed] [Google Scholar]
- 13.Pons J.-L., Malliavin,T.E. and Delsuc,M.A. (1996) J. Biomol. NMR, 8, 445–452. [DOI] [PubMed] [Google Scholar]
- 14.Wishart D.S., Bigam,C.G., Yao,J., Abildgaard,F., Dyson,H.J., Oldfield,E., Markley,J.L. and Sykes,B.D. (1995) J. Biomol. NMR, 6, 135–140. [DOI] [PubMed] [Google Scholar]
- 15.Chang K.-Y. and Tinoco,I. (1994) Biochemistry, 91, 8705–8709. [DOI] [PMC free article] [PubMed] [Google Scholar]
- 16.Varani G. and Tinoco,I. (1991) Q. Rev. Biophys., 24, 479–532. [DOI] [PubMed] [Google Scholar]
- 17.Dingley A.J. and Grezesiek,S. (1998) J. Am. Chem. Soc., 120, 8293–8297. [Google Scholar]
- 18.Pervushin K., Wider,G. and Wüthrich,K. (1998) J. Biomol. Nucl. Magn. Reson., 12, 345–348. [Google Scholar]
- 19.Marino J.P., Gregorian,R.S., Csankovszki,J.G. and Crothers,D.M. (1995) Science, 268, 1448–1454. [DOI] [PubMed] [Google Scholar]
- 20.Dardel F., Marquet,R., Ehresmann,C., Ehresmann,B. and Blanquet,S. (1998) Nucleic Acids Res., 26, 3567–3571. [DOI] [PMC free article] [PubMed] [Google Scholar]
- 21.Mujeeb A., Clever,J.A., Billeci,T.M., James,T.L. and Parslow,T.G. (1998) Nature Struct. Biol., 5, 432–436. [DOI] [PubMed] [Google Scholar]
- 22.Pleij C.W.A. (1994) Curr. Opin. Struct. Biol., 4, 337–344. [Google Scholar]
- 23.Pleij C.W.A., Rietvield,K. and Bosh,L. (1985) Nucleic Acids Res., 13, 1717–1731. [DOI] [PMC free article] [PubMed] [Google Scholar]
- 24.Haasnoot C.A.G., Hilbers,C.W., Van der Marel,G.A., Van Boom,J.H., Singh,U.C., Pattabiraman,N. and Kollman,P.A. (1986) J. Biomol. Struct. Dyn., 3, 843–855. [DOI] [PubMed] [Google Scholar]
- 25.Chang K.Y. and Tinoco,I. (1997) J. Mol. Biol., 269, 52–66. [DOI] [PubMed] [Google Scholar]
- 26.Fedoroff O.Y., Salazar,M. and Reid,B.R. (1993) J. Mol. Biol., 233, 509–523. [DOI] [PubMed] [Google Scholar]
- 27.Gregorian R.S. and Crothers,D.M. (1995) J. Mol. Biol., 248, 968–984. [DOI] [PubMed] [Google Scholar]