

Abstract
Background:
Eosinophilic esophagitis (EoE) is diagnosed and monitored using esophageal eosinophil levels; however, EoE also exhibits a marked, understudied esophageal mastocytosis.
Objective:
Using machine learning, we localized and characterized esophageal mast cells to decipher their potential role in disease pathology.
Methods:
Esophageal biopsy samples (EoE, control) were stained for mast cells by anti-tryptase and imaged using immunofluorescence; high-resolution whole tissue images were digitally assembled. Machine learning software was trained to identify, enumerate, and characterize mast cells, designated Mast Cell-Artificial Intelligence (MC-AI).
Results:
MC-AI enumerated cell counts with high accuracy. During active EoE, epithelial mast cells increased and lamina propria (LP) mast cells decreased. In controls and EoE remission patients, papillae had the highest mast cell density and negatively correlated with epithelial mast cell density. Mast cell density in the epithelium and papillae correlated with the degree of epithelial eosinophilic inflammation, basal zone hyperplasia, and LP fibrosis. MC-AI detected greater mast cell degranulation in the epithelium, papillae, and LP in EoE patients compared with control individuals. Mast cells were localized further from the basement membrane in active EoE than EoE remission and control individuals but were closer than eosinophils to the basement membrane in active EoE.
Conclusion:
Using MC-AI, we identified a distinct population of homeostatic esophageal papillae mast cells; during active EoE, this population decreases, undergoes degranulation, negatively correlates with epithelial mast cell levels, and significantly correlates with distinct histologic features. Overall, MC-AI provides a means to understand the potential involvement of mast cells in EoE and other disorders.
Keywords: eosinophilic esophagitis, mast cells, artificial intelligence, machine learning, papillae
Graphical Abstract

Introduction
Eosinophilic esophagitis (EoE) is a food-induced allergic inflammatory disease of the esophagus. Although rare, the prevalence of EoE is increasing with current estimates being 56 cases per 100,000 persons(1, 2). Active disease is determined by upper endoscopy, and the pathologic diagnosis is defined by at least 15 eosinophils per high-power field (eosinophils/hpf [eos/hpf]) identified on esophageal biopsies, yet recent data indicate that eosinophils are not involved in the clinical manifestations of eosinophilic gastrointestinal diseases, which calls attention to the potential pathogenic role of other cell populations(3–5). Notably, there is concurrent mastocytosis and some evidence of mast cell degranulation in the esophageal epithelium(6–8). Furthermore, the density of mast cells correlates more highly with certain symptoms and histologic features than eosinophils, suggesting that mast cells are clinically relevant and involved in disease pathogenesis, including esophageal epithelial barrier disruption(9–13). Unlike eosinophils, which do not reside in the esophageal epithelium in healthy states, mast cells exist in small numbers in the esophageal epithelium and in the esophageal lamina propria (LP) during homeostasis(8). Furthermore, in active disease, they produce inflammatory mediators such as IL-13 which has been shown to be an essential driver of EoE (14, 15).
Herein, we developed a machine learning segmentation protocol for localizing and characterizing esophageal mast cells, including their degranulation, and we applied it to further understand the potential role of mast cells in EoE.
Methods
Patients
The Cincinnati Children’s Hospital Medical Center (CCHMC) institutional review board approved all human studies, and subjects provided written consent. Active EoE was defined as patients whose esophageal biopsy had peak eosinophil count ≥15 eos/hpf. EoE remission was defined as patients with a history of EoE diagnosis whose current esophageal biopsy had a peak eosinophil count <15 eos/hpf. Control patients were defined as those who underwent esophageal biopsy for gastrointestinal symptoms, including those with gastro-esophageal reflux, with no prior history of EoE and had a peak eosinophil count ≤1 eos/hpf. Seventy-four patients were included in the study (34 active EoE, 20 EoE remission, 20 control). All biopsies were taken from the distal esophagus. Patient demographics are listed in Table S1.
Immunofluorescence (IF)
Human esophageal biopsies from the Cincinnati Center for Eosinophilic Disorders (CCED) biorepository were randomly selected without consideration of sex, race, atopic status or treatment. Formalin-fixed, paraffin-embedded slides were first deparaffinized with xylene, subjected to graded ethanol washes and subsequent antigen retrieval with antigen retrieval buffer under pressurized conditions, washed in PBS & Triton (0.2%), and blocked in 10% donkey serum in PBS. Biopsies were incubated with primary antibodies (1:50) (anti-tryptase, mouse IgG1 monoclonal antibody (Biolegend)) overnight at 4°C; isotype antibodies (anti-IgG1) were used as negative controls. Biopsies were then incubated for 1 hour with Hoechst for nuclear staining and fluorescent secondary antibodies (donkey anti-mouse Alexa Fluor 488). Sequential, partially overlapping images were taken on a Nikon A1R LUN-V inverted confocal microscope at 40X magnification and stitched together into multipoint, whole biopsy images.
Mast cell training and validation using Segment.ai.
NIS.ai is a machine learning add-on package for Nikon Elements (Nikon, Tokyo, Japan) that allows automation of processes that were previously difficult to achieve by conventional morphometric methods. One feature of NIS.ai is that Segment.ai uses a pre-developed machine learning algorithm that can be trained to recognize structures of interest. Segment.ai software was trained to recognize mast cells according to guidance from the manufacturer. Mast cells were identified by the presence of any tryptase staining around an identifiable nucleus. For Segment.ai to optimally identify mast cells, high-resolution confocal images were taken at 40X hpf, and then Elements software was used to digitally stitch these images together to assemble a whole biopsy section composite image on which Segment.ai was then applied. To train Segment.ai to identify mast cells, mast cells were hand traced (S.Z.) in whole biopsy images (from 1 control patient and 1 patient with active EoE) and used for the training set. Subsequently, 17 biopsies (n = 8 controls; n = 9 active EoE) were employed as a test set to compare manual counting– and Segment.ai-based mast cells counts. To capture mast cells more accurately, post Segment.ai–identified mast cells were modified with “close” and “dilate” functions, and the area of mast cells was restricted to 10–200-μm2 sizes.
Mast cell density and degranulation
Area measurements were first calculated with a general analysis formula based on nuclear staining using Elements software (Nikon, Tokyo, Japan). Low-level whole tissue autofluorescence at 651 nm wavelength was used to manually separate the epithelium, papillae, and LP. Esophageal papillae were defined as any LP that projected past two points of basement membrane (bisectional) and areas of LP that were surrounded by epithelium (cross-sectional). To determine spatial distribution, the distance from the center of MC-AI–identified mast cells to the manually identified basement membrane was measured.
Subsequently, a separate protocol was trained on 1 active EoE biopsy section to detect degranulated mast cells (hand traced by S.Z.). Degranulated mast cells were identified as mast cells with tryptase that were not well circumscribed. This was termed degranulated MC-AI. A second method used for identifying degranulation was using fluorescence intensity thresholding to identify all tryptase staining on biopsy sections and then subtracting mast cells identified by the original MC-AI protocol to approximate extracellular tryptase. A third method used the mean fluorescence intensity (MFI) of MC-AI–identified mast cells to approximate mast cell degranulation, as degranulation of mast cells should result in decreased tryptase MFI.
Eosinophil density
Eosinophil autofluorescence in IF at 544 nm wavelength was observed if the channel was left open without any additional antibody staining (16). This autofluorescence was used to identify eosinophils for enumeration. Eosinophils identified in one active EoE biopsy were hand traced (S.Z.), and Segment.ai was trained to recognize these eosinophils.
Histology Scoring System (HSS)
The HSS evaluates 8 histologic features of eosinophilic esophagitis, specifically eosinophilic inflammation (EI), basal zone hyperplasia (BZH), eosinophilic abscesses (EA), eosinophilic surface layering (ESL), dilated intercellular spaces (DIS), surface epithelial alteration (SEA), dyskeratotic epithelial cells (DEC), and LP fibrosis (LPF)(17). The HSS contains a 4-point scale from 0 (normal) to 3 (most severe/extensive) for grade (severity) and stage (extent) of each feature, which totals a maximum score of 24 for grade or stage. The sum of the scores is divided by 24 for the final grade or stage score if all features were evaluable. If all features were not evaluable, the observed sum is divided by the number of evaluable features multiplied by 3.
Statistical analyses
GraphPad Prism 9.5 (GraphPad Software, San Diego, California) was used for all statistical analyses. Linear regression was used for correlation analyses. The Mann-Whitney U test was used for non-parametric comparisons between 2 categories.
Results
Machine learning identification of mast cells reveals dynamic mast cell density as a function of location and EoE disease activity.
Human esophageal biopsy sections were stained with a nuclear dye (Hoechst), and anti-tryptase antibody and digital images were stitched together to identify mast cells manually and by Segment.ai (Figure 1A). MC-AI–identified mast cells positively correlated with manually identified (S.Z.) mast cells (n = 17 biopsy sections, R2 = 0.95, p<0.0001) (Figure 1B). Manual mast cell counts correlated with mast cell counts independently performed by a trained pathologist (R2=0.98, p<0.0001).
Figure 1. MC-AI method and MC-AI–identified MC density as a function of disease state.

A. Digitally stitched whole biopsy immunofluorescence of human esophageal tissue, multiple 40X high-powered fields (hpf). Nuclear (blue) and tryptase (yellow) staining for mast cells (MCs). Image from one representative biopsy section; 40X hpf showing MCs stained for tryptase (left) and Segment.ai (MC-AI)–identified MCs (right). B. Correlation between manual and MC-AI counting of epithelial MCs (simple linear regression), n = 17 biopsy sections. C. Epithelial MC density in control (n = 21 patients), EoE remission (Remission, n = 20 patients), and active EoE (Active, n = 36 patients) (left) and lamina propria (LP) MC density in control (n = 6 patients), EoE remission (n = 14 patients), and active EoE (n = 20 patients) (right); markers represent individual patients, and bars represent the mean. Statistical differences between groups *p < 0.0332, **p < 0.0021, ***p < 0.0002, ****p < 0.0001, ns = not significant.
MC-AI enabled quantification of mast cell density as a function of EoE disease activity (Table 1). There was an increase in epithelial mast cell density in active EoE compared to control (p < 0.0001) and EoE remission (p < 0.0001) (Figure 1C). There was a decrease in LP mast cell density in active EoE compared to control (p = 0.04) and EoE remission (p = 0.004).
Table 1.
Mast cell density (cells/mm2) by location and disease state
|
|
||||
|---|---|---|---|---|
| Control | Remission | Active | p value | |
| Epithelium | 9 (mean) | 22 | 124 | p < 0.0001 |
| 10 (median) | 8 | 104 | ||
| 0–25 (range) | 1–155 | 9–409 | ||
|
| ||||
| n | 21 | 20 | 36 | |
| Patients | 20 | 20 | 34 | |
|
| ||||
| Papillae | 536 | 291 | 125 | p < 0.0001 |
| 591 | 301 | 79 | ||
| 0–1,386 | 0–601 | 0–737 | ||
|
| ||||
| n | 19 | 18 | 35 | |
| Patients | 18 | 18 | 33 | |
|
| ||||
| LP | 123 | 68 | 49 | p = 0.0069 |
| 81 | 59 | 33 | ||
| 22–269 | 33–132 | 6–294 | ||
|
| ||||
| n | 6 | 14 | 20 | |
| Patients | 5 | 14 | 18 | |
Active, active eosinophilic esophagitis; Control, non-eosinophilic esophagitis; LP, lamina propria; n, number of biopsy sections; Remission, eosinophilic esophagitis in remission.
Kruskal-Wallis test used for calculation of p value.
Papillae-resident mast cells and their densities as a function of EoE disease activity
Human esophageal tissue was found to have low-level autofluorescence at 651 nm wavelength that distinguished the epithelium from the LP (Figure S1). The LP of the esophagus had papillae, defined as projections of LP into the epithelium. E-cadherin staining, an epithelial marker, showed staining only in the epithelium, which confirmed the separation of the epithelium from the papillae and LP as seen with autofluorescence (Figure 2A). The low-level autofluorescence facilitated tracing of esophageal papillae, allowing separation of mast cells residing in the epithelium from the papillae (Figure 2B). The compartment with the highest mast cell density in control and EoE remission biopsy sections was the papillae, followed by the LP and then the epithelium (Figure 2C). In active EoE, there was no difference in mast cell density between the epithelial and papillary compartments (p = 0.34). Compared to control, the papillary mast cell density is lower in EoE remission (p=0.02) and active EoE (p<0.0001) (Figure S2). There was a negative correlation between epithelial and papillary mast cell density across all disease states (R2 = 0.4, p < 0.0001) (Figure 2D).
Figure 2. Papillae and dynamic changes of MC-AI–identified papillary MC density as a function of disease state.

A. Immunofluorescence of E-cadherin (left, red) representing esophageal epithelium, low-level autofluorescence at 651-nm wavelength (middle, white), and their overlay (right). Arrowhead: papillae. B. Immunofluorescence of esophageal epithelium with nuclear (blue) and mast cell (MC) tryptase (yellow) staining (left), low-level autofluorescence at 651 nm (middle, white), and manual tracing of papillae overlaid with MC tryptase (yellow) (right). A-B images are crops of digitally stitched images of composite overlapping 40X images of one representative biopsy section each. C. MC density in control papillae (n = 19 biopsy sections), epithelium (n = 21), and lamina propria (n = 6) (left); EoE remission (Remission) papillae (n = 18), epithelium (n = 20), and lamina propria (n = 14) (middle); and active EoE (Active) papillae (n = 35), epithelium (n = 36), and lamina propria (n = 20) (right). Markers represent individual biopsy sections, and bars represent the mean. D. Correlation of log-transformed values between papillary and epithelial MC density across all disease states; markers represent individual biopsy sections. Statistical difference between groups; *p < 0.0332, **p < 0.0021; ***p < 0.0002, ****p < 0.0001, ns = not significant.
We aimed to determine whether papillary mast cells are potentially mast cell progenitors, perhaps derived from the circulation, as papillae are highly vascular structures(18). We hypothesized that if papillary mast cells were progenitors entering from the vasculature present in the papillae, then some of the papillary mast cells would be CD34 positive. Human esophageal biopsy sections were co-stained with anti-tryptase and anti-CD34, a marker for hematopoietic progenitors, including mast cell progenitors(19, 20) (Figure S3A). Out of the 4 biopsy sections, 9 papillary mast cells were identified, none of which were CD34 positive (thus, at least ~90% of papillary mast cells do not express CD34 (Figure S3B). Epithelial mast cells (n=44) were also CD34 negative (data not shown). There were no CD34 positive, tryptase negative progenitor cells identified.
Mast cell density associates with EoE histologic features
Subsequently, we aimed to determine whether mast cell density in the different compartments (epithelium papillae, LP) was associated with disease pathology. To test this hypothesis, epithelial, papillary, and LP mast cell density were correlated with HSS grades (Figure 3A) and stages (Figure 3B) in patients across all disease states (active EoE, EoE remission, control). Across all disease states, epithelial mast cell density was found to be associated with HSS features, including eosinophilic inflammation grade (p < 0.0001) and stage (p < 0.0001), basal zone hyperplasia grade (p < 0.0001) and stage (p < 0.0001), eosinophilic abscess stage (p = 0.029), LP fibrosis grade (p = 0.0076) and stage (p = 0.011), and total HSS score grade (p < 0.0001) and stage (p < 0.0001). Across all disease states, papillary mast cell density was found to be negatively associated with HSS features, including eosinophilic inflammation grade (p = 0.0003) and stage (p = 0.0009), basal zone hyperplasia grade (p = 0.0042) and stage (p = 0.032), LP fibrosis grade (p = 0.031) and stage (p = 0.022), and total HSS score grade (p = 0.0077) and stage (p = 0.0029). In contrast, LP mast cell density did not significantly correlate with any HSS features. Of note, eosinophil density correlated with eosinophilic inflammation grade (p = 0.0056) and stage (p = 0.0003), basal zone hyperplasia grade (p = 0.0016) and stage (p = 0.0041), total HSS score grade (p = 0.018) and stage (p = 0.0071); papillae eosinophil density correlated with eosinophil surface layering grade (p = 0.012) and stage (p = 0.0001); lamina propria eosinophil density correlated with basal zone hyperplasia grade (p = 0.029) and eosinophil surface layering grade (p = 0.002) and stage (p = 0.002) (Figure S4A).
Figure 3. Correlation of MC-AI–identified MC density and Histology Scoring System (HSS) scores across all disease states (−log 10–adjusted p values).
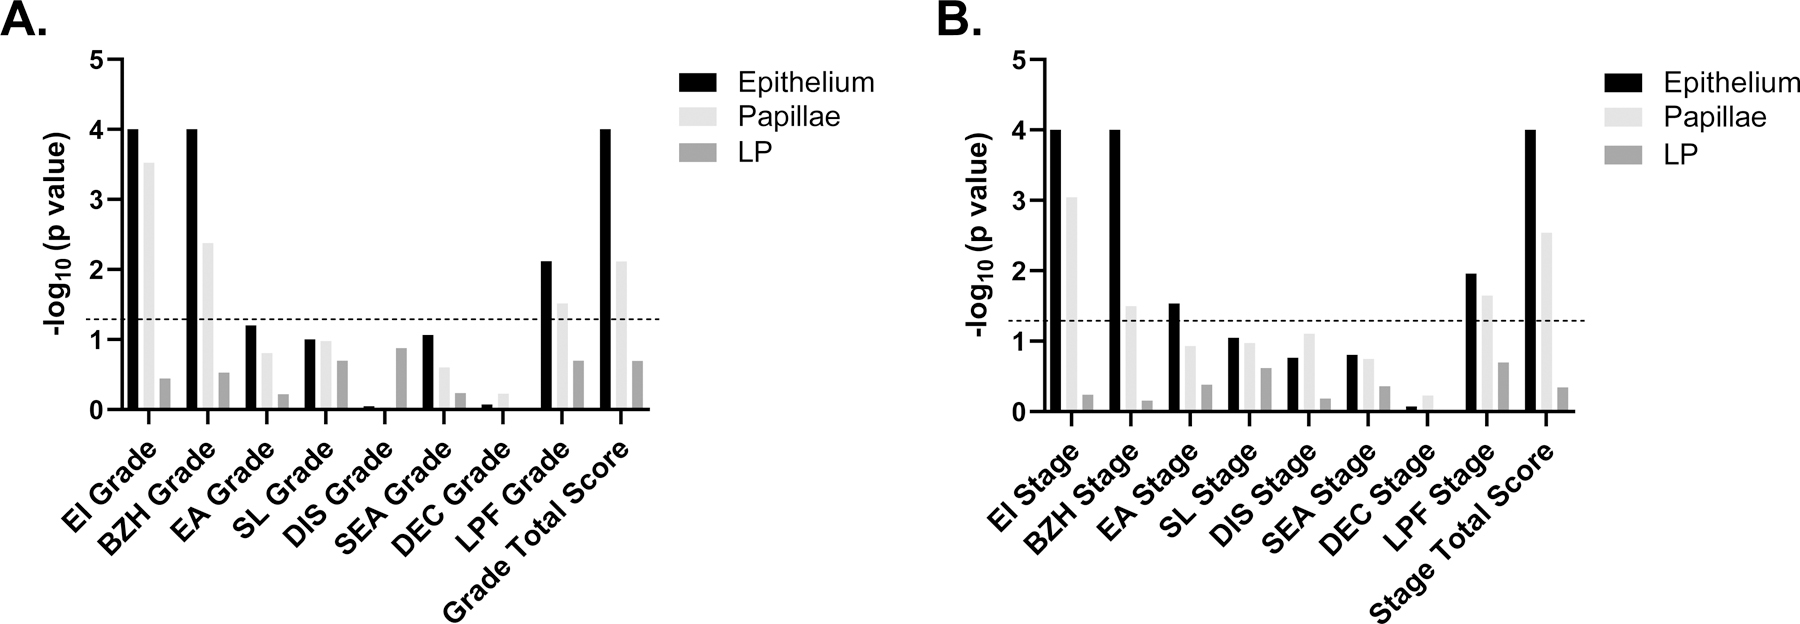
A. Histology Scoring System (HSS) grade scores. B. HSS stage. Dotted line represents −log 10–adjusted p value of 0.05. Simple linear regression was used for analysis. LP, lamina propria, EI, eosinophil inflammation, BZH, basal zone hyperplasia, EA, eosinophil abscess, SL, eosinophil surface layering, DIS, dilated intercellular spaces, SEA, surface epithelial alteration, DEC, dyskeratotic epithelial cells, LPF, lamina propria fibrosis.
Evaluating mast cell degranulation with MC-AI and extracellular tryptase
We next investigated mast cell degranulation in esophageal tissue, aiming to initially train Segment.ai to recognize degranulated mast cells. We manually outlined degranulated mast cells in a single biopsy section, trained Segment.ai, and designated this protocol Degranulated MC-AI (Figure 4A). Degranulated mast cell counts for the trained degranulated MC-AI protocol correlated with manual counts (R2 = 0.71, p = 0.0003, n = 13), although the counts were higher in the Degranulated MC-AI protocol (Figure 4B). Degranulated mast cell density, as identified by Degranulated MC-AI, was higher in EoE than control (Figure 4C, p = 0.002, n = 6 EoE, 7 control).
Figure 4. Degranulated MC-AI.

A. Crop of digitally stitched whole biopsy immunofluorescence of human esophageal tissue, multiple 40X high-powered fields (left). Nuclear (blue) and tryptase (yellow) staining for mast cells (MCs). Degranulated MC-AI–identified degranulated MCs (cyan) (right). B. Correlation between manual and Degranulated MC-AI–identified degranulated MCs (simple linear regression, n = 13 biopsy sections). C. Degranulated MC-AI–identified degranulated MC density in active EoE (Active, n = 6 biopsy sections) and control (n = 7). D. MC-AI–identified MCs were used to identify intracellular tryptase (yellow, left); tryptase was identified by fluorescence intensity thresholding of anti-tryptase (right), and intracellular tryptase (left) was subtracted to identify extracellular tryptase (white; arrowhead; middle); merged areas of intracellular and extracellular tryptase (right). E. Area of extracellular tryptase per biopsy section as identified using method in D in active EoE (n = 9 biopsy sections) and controls (n = 8). C and E. Markers represent individual patient biopsy sections; bars represent the median. F. Tryptase mean fluorescence intensity (MFI) of individual MCs in esophageal epithelium in active EoE (n = 2,858 MCs), EoE remission (Remission, n= 445), and control (n= 119) patients (left); in papillae in active EoE (n = 95), EoE remission (n = 69), and control (n = 61) patients; and in lamina propria (LP) in active EoE (n = 202), EoE remission (n = 325), and control (n = 174) patients. Box represents 25–75% of values, lines represent 1–100%. Statistical differences between groups *p < 0.0332, **p < 0.0021, ***p < 0.0002, ****p < 0.0001, ns = not significant.
An alternative method was also used to capture degranulation. Intensity thresholding was used to identify all tryptase staining on biopsy sections; the mast cell areas as identified by MC-AI were subtracted from the tryptase area to identify extracellular tryptase (Figure 4D). The total area of extracellular tryptase per biopsy section was higher in EoE than control (Figure 4E, p = 0.0016, n = 9 EoE, 8 control).
For a third method, we hypothesized that tryptase mean fluorescence intensity (MFI) per mast cell would be significantly lower in EoE than control as a result of mast cell degranulation. MFI of individual mast cells as identified by MC-AI were collected and compared across esophageal location and disease state (Table 2). Tryptase MFI was lower in active EoE (p < 0.0001) and EoE remission (p < 0.0001) than control in the epithelium, papillae and LP (Figure 4F). Of note, on the HSS, average papillary mast cell tryptase MFI correlated with eosinophilic inflammation grade (p = 0.002) and stage (p = 0.018), basal zone hyperplasia grade (p = 0.006) and stage (p = 0.0064), and total HSS score stage (p = 0.014); average lamina propria mast cell tryptase MFI correlated with basal zone hyperplasia grade (p = 0.004) and stage (p = 0.0013) (Figure S4B).
Table 2.
Mast cell tryptase mean fluorescence intensity by location and disease state.
|
|
||||
|---|---|---|---|---|
| Control | Remission | Active | p value | |
| Epithelium | 995 (mean) | 708 | 775 | p < 0.0001 |
| 901(median) | 589 | 648 | ||
| 143–2352 (range) | 114–3072 | 61–3032 | ||
| n | 119 | 445 | 2,858 | |
|
| ||||
| Papillae | 1155 | 1210 | 792 | p < 0.0001 |
| 1070 | 1084 | 632 | ||
| 315–2262 | 169–2822 | 103–2399 | ||
| n | 61 | 69 | 95 | |
|
| ||||
| LP | 1448 | 1279 | 923 | p < 0.0001 |
| 1429 | 1105 | 824 | ||
| 251–2949 | 206–3100 | 114–2687 | ||
| n | 174 | 325 | 202 | |
LP, lamina propria; n, number of mast cells.
Kruskal-Wallis test used for calculation of p value.
Correlating mast cell and eosinophil densities in the epithelium and lamina propria
Epithelial mast cell counts positively correlated with peak distal eosinophils per hpf as identified by hematoxylin and eosin (H&E) staining across all disease states (R2 = 0.46, p < 0.0001, n = 77 biopsy sections) (Figure S5A) and in active EoE (R2 = 0.14, p < 0.03, n = 36 biopsy sections) (Figure S5B). Eosinophil counts were manually enumerated using tissue autofluorescence, which showed a strong positive correlation with mast cell density across all disease states (R2 = 0.66, p < 0.0001, n = 39 biopsy sections) (Figure 5A) and in active EoE (R2 = 0.49, p < 0.002, n = 17 biopsy sections) (Figure 5B). In contrast, LP mast cell density negatively correlated with eosinophil density across all disease states (R2 = 0.26, p = 0.04, n = 16 biopsy sections) (Figure 5C) and in active EoE (R2 = 0.56, p = 0.09, n = 6 biopsy sections) (Figure 5D).
Figure 5. MC-AI–identified MC-eosinophil correlations.

Correlation between epithelial eosinophil density (eos, manually enumerated, identified by eosinophil autofluorescence at 532-nm wavelength) and mast cell (MC density) from the same biopsy across all disease states (active EoE, remission EoE, controls) (A) and in active eosinophilic esophagitis (EoE) (Active, B). Correlation between lamina propria (LP) eosinophil density (manually enumerated) and MC density from same biopsy across all disease states (active EoE, remission EoE, controls) (C) and in active EoE (D). Correlations are by simple linear regression.
Mast cell and eosinophil spatial distribution in the epithelium
Next, we sought to characterize the spatial distribution of mast cells in the esophageal epithelium, as it appeared from biopsy sections that epithelial mast cells were located closer to the basement membrane in control patients and closer to the luminal surface in patients with EoE (active, remission) (Figure 6A). To quantify, we measured the distance of each mast cell from its center to the basement membrane; mast cells were significantly further from the basement membrane in active EoE than in control or EoE remission (Figure 6B).
Figure 6. MC and eosinophil epithelial distribution.

A. Digitally stitched whole biopsy immunofluorescence of human esophageal tissue in control (left) and active eosinophilic esophagitis (EoE) (Active, right) patient, multiple 40X high-powered fields. Nuclear (blue) and MC-AI–identified mast cell (MC, yellow) staining. White dashed line: basement membrane. Arrowheads: MCs. B. Distance of individual MCs as identified by MC-AI from the basement membrane in control (n = 20 MCs), EoE remission (Remission, n = 289), and active EoE (n = 514) patients. C. Immunofluorescence of human esophageal tissue in active EoE. Arrow: Eos-AI–identified eosinophils (eos). Arrowhead: MC-AI–identified MCs. D. Correlation between manual and Segment.ai counting of eosinophils (n = 39 biopsy sections) by simple linear regression. E. Distance of eosinophils (n = 438 cells) and MCs (n = 501 cells) from the basement membrane as identified by Eos-AI and MC-AI, respectively. Cell counts were derived from n = 7 patient samples. Boxes represent 25–75% of values; lines represent 1–100%. Statistical difference between the groups *p < 0.0332, **p < 0.0021; ***p < 0.0002, ****p < 0.0001, ns = not significant.
In active EoE, eosinophils appeared to be located further from the basement membrane than were mast cells (Figure 6C). To quantify, we trained Segment.ai to recognize eosinophils (see methods). The Eos-AI protocol–identified eosinophils correlated with manually identified eosinophils (p < 0.0001) (Figure 6D). Eosinophils were found to be further from the basement membrane than were mast cells in active EoE (p < 0.0001) (Figure 6E).
Discussion
EoE has a strong Th2 signature with evidence of epithelial mastocytosis, but the inability to identify mast cells by H&E staining makes studying these tissue-specific cells difficult. Here, we aimed to further study the spatial distribution and characteristics of esophageal mast cells in EoE by training a machine learning software (Segment.ai) to identify and characterize mast cells. This MC-AI protocol confirmed epithelial mastocytosis, found a decrease in LP mast cells in active EoE, and identified a high density of mast cells in esophageal papillae. The papillae-residing mast cells were shown to dramatically decrease in active disease and negatively correlate with epithelial mastocytosis, suggesting that papillary mast cells may be a reservoir for epithelial mast cells. These papillary mast cells were largely CD34 negative, suggesting that they are not mast cell progenitors from the peripheral circulation. Both epithelial and papillary mast cells are associated with histologic abnormalities in EoE. Additionally, a second protocol, Degranulated MC-AI, identified mast cell degranulation and determined increased mast cell degranulation in the epithelium, papillae, and LP in active EoE.
The NIS-Elements NIS.ai software contains different features that allow enhanced acquisition, visualization, and analysis (21). One such feature is Segment.ai, which uses supervised machine learning to identify features of interest. Segment.ai was separately trained to identify mast cells and their degranulation status, and these trained protocols were named MC-AI and Degranulated MC-AI. Combined with high resolution, digitally stitched whole biopsy section IF imaging, these protocols allowed elucidation of novel details regarding mast cell characteristics in human esophageal tissue, including accurately enumerating mast cells and their degree of degranulation. Mast cells are tissue-resident cells that are known to circulate in the blood as mast cell progenitors and terminally differentiate in tissue(22, 23), which have made them difficult to study. This MC-AI protocol provides a novel way to characterize these tissue-resident cells on a single cell level along with their spatial distribution without relying on visual inspection and manual enumeration. Additionally, this type of machine learning technology can be employed to further our understanding of other tissue resident cells such as innate lymphoid cells type 2 (ILC2) that may be involved in EoE. Although MC-AI protocols captured information, there were limitations, such as these protocols likely not capturing every mast cell, some identified cells potentially not being true mast cells, and some captured cells potentially not being whole (MC-AI) or degranulated (Degranulated MC-AI) mast cells.
Esophageal papillae are highly vascular regions of the LP that protrude into the epithelium(18). We observed that the far-red channel had whole tissue autofluorescence that accurately distinguished the epithelium from LP, which was confirmed by E-cadherin staining. By using this autofluorescence, papillae were manually traced on esophageal biopsies, which helped to delineate mast cells that resided in the papillae versus the epithelium. After separation of the papillae from the epithelium and LP, mast cell density was shown to be highest in the papillae compared to the epithelium and LP in control patients. In EoE (active and remission), this density decreased as epithelial mast cell density increased. Furthermore, a negative correlation was found between papillary mast cell density and epithelial mast cell density, suggesting that papillary mast cells are a possible source of epithelial mast cells. Some of the decrease in density could be due to increase in papillae size, which is documented in EoE, but the fold change in mast cell density is larger than the increase in area (data not shown). Furthermore, the high papillary mast cell density in control patients may represent a homeostatic population of mast cells that then serves as a reservoir for potentially pathogenic epithelial mast cells seen in active EoE. Consistent with that, successful therapies resulting in EoE remission increased papillary mast cell density, although not back to the levels seen in control patients.
Previous work from our laboratory showed that there is in situ proliferation of mast cells in the epithelium in EoE(14). The data presented here show that epithelial mast cells may originate from the mast cells in the esophageal papillae. This population of mast cells may be related to the transitional population of mast cells that have been found through single-cell RNA sequencing analysis in nasal polyps(24).
Given the vascular nature of papillae, it is conceivable that papillary mast cells are mast cell progenitors that have migrated into local tissue, as mast cells are tissue-resident cells that are known to circulate in the blood as mast cell progenitors and terminally differentiate in tissue(22, 23). However, there were no CD34+ cells found in esophageal tissue other than the endothelium. We detected no CD34+ papillary mast cells, but because the number of mast cells analyzed was small, we can only state that at least 90% of these cells are not progenitors. Mast cell progenitors are known to be CD34+(25), but there is mixed evidence regarding CD34 expression on mast cells in tissue(26). One study did not detect CD34 expression on mast cells in nasal polyps by flow cytometry(24), whereas another identified CD34+tryptase+ mast cells in lung alveolar parenchyma of children with viral lower respiratory tract infections(27).
MC-AI demonstrated increased mast cell density in active EoE, which confirms previous findings of epithelial mastocytosis(6, 8). Previous data regarding mast cell density in the LP was mixed, with one study showing no change in EoE(8) and one showing a decrease(28). Our data demonstrated a decrease in LP mast cell density during active EoE. Further examination of esophageal mast cells showed a more luminal distribution of mast cells from the basement membrane in active disease compared to control. The positive correlation between mast cell counts and peak eosinophil counts in EoE is consistent with previous literature (6, 8).
To investigate the potential effect of mast cells on histologic features of EoE, linear correlations were performed between epithelial, papillary, and LP mast cell density and HSS scores. Epithelial and papillary mast cell density, in contrast to LP mast cell density, correlated with eosinophilic inflammation, basal zone hyperplasia, LP fibrosis, and total HSS score. These findings suggest that both epithelial and papillary mast cells likely contribute to EoE disease pathology. While epithelial mast cells positively correlate with HSS, papillary mast cells negatively correlate with HSS. This could suggest a regulatory role of papillary mast cells which inhibit EoE pathology or it could suggest a reservoir of mast cells which exist in homeostasis that migrate into the epithelium and transition into pathogenic/inflammatory mast cells. Identification of a signal that causes transition of regulatory/homeostatic mast cells into an inflammatory type mast cell is an area for future study.
Mast cells may be contributing to pathology through degranulation; accordingly, Segment.ai was used to develop Degranulated MC-AI. The density of degranulated mast cells (both Degranulated MC-AI and manually enumerated) was higher in EoE that control, which is consistent with previous data(6). Our secondary approach of examining degranulated mast cells by enumerating the total amount of tryptase area from the total area of mast cells as identified by MC-AI also demonstrated increased degranulation in EoE compared to control. To further substantiate these findings, we reasoned that the MFI of cell-associated tryptase should be inversely proportional to the degree of MC degranulation. Indeed, tryptase MFI was lower in mast cells in the epithelium in active EoE than control. Interestingly, tryptase MFI was lower in the epithelium in EoE remission as well, suggesting persistent degranulation, consistent with recent single-cell RNA sequencing of esophageal mast cells(14). Furthermore, the presence of mastocytosis in the epithelium in EoE remission suggests a pathologic role of mast cells even in disease remission. Although the mast cell density in the LP did not increase in EoE, tryptase MFI was significantly lower in EoE remission and even more so in active EoE, suggesting mast cell degranulation in the LP in both active EoE and EoE remission, which may contribute to LP fibrosis. Another future area of study will be to correlate epithelial, papillary, and lamina propria mast cell densities and level of mast cell degranulation with clinical parameters and trajectories.
The characterizations enabled by the MC-AI and Degranulated MC-AI protocols revealed intriguing patterns of mast cell correlation and distribution. Mast cell correlation with basal zone hyperplasia has been previously described(7). Concurrently, mast cells were found to reside near the basal layer in control esophageal epithelium but were located more luminally in active EoE esophageal epithelium. This localization potentially is related to the basal zone hyperplasia seen in EoE, as well as regional production of CCL26 and other chemokines by the suprabasal epithelium(17). Mast cell density was found to moderately correlate with peak distal eosinophils/hpf. Segment.ai was trained to identify eosinophils by autofluorescence, and eosinophils were found to be distributed further than mast cells from the basement membrane.
One limitation of this study is the lack of LP in some of the esophageal biopsy sections. the amount of LP area is significantly higher in active disease than EoE remission or control biopsy sections. A second limitation is that although tryptase staining will identify both the MCT and MCTC subtypes of mast cells, there may be tryptase negative mast cells or degranulated mast cells which are missed using this method. Another limitation is that, in addition to degranulated mast cells, low tryptase MFI mast cells may represent mast cells at various levels of maturity or a potential artifact from histologic preparations.
In conclusion, we have performed an in-depth spatial analysis of esophageal mast cells in EoE by developing a new method that combines high-resolution, whole biopsy section immunofluorescence images and machine learning–based mast cell identification protocol (MC-AI). We identified a new population of papillary mast cells that was present in high density in control, decreased significantly in EoE, negatively correlated with epithelial mast cells, were CD34 negative, and correlated with features of disease histology. Taken together, these evidence further suggest the pathologic role of mast cells in EoE and have potential implications for anti-mast cell therapy in EoE. Furthermore, the development of MC-AI is an original usage of artificial intelligence which has the potential to advance the understanding of mast cell associated inflammatory diseases, including eosinophilic esophagitis(29–31).
Supplementary Material
Clinical Implication:
We have developed a methodology for identifying, enumerating, and characterizing mast cells using artificial intelligence; this has been applied to decipher eosinophilic esophagitis and provides a platform approach for other diseases.
Capsule Summary:
A machine learning protocol for identifying mast cells, designated Mast Cell–Artificial Intelligence, readily identified spatially distinct and dynamic populations of mast cells in EoE, providing a platform to better understand this cell type in EoE and other diseases.
Acknowledgements and Sources of Funding:
NIH R01 AI045898 and AI124355 and the Campaign Urging Research For Eosinophilic Diseases (CURED) Foundation. We thank the Cincinnati Children’s Confocal Imaging Core (U54 DK126108) and the Digestive Diseases Research Core Center (P30 DK078392 (Bio-Imaging and Analysis Facility) for their assistance and Shawna Hottinger for editorial assistance.
Abbreviations:
- EoE
eosinophilic esophagitis
- MC
mast cells
- AI
artificial intelligence
Footnotes
Publisher's Disclaimer: This is a PDF file of an unedited manuscript that has been accepted for publication. As a service to our customers we are providing this early version of the manuscript. The manuscript will undergo copyediting, typesetting, and review of the resulting proof before it is published in its final form. Please note that during the production process errors may be discovered which could affect the content, and all legal disclaimers that apply to the journal pertain.
Conflict of Interest: M.E.R. is a consultant for Pulm One, Spoon Guru, ClostraBio, Serpin Pharm, Allakos, Celldex, Nexstone One, Santa Ana Bio, EnZen Therapeutics, Bristol Myers Squibb, Astra Zeneca, Pfizer, GlaxoSmith Kline, Regeneron/Sanofi, Revolo Biotherapeutics, and Guidepoint and has an equity interest in the first nine listed, and royalties from reslizumab (Teva Pharmaceuticals), PEESSv2 (Mapi Research Trust) and UpToDate. M.E.R. is an inventor of patents owned by Cincinnati Children’s Hospital. MHC is a consultant for Allakos, Arena/Pfizer, AstraZeneca, Calypso Biotech, EsoCap Biotech, GlaxoSmithKline, Receptos/Celgene/BMS, Regeneron Pharmaceuticals, Robarts Clinical Trials Inc./Alimentiv, Inc. and Shire, a Takeda company; has received license fees for use of the Eosinophilic Esophagitis Histology Scoring System. S.Z., J.M.C., and M.R. have no conflicts of interest.
References
- 1.Dellon ES. Epidemiology of eosinophilic esophagitis. Gastroenterol Clin North Am 2014;43(2):201–18. [DOI] [PMC free article] [PubMed] [Google Scholar]
- 2.Dellon ES, Hirano I. Epidemiology and Natural History of Eosinophilic Esophagitis. Gastroenterology 2018;154(2):319–32.e3. [DOI] [PMC free article] [PubMed] [Google Scholar]
- 3.Ben-Baruch Morgenstern N, Shoda T, Rochman Y, Caldwell JM, Collins MH, Mukkada V, et al. Local type 2 immunity in eosinophilic gastritis. J Allergy Clin Immunol 2023;152(1):136–44. [DOI] [PMC free article] [PubMed] [Google Scholar]
- 4.Dellon ES, Peterson KA, Mitlyng BL, Iuga A, Bookhout CE, Cortright LM, et al. Mepolizumab for treatment of adolescents and adults with eosinophilic oesophagitis: a multicentre, randomised, double-blind, placebo-controlled clinical trial. Gut 2023;72(10):1828–37. [DOI] [PMC free article] [PubMed] [Google Scholar]
- 5.Spergel JM, Rothenberg ME, Collins MH, Furuta GT, Markowitz JE, Fuchs G 3rd, et al. Reslizumab in children and adolescents with eosinophilic esophagitis: results of a double-blind, randomized, placebo-controlled trial. J Allergy Clin Immunol 2012;129(2):456–63, 63.e1–3. [DOI] [PubMed] [Google Scholar]
- 6.Abonia JP, Blanchard C, Butz BB, Rainey HF, Collins MH, Stringer K, et al. Involvement of mast cells in eosinophilic esophagitis. J Allergy Clin Immunol 2010;126(1):140–9. [DOI] [PMC free article] [PubMed] [Google Scholar]
- 7.Bolton SM, Kagalwalla AF, Arva NC, Wang MY, Amsden K, Melin-Aldana H, et al. Mast Cell Infiltration Is Associated With Persistent Symptoms and Endoscopic Abnormalities Despite Resolution of Eosinophilia in Pediatric Eosinophilic Esophagitis. Am J Gastroenterol 2020;115(2):224–33. [DOI] [PMC free article] [PubMed] [Google Scholar]
- 8.Aceves SS, Chen D, Newbury RO, Dohil R, Bastian JF, Broide DH. Mast cells infiltrate the esophageal smooth muscle in patients with eosinophilic esophagitis, express TGF-β1, and increase esophageal smooth muscle contraction. J Allergy Clin Immunol 2010;126(6):1198–204.e4. [DOI] [PubMed] [Google Scholar]
- 9.Blanchard C, Wang N, Stringer KF, Mishra A, Fulkerson PC, Abonia JP, et al. Eotaxin-3 and a uniquely conserved gene-expression profile in eosinophilic esophagitis. J Clin Invest 2006;116(2):536–47. [DOI] [PMC free article] [PubMed] [Google Scholar]
- 10.Kleuskens MTA, Bek MK, Al Halabi Y, Blokhuis BRJ, Diks MAP, Haasnoot ML, et al. Mast cells disrupt the function of the esophageal epithelial barrier. Mucosal Immunology. 2023. [DOI] [PubMed] [Google Scholar]
- 11.Zhang S, Shoda T, Aceves SS, Arva NC, Chehade M, Collins MH, et al. Mast cell-pain connection in eosinophilic esophagitis. Allergy. 2022;77(6):1895–9. [DOI] [PMC free article] [PubMed] [Google Scholar]
- 12.Alvarado D, Lu Y, Shoda T, Caldwell JM, Keler T, Rothenberg ME. Strong association of mast cells with eosinophilic esophagitis-specific signatures. Allergy. 2022. [DOI] [PMC free article] [PubMed] [Google Scholar]
- 13.Tappata M, Eluri S, Perjar I, Hollyfield J, Betancourt R, Randall C, et al. Association of mast cells with clinical, endoscopic, and histologic findings in adults with eosinophilic esophagitis. Allergy. 2018;73(10):2088–92. [DOI] [PMC free article] [PubMed] [Google Scholar]
- 14.Ben-Baruch Morgenstern N, Ballaban AY, Wen T, Shoda T, Caldwell JM, Kliewer K, et al. Single-cell RNA sequencing of mast cells in eosinophilic esophagitis reveals heterogeneity, local proliferation, and activation that persists in remission. J Allergy Clin Immunol 2022;149(6):2062–77. [DOI] [PMC free article] [PubMed] [Google Scholar]
- 15.Dellon ES, Rothenberg ME, Collins MH, Hirano I, Chehade M, Bredenoord AJ, et al. Dupilumab in Adults and Adolescents with Eosinophilic Esophagitis. New England Journal of Medicine. 2022;387(25):2317–30. [DOI] [PubMed] [Google Scholar]
- 16.Weil GJ, Chused TM. Eosinophil autofluorescence and its use in isolation and analysis of human eosinophils using flow microfluorometry. 1981. [PubMed] [Google Scholar]
- 17.Collins MH, Martin LJ, Alexander ES, Boyd JT, Sheridan R, He H, et al. Newly developed and validated eosinophilic esophagitis histology scoring system and evidence that it outperforms peak eosinophil count for disease diagnosis and monitoring. Dis Esophagus. 2017;30(3):1–8. [DOI] [PMC free article] [PubMed] [Google Scholar]
- 18.Maselli R, Inoue H, Ikeda H, Onimaru M, Yoshida A, Santi EG, et al. Microvasculature of the esophagus and gastroesophageal junction: Lesson learned from submucosal endoscopy. World J Gastrointest Endosc 2016;8(19):690–6. [DOI] [PMC free article] [PubMed] [Google Scholar]
- 19.Hallgren J, Gurish MF. Mast cell progenitor trafficking and maturation. Advances in experimental medicine and biology. 2011;716:14. [DOI] [PMC free article] [PubMed] [Google Scholar]
- 20.Silvestri F, Banavali S, Baccarani M, Preisler H. The CD34 hemopoietic progenitor cell associated antigen: biology and clinical applications. Haematologica. 1992;77(3):265–73. [PubMed] [Google Scholar]
- 21.NIS.ai Taking Microscope imaging and analysis to the next level Nikon [Available from: https://www.microscope.healthcare.nikon.com/products/software/nis-elements/nis-ai-1.
- 22.Gurish MF, Austen KF. Developmental origin and functional specialization of mast cell subsets. Immunity. 2012;37(1):25–33. [DOI] [PubMed] [Google Scholar]
- 23.Dahlin JS, Hallgren J. Mast cell progenitors: Origin, development and migration to tissues. Molecular Immunology. 2015;63(1):9–17. [DOI] [PubMed] [Google Scholar]
- 24.Dwyer DF, Ordovas-Montanes J, Allon SJ, Buchheit KM, Vukovic M, Derakhshan T, et al. Human airway mast cells proliferate and acquire distinct inflammation-driven phenotypes during type 2 inflammation. Science Immunology. 2021;6(56):eabb7221. [DOI] [PMC free article] [PubMed] [Google Scholar]
- 25.Dahlin JS, Malinovschi A, Öhrvik H, Sandelin M, Janson C, Alving K, et al. Lin- CD34hi CD117int/hi FcεRI+ cells in human blood constitute a rare population of mast cell progenitors. Blood. 2016;127(4):383–91. [DOI] [PMC free article] [PubMed] [Google Scholar]
- 26.Derakhshan T, Boyce JA, Dwyer DF. Defining mast cell differentiation and heterogeneity through single-cell transcriptomics analysis. J Allergy Clin Immunol 2022;150(4):739–47. [DOI] [PMC free article] [PubMed] [Google Scholar]
- 27.Andersson CK, Shikhagaie M, Mori M, Al-Garawi A, Reed JL, Humbles AA, et al. Distal respiratory tract viral infections in young children trigger a marked increase in alveolar mast cells. ERJ Open Res 2018;4(4). [DOI] [PMC free article] [PubMed] [Google Scholar]
- 28.Strasser DS, Seger S, Bussmann C, Pierlot GM, Groenen PMA, Stalder AK, et al. Eosinophilic oesophagitis: relevance of mast cell infiltration. Histopathology. 2018;73(3):454–63. [DOI] [PubMed] [Google Scholar]
- 29.Archila LR, Smith L, Sihvo HK, Westerling-Bui T, Koponen V, O’Sullivan DM, et al. Development and technical validation of an artificial intelligence model for quantitative analysis of histopathologic features of eosinophilic esophagitis. J Pathol Inform 2022;13:100144. [DOI] [PMC free article] [PubMed] [Google Scholar]
- 30.Ricaurte Archila L, Smith L, Sihvo HK, Koponen V, Jenkins SM, O’Sullivan DM, et al. Performance of an Artificial Intelligence Model for Recognition and Quantitation of Histologic Features of Eosinophilic Esophagitis on Biopsy Samples. Mod Pathol 2023;36(10):100285. [DOI] [PubMed] [Google Scholar]
- 31.Römmele C, Mendel R, Barrett C, Kiesl H, Rauber D, Rückert T, et al. An artificial intelligence algorithm is highly accurate for detecting endoscopic features of eosinophilic esophagitis. Sci Rep 2022;12(1):11115. [DOI] [PMC free article] [PubMed] [Google Scholar]
Associated Data
This section collects any data citations, data availability statements, or supplementary materials included in this article.