

Abstract
Concussions or mild traumatic brain injuries (mTBIs) are often described and diagnosed by the acute signs and symptoms of neurological dysfunction including weakness, dizziness, disorientation, headaches, and altered mental state. The cellular and physiological mechanisms of neurological dysfunction and acute symptoms are unclear. Spreading depolarizations (SDs) occur after severe TBIs and have recently been identified in closed-skull mouse models of mTBIs. SDs are massive waves of complete depolarization that result in suppression of cortical activity for multiple minutes. Despite the clear disruption of brain physiology after SDs, the role of SDs in the acute neurological dysfunction and acute behavioral deficits following mTBIs remains unclear. We used a closed-skull mouse model of mTBI and a series of behavioral tasks collectively scored as the neurological severity score (NSS) to assess acute behavior. Our results indicate that mTBIs are associated with significant behavioral deficits in the open field and NSS tasks relative to sham-condition animals. The behavioral deficits associated with the mTBI recovered within 3 h. We show here that the presence of mTBI-induced bilateral SDs were significantly associated with the acute behavioral deficits. To identify the role of SDs in the acute behavioral deficits, we used exogenous potassium and optogenetic approaches to induce SDs in the absence of the mTBI. Bilateral SDs alone were associated with similar behavioral deficits in the open field and NSS tasks. Collectively, these studies demonstrate that bilateral SDs are linked to the acute behavioral deficits associated with mTBIs.
Keywords: balance beam, cortical spreading depression, motor deficits, optogenetics, startle response
Introduction
Mild traumatic brain injuries (mTBIs) are diagnosed by symptoms of neurological dysfunction. Individuals with an mTBI can have a variety of acute clinical symptoms, including weakness, dizziness, disorientation, headache, and altered mental state.1,2 Symptoms of mTBIs have been attributed to neurological dysfunction because gross structural damage is rarely seen in these mild injuries.3 Typically, the clinical symptoms of neurological impairment spontaneously recover within a few days to weeks.4–6 The neurological impairment is thought to be due to large imbalances in neurochemicals and brain metabolism that have been conceptualized as the neurometabolic cascade.7 mTBIs initiate a large accumulation of extracellular K+ and glutamate, and an increase in intracellular Ca2+.8,9 Re-establishment of the ionic gradients and neurotransmitters requires a large metabolic load.10 This metabolic load is associated with increases in glucose uptake into the brain.11 Many of these imbalances are resolved within a few minutes to hours after an mTBI. However, mTBIs can result in prolonged periods of reduced cerebral blood flow and glucose uptake lasting days or weeks.12,13
There is a critical need to understand the mechanisms underlying the acute symptoms of mTBIs to develop effective strategies to promote brain recovery and repair. It has long been hypothesized that spreading depolarizations (SDs) initiate the neurometabolic cascade, because SDs induce similar changes in ion distribution, glutamate release, and metabolic load. Our previous work, as well as that of others, has established that SDs occur in closed-skull mTBI models in mice, initiating the neurometabolic cascade.14–16 However, the contribution of SDs to the signs of neurological dysfunction has not been tested. A recent study investigating SDs following subdural hematoma evacuation found that the presence of SDs was associate with poorer outcomes in comatose patients,17 and in one recovering patient SDs were time-locked to neurological deficits of aphasia.18 In rodents, SDs have been associated with freezing and reduced mobility in freely moving animals.19 Therefore, it is likely that SDs contribute to the neurological impairment associated with mTBIs.
To investigate the role of SDs in the acute symptoms of mTBIs, we used a closed-skull mTBI mouse model that has previously been shown to initiate SDs.14 A series of behavioral tasks were collectively scored with the neurological severity score (NSS) to measure acute (minutes) and longer-term (hours) behavioral impairment. mTBI-induced SDs were confirmed with intrinsic optical imaging and mice were immediately assessed for behavioral deficits. We hypothesize that SDs are associated with the acute behavioral deficits of mTBIs. To determine the mechanistic role of SDs in the acute behavioral deficits, we used exogenous potassium and optogenetic methods to induce SDs in separate cohorts of mice without mTBIs.
Methods
Rodent species, age, and sex as a biological variable
All procedures were performed in accordance with the author's university Institute Animal Care and Use Committee (IACUC). C57BL/6J mice are broadly used in brain injury research and increase rigor of the field overall. C57BL/6J mice were purchased directly from Jackson Laboratory (Jax# 000664) for our mTBI and KCl studies. For our optogenetic studies, we used a transgenic line expressing channel rhodopsin (Thy1-ChR-EGF line 18, Jax# 007612). These animals were maintained in-house by breeding homozygote-positive mice. For the neuronal edema studies, we used a Thy1-eGFP line (Jax# 007788). All mice were between 8 and 14 weeks of age. Recent work indicates sex differences in the outcomes of brain injury models and in vulnerability to SDs.20,21 All data were collected using roughly even numbers of male and female mice. Potential sex differences were statistically investigated as part of our analyses. A total of 170 mice were used for these studies, and none were excluded due to death; 14 were excluded due to inconclusive SD identification on intrinsic optical signals (iOS) videos.
Overall experimental design
To determine the role of SDs in acute mouse behavior, we used six conditions including appropriate controls: mTBI and sham, KCl and saline, and optogenetic stimulation (referred to as opto) and optogenetic controls (referred to as opto ctrl). Forty-eight hours prior to the experimental procedures, all mice underwent surgeries to retract the skin from the surface of the skull and render the skull transparent for imaging (Fig. 1C). Mice were anesthetized with isoflurane during all surgeries, experimental conditions, and iOS imaging. The absence or presence of SDs was confirmed with iOS imaging immediately following all experimental conditions (Fig. 1A). With iOS imaging, the propagating wave of an SD is clearly visible. Those iOS signals are shown as SD traces from our three experimental conditions (mTBI, KCl, and opto; Fig. 1D). Following iOS imaging, animals were immediately placed into an open field for 10 min and recorded for speed of recovery from anesthetics and voluntary locomotion. After 10 min in the open field, animals completed a battery of behavioral tasks (Fig. 1A). Each of the 11 tasks was scored as a pass (0) or fail (1), making up the neurological severity score (NSS). Mice were then placed back in their home cage and re-tested 3 h later.
FIG. 1.

Experimental design and SD detection. (A) Six experimental conditions were used in these studies: mTBI, sham, KCl, saline, opto, and opto ctrl. All mice were anesthetized with 1–2% isoflurane during the experimental condition and for 3 min after during the iOS. Mice recovered from anesthesia in an open field arena for 10 min while behavior was video recorded. Mice were then tested with NSS tasks by a blinded experimenter. (B) Illustrations of the approximate coronal view of the mTBI model (left), KCl injections (middle), and optogenetic probes (right). (C) Diagram of the modified cranial windows and location of mTBI impact (left), KCl cannulas (middle), and optical probes (right). (D) Overlayed iOS traces of bilateral SDs from mTBI (n = 4), KCl (n = 3), and opto (n = 4). iOS, intrinsic optical imaging; mTBI, mild traumatic brain injury; NSS, Neurological Severity Score; opto, optogenetic stimulation; opto ctrl, optogenetic controls; SD, spreading depolarization.
Skin retraction surgery
Forty-eight hours prior to the experimental condition and behavioral testing, all mice underwent surgeries to create an imaging area of the skull and underlying cortical tissue. Skin over the skull was retracted and the skin and skull were sealed with cyanoacrylate (CA) glue rendering the skull transparent for imaging (Fig. 1C). For all surgical procedures, mice were anesthetized with 2–2.5% isoflurane. For mTBI and sham, the rostral surface of the skull remained covered where the impact would be delivered. For KCl and saline, burr holes were drilled through the skull and cannulas were placed over the cortical surface to deliver either KCl or saline. Cannulas were secured in place with CA glue and dental cement and mice were given 0.2 mL intraperitoneal (IP) injection of buprenorphine. For opto, opto ctrl, and opto-wild-type controls, the skin was removed from the dorsal surface of the entire skull. After incision, CA glue was applied to seal the skin and skull. All mice were allowed to recover 48 h before experimental condition and behavioral testing.
Closed-skull mTBI model
We used a previously described closed-skull injury model using an electromagnetic impactor without head restriction, as shown in Figure 1B,C.14,22 This mTBI model does not result in skull fractures, major bleeding, or animal death. Our previous work has demonstrated that this mTBI model does not result in gross tissue damage, cell death, astrocyte activation, or blood–brain barrier disruption.14 Our work and that of others establish that closed-skull injuries can initiate an SD and concussion-like behavior.14–16
Skin removal surgery did not impede the mTBI impact itself because it was delivered rostrally on naive skin. Animals were placed on a commercially available Kaizen foam pad underneath the impactor. A 5-mm tip was attached to the impactor, and impacts were delivered with a 5-mm head deflection at 4 m/sec with a 20-msec dwell time. Due to the lack of head restriction, outcomes were variable. All mTBIs that impacted the head were considered successful and included in the study to later be classified based on SD presence. This mTBI model can induce SDs and produce mTBI-like behaviors.14 Animals were anesthetized with 2% isoflurane anesthesia in 100% oxygen during all six experimental conditions (mTBI, sham, KCl, saline, opto, and opto ctrl). Isoflurane has been shown to decrease SD frequency when compared with urethane anesthetic23; however, our studies required rapid recovery from isoflurane for our behavioral assessment. After confirming the presence or absence of SDs, animals were removed from anesthesia and allowed to recover in the open field arena.
Chemical initiation of SD
To investigate the mechanistic role of SDs in mouse behavior without an mTBI, we used implanted cannulas to apply KCl for the induction of SDs. KCl application is a common method to induce SDs experimentally.23–26 One cannula was surgically implanted in each hemisphere using the following coordinates: Anterior/Posterior, 1.7 mm; Medial/Lateral, ±1.7 mm; Dorsal/Ventral, −0.8 mm. Cannulas were placed through burr holes in the skull and secured with dental cement and CA glue 48 h prior to the experiment. On the experimental day, a 10-μL Hamilton syringe was connected to each internal cannula with polyimide (PI)-10 tubing backfilled with 5 μL of 1M KCl or saline. Next, 0.75 μL of 1M KCl or saline was injected simultaneously in each hemisphere (Fig. 1B,C). This amount of KCl was sufficient to induce a single SD in the mice (Fig. 1D). All animals were anesthetized with 2% isoflurane anesthesia in 100% oxygen during all experimental conditions including KCl/saline injections and SD detection with iOS imaging, lasting approximately 7 min.
Optogenetic initiation of SD
The optogenetic approach uses a transgenic animal expressing channel rhodopsin 2 protein under the Thy-1 promoter (line 18, Jax# 007612). SDs were initiated with 470 nm light at 3 mW for 30 sec, as previously published27,28 and shown here (Fig. 1D). Opto ctrl mice were exposed to 470 nm light at 1 mW for 30 sec. Two fiber-coupled LEDs (Thorlabs, cat# M470F4) were connected to two 400-μm patch cords (one for each hemisphere) and held in orientation with manual manipulators in approximately the same location as the KCl cannulas. Optical stimulation was performed through intact skull covered and sealed with CA glue and reliably induced SDs. All experimental groups were anesthetized with 2% isoflurane anesthesia in 100% oxygen during light stimulation and SD confirmation with iOS imaging lasting approximately 7 min. As an additional control, wild-type C57BL/J6 mice were exposed to identical light intensities as the opto-induced SDs (3 mW or 0 mW light intensities) prior to acute behavioral assessments.
SD confirmation with iOS imaging
All SDs were confirmed with iOS recorded through the skull. iOS are a mixture of absorption and reflectance of white light that changes when SDs propagate through cortical tissue making it possible to detect SDs with non-fluorescence imaging. The depth of imaging is limited to the penetration of white light, which limits the imaging to the cortical surface. We used a Nikon SLR camera NIKKOR 50-mm f/1.8–16 lens (f-stop for imaging = 5.6) and a 12-mm extension tube was attached to a Mightex USB CCD (CXE-B013-U) camera to image the iOS changes associated with SD.29
Mice were placed on a Kaizen foam pad with 1.5–2% isoflurane delivered via nose cone. The skull was illuminated with a Supon L122t LED light panel (Amazon) at ∼2400 lux (95% power) with cool temperature setting of 4000 K. All emitted wavelengths were used for illumination and all reflected light was collected via the camera lens without filtering. Light intensities were converted to a 16-bit grayscale image by the CCD camera. iOS video was recorded for 3 min after the experimental condition to visually confirm the lack of an SD, unilateral SDs (a single SD on either the left or right hemisphere), or bilateral SDs (an SD on each hemisphere).
Micro Manager software30,31 was used to control the camera and capture images. ImageJ32 was used to visualize the images and identify SDs. SD outcomes from each of the conditions are listed in Table 1. iOS videos were excluded from the trace analyses when movement artifacts contaminated the SD trace. Due to the lack of head restriction of our mTBI model, movement artifacts were common but did not limit our ability to visually confirm the SD. iOS images with limited movement artifacts were used to create the iOS traces shown here. Regions of interest (ROIs) were placed in the primary visual cortex avoiding large vessels to temporally catch the propagating SDs. Unfiltered average pixel intensities were extracted from the ROIs. SD traces were normalized to the pre-SD baseline and aligned to the positive peak amplitude.
Table 1.
Spreading Depolarizations Detected
| Condition | No SD | Unilateral SD | Bilateral SD |
|---|---|---|---|
| mTBI | 26.32% (n = 10) | 34.21% (n = 13) | 39.47% (n = 15) |
| Sham | 100% (n = 27) | ||
| KCl | 50% (n = 12) | 50% (n = 12) | |
| Saline | 70.59% (n = 12) | 29.41% (n = 5) | |
| Opto | 28.57% (n = 6) | 71.43% (n = 15) | |
| Opto ctrl | 100% (n = 18) |
mTBI, mild traumatic brain injury; Opto, optogenetic stimulation; Opto ctrl, optogenetic controls; SD, spreading depolarization.
Behavioral testing
After the experimental condition and SD confirmation, mice were placed in the middle of an open field arena for 10 min with overhead video recording. Motion tracking was accomplished with EthoVision (Noldus) to quantify movement over the 10-min period. Latency to right was defined as the time the mouse took to change position from lying on its side to upright on its paws. Latency to movement was defined as the time to the first full step of ambulation. Videos that were not accurately recorded or tracked were omitted from open-field data sets (one KCl mouse, four mTBI mice, and five sham mice).
Immediately after the open field, the mouse was transferred to a blinded researcher to perform the NSS tasks. For each NSS task the following criteria were used for a pass.
Escape: exit a smaller arena (30-cm diameter circle) within 3 min.
Exploration: enter three quadrants of the larger arena (60-cm square) in 3 min.
Forceps grasp: hold forceps with all four paws while being lifted by the tail.
Startle response: respond to a hand clap with a flinch or freeze.
Straight walk test: voluntarily walk with all four paws on an elevated walkway.
Balance beams: use all four paws to walk across a beam with width of 4, 3, 2, 1 cm, and 1 cm round without falling.
Inverted mesh: climb with all four paws while inverted for 1 min without falling.
Each task was scored on a pass (0) or fail (1) scale and summed for the NSS. Mice were placed back in their home cage to recover for 3 h before re-testing the NSS tasks.
Neuronal edema
To assess post-SD neuronal edema, we used Thy1-eGFP transgenic mice (Jax# 007788). The advantage of this transgenic line is that GFP is highly expressed in a sparse number of cells allowing for morphological quantification. Following a sham or mTBI condition the absence or presence of SDs was determined with iOS imaging as previously described. Transgenic animals were allowed to recover for 24 or 48 h prior to perfusion with 4% paraformaldehyde. Following perfusion, brains were removed and further fixed in 4% paraformaldehyde for 48 h. Water content of the brains was reduced by placing them in 30% sucrose until the brains became submerged. Brains were sectioned at 40 mm with a sliding knife microtome. Five to six sections were collected across the rostral/caudal axis from approximately ±2 mm from bregma. Sections were roughly 0.75 mm from each other and included regions beneath the injury/induction site and distal regions including the primary visual cortex. Sections were counterstained with NucBlue (ThermoFisher, #R37605) and were mounted on a slide. Sections were imaged with a Zeiss Axioscan Z1 with a 20 × objective. Twenty-millimeter z-stacks were collected with a 2-mm interval across all cortical areas of each section.
ROIs were manually generated to include all labeled cell bodies of layer 4/5 pyramidal neurons or clearly labeled dendrites in all collected sections. A custom ImageJ/FIJI32 batch processing macro was used and is outlined in Supplementary Figure S1. One caveat of this transgenic animal is the variability in the number of neurons expressing the GFP resulting in a large range of neurons being measured from each animal (15–569). For dendritic analyses, individual ROIs were manually generated from the same imaged sections used for the cell soma analysis. ROIs were in layers 1–3 of the cortex where the majority of the layer 4/5 dendrites project. ImageJ plugins “tubeness” and “skeletonize” were used to identify and measure the dendrites. From the “analyze skeletonize” function in ImageJ we used the number of slab voxels as a measurement of dendritic length. Over 20,000 dendritic segments were measured per animal. We used general linear modeling of the mean soma size and dendritic length per mouse for the statistical testing in SPSS.
Statistical analysis
Analysis was conducted in SPSS (version 20.0; IBM Corp., Armonk, NY, USA). The experimental design and a priori estimates were based on a previous behavioral test assessing sham versus mTBI animals. However, when groups needed to be split into subgroups based on the SDs additional animals were added. More mTBI animals were used to account on increased variability in the presence of SDs and behavioral outcomes. To compare the subgroups of each condition based on the absence or presence of SDs we used either generalized estimating equations (GEEs), NSS, or generalized linear models (GLMs). When repeated measures were assessed as in the NSS (acute vs. 3 h) we used the GEEs. Because we were measuring multiple behavioral tasks within the same set of animals, we used GLMs. Further, GLMs consider both fixed and random effects. Type 3 sum of squares were used in all analyses, including those that examined the potential moderating role of SD on neurobehavioral outcomes. The data are presented graphically in each figure, but we did not do post hoc direct comparisons between groups. Statistical results are reported in the Results section and in Table 2. For the wild-type opto-controls, a non-parametric t-test (Mann-Whittney) was used to compare two different light exposures, with GraphPad Prism 9.5.1.
Table 2.
Statistics
| Figure | Measure | GLM, GEE, or EMM | Effect | Wald chi-square f value | P-value | Significant? |
|---|---|---|---|---|---|---|
| 6A | mTBI latency to right | GLM | Sex | 0.068 | 0.794 | |
| Condition | 29.729 | <0.001 | Yes | |||
| Sex*condition | 2.085 | 0.149 | ||||
| 6B | mTBI latency to movement | GLM | Sex | 1.171 | 0.279 | |
| Condition | 27.158 | <0.001 | Yes | |||
| Sex*condition | 0.613 | 0.434 | ||||
| 6C | mTBI total distance traveled | GLM | Sex | 2.518 | 0.113 | |
| Condition | 12.889 | <0.001 | Yes | |||
| Sex*condition | 0.127 | 0.722 | ||||
| 6D-E | mTBI NSS | GEE | Sex | 0.039 | 0.843 | |
| Condition | 11.227 | 0.001 | Yes | |||
| Index 1 | 37.091 | <0.001 | Yes | |||
| Sex*condition | 0.016 | 0.899 | ||||
| Sex*Index 1 | 1.361 | 0.243 | ||||
| Condition*Index 1 | 1.474 | 0.225 | ||||
| Sex*condition*Index 1 | 0.500 | 0.480 | ||||
| 3H-I | mTBI NSS with SD modifier | GEE | Condition | 1.400 | 0.237 | |
| SD | 8.452 | 0.015 | Yes | |||
| Index 1 | 34.088 | <0.001 | Yes | |||
| Condition*index 1 | 1.003 | 0.316 | ||||
| SD*Index 1 | 11.603 | 0.003 | Yes | |||
| mTBI NSS acute only with SD modifier | GLM | SD | 34.852 | <0.001 | Yes | |
| mTBI NSS 3h only with SD modifier | GLM | SD | 0.864 | 0.649 | ||
| 4E | KCl latency to right | GLM | Sex | 3.002 | 0.083 | |
| Condition | 6.281 | 0.012 | Yes | |||
| Sex*condition | 1.322 | 0.250 | ||||
| 4F | KCl latency to movement | GLM | Sex | 1.120 | 0.290 | |
| Condition | 6.167 | 0.013 | Yes | |||
| Sex*condition | 0.310 | 0.578 | ||||
| 4G | KCl total distance traveled | GLM | Sex | 0.099 | 0.753 | |
| Condition | 6.495 | 0.011 | Yes | |||
| Sex*condition | 0.386 | 0.535 | ||||
| 4H-I | KCl NSS | GEE | Sex | 0.584 | 0.495 | |
| Condition | 2.855 | 0.091 | ||||
| Index 1 | 30.487 | <0.001 | Yes | |||
| Sex*condition | 0.006 | 0.941 | ||||
| Sex*Index 1 | 0.536 | 0.356 | ||||
| condition*Index 1 | 0.850 | 0.356 | ||||
| Sex*condition*Index 1 | 0.393 | 0.531 | ||||
| 5D | Optogenetic latency to right | GLM | Sex | 2.092 | 0.148 | |
| Condition | 16.458 | <0.001 | Yes | |||
| Sex*condition | 0.678 | 0.410 | ||||
| 5E | Optogenetic latency to movement | GLM | Sex | 0.024 | 0.878 | |
| Condition | 0.193 | 0.660 | ||||
| Sex*condition | 4.898 | 0.027 | Yes | |||
| Optogenetic latency to movement females only | GLM | Condition | 2.763 | 0.096 | ||
| Optogenetic latency to movement males only | GLM | Condition | 2.024 | 0.155 | ||
| 5F | Optogenetic total distance traveled | GLM | Sex | 0.158 | 0.691 | |
| Condition | 17.078 | <0.001 | Yes | |||
| Sex*condition | 0.211 | 0.646 | ||||
| 5G-H | Optogenetic NSS | GEE | Sex | 0.361 | 0.548 | |
| Condition | 12.867 | <0.001 | Yes | |||
| Index 1 | 51.902 | <0.001 | Yes | |||
| Sex*condition | 0.225 | 0.635 | ||||
| Sex*Index 1 | 6.341 | 0.012 | Yes | |||
| condition*Index 1 | 14.065 | <0.001 | Yes | |||
| Sex*condition*Index 1 | 4.726 | 0.030 | Yes | |||
| Optogenetic NSS acute only | GLM | Sex | 0.430 | 0.512 | ||
| Condition | 19.421 | <0.001 | Yes | |||
| Sex*condition | 0.360 | 0.549 | ||||
| Optogenetic NSS 3 h only | GLM | Sex | 1.994 | 0.158 | ||
| Condition | 0.945 | 0.331 | ||||
| Sex*condition | 1.414 | 0.234 | ||||
| 2B | Additional wild-type optogenetic controls latency to right | Mann-Whitney | 3 mW vs. 0 mW | 0.7597 | ||
| 2C | Additional wild-type optogenetic controls latency to movement | Mann-Whitney | 3 mW vs. 0 mW | 0.5152 | ||
| 2D | Additional wild-type optogenetic controls total distance traveled | Mann-Whitney | 3 mW vs. 0 mW | 0.5368 | ||
| 2E | Additional wildtype optogenetic controls acute NSS | Mann-Whitney | 3 mW vs. 0 mW | >0.9999 | ||
| 7D-E | All NSS with SD as modifier | GEE | Sex | 0.000 | 0.990 | |
| Condition | 13.360 | 0.001 | Yes | |||
| Index 1 | 91.049 | <0.001 | Yes | |||
| SD | 11.751 | 0.003 | Yes | |||
| Sex*condition | 0.037 | 0.982 | ||||
| Sex*Index 1 | 1.249 | 0.264 | ||||
| Sex*SD | 0.558 | 0.757 | ||||
| Condition*Index 1 | 2.016 | 0.365 | ||||
| Condition*SD | 3.255 | 0.196 | ||||
| Index 1*SD | 10.880 | 0.004 | Yes | |||
| Sex*condition*Index 1 | 4.113 | 0.128 | ||||
| Sex*condition*SD | 1.021 | 0.600 | ||||
| Sex*Index 1*SD | 1.608 | 0.447 | ||||
| Condition*Index 1*SD | 1.343 | 0.511 | ||||
| Sex*condition*Index 1*SD | 3.002 | 0.223 | ||||
| All NSS with SD as modifier | EMM | Sex | 0.008 | 0.927 | ||
| Condition | 19.845 | 0.001 | Yes | |||
| Index 1 | 118.814 | 0.001 | Yes | |||
| SD | 15.292 | 0.001 | Yes | |||
| All NSS with SD as modifier acute time-point only | EMM | SD | 29.553 | 0.001 | Yes | |
| All NSS with SD as modifier 3-h time-point only | EMM | SD | 1.404 | 0.496 | ||
| S1 | Mean soma size at 24 hours | GLM | mTBI vs. sham | 0.399 | 0.528 | |
| Mean soma size at 48 h | GLM | mTBI vs. sham | 7.171 | 0.007 | Yes | |
| Mean dendrite size at 24 h | GLM | mTBI vs. sham | 0.295 | 0.587 | ||
| Mean dendrite size at 48 h | GLM | mTBI vs. sham | 1.071 | 0.301 |
“Index 1” refers to time-point.
EMM, estimated marginal means; GEE, generalized estimating equation; GLM, generalized linear model; mTBI, mild traumatic brain injury; NSS, Neurological Severity Score; SD, spreading depolarization.
Results
Mild traumatic brain injuries are associated with acute behavioral deficits
We used a controlled closed-skull impact model to investigate the contribution of SDs to the behavioral deficits of mTBIs. Nearly equal numbers of male (n = 32) and female mice (n = 33) were assigned randomly to condition groups of mTBI (n = 38) or sham (n = 27). Sham mice were anesthetized and handled identically to mTBI mice, but the impactor was only manually lowered to touch the head. Mice were under isoflurane anesthetic during experimental condition and iOS imaging. Mice were then placed in the center of an open field arena with motion-tracking capabilities to recover from anesthesia and freely explore. In the open field, mTBI animals took significantly longer to right themselves (GLM Wald-χ2 = 29.729, p < 0.001; mTBI > sham; Fig. 2A) and regain movement (GLM Wald-χ2 = 27.158, p < 0.001; mTBI > sham; Fig. 2B) relative to sham animals. Once mTBI mice began to move they did not explore the open-field arena resulting in a reduced total distance traveled over the 10-min period (GLM Wald-χ2 = 12.889, p < 0.001; mTBI < sham; Fig. 2C). There were no significant main effects of sex or sex × condition interactions (Table 2).
FIG. 2.

mTBIs are associated with acute behavior deficits. Immediately following the mTBI or sham conditions, mice were allowed to recover in an open field arena for 10 min. (A) Latency to right (GLM, condition effect p < 0.001), (B) latency to movement (GLM, condition effect p < 0.001), and (C) total distance traveled (GLM, condition effect p < 0.001) were assessed with motion tracking recordings. (D) Mice perform the NSS tasks first at the acute time-point of 13–20 min after the condition. Tasks were scored on a pass/fail scale (0 for pass and 1 for fail) and cumulative scores are shown. (E) The mice performed the NSS tasks a second time 3 h after the mTBI or sham condition. For longitudinal NSS considering both time-points: GEE, condition effect p = 0.001, effect of time p < 0.001. Males are indicated on graphs with triangles n = 32, females are indicated on graphs with circles n = 33; mTBI n = 38, sham n = 27. GEE, generalized estimating equation; GLM, generalized linear model; mTBI, mild traumatic brain injury; NSS, Neurological Severity Score.
To characterize the behavioral deficits associated with mTBIs, mice were immediately run through the NSS tasks. The acute time-point for behavioral assessment occurred approximately 13 min after mTBI or sham condition. To test for behavioral recovery, mice were re-tested 3 h after the initial condition. Overall, mTBI animals failed more of the tasks resulting in a higher NSS relative to sham animals. Our analysis showed there was a significant main effect of mTBI versus sham conditions on the NSS (GEE Wald-χ2 = 11.227, p = 0.001; mTBI > sham; Fig. 2D). However, at 3 h post-condition, mTBI animals performed similarly to sham animals on the NSS tasks, suggesting a recovery of the behavioral deficits. Analysis showed a significant main effect of time (GEE Wald-χ2 = 37.091, p < 0.001; acute >3 h; Fig. 2D,E). Again, there was no significant main effect of sex or interactions between sex, condition, and time in the NSS behavior after mTBI or sham (Table 2).
mTBI-induced spreading depolarizations moderate the acute behavioral deficits
To investigate underlying mechanisms of the acute behavior, we confirmed the absence or presence of SDs with iOS imaging in both our sham and mTBI animals. SDs were detected by a propagating wave of increased reflectance traveling from the impact location caudally through the entire cortex. Within our mTBI animals, 39.47% (n = 15) of mTBIs resulted in bilateral SDs (an SD on both hemispheres), 34.21% (n = 13) of mTBIs resulted in a unilateral SD (an SD on only the right or only the left hemisphere), and 26.32% (n = 10) of mTBIs did not result in SDs (Table 1). Sham conditions never produced SDs (n = 27; Fig. 3A–D; Table 1).
FIG. 3.

mTBI-induced SDs are associated with acute behavioral symptoms. The mTBI mice and sham mice were separated by absence of SDs, unilateral SD, or bilateral SD. iOS traces are normalized to pre-SD baseline. (A) iOS trace from shams (n = 5). (B) iOS trace from mTBI with no SDs (n = 3). (C) iOS traces from both hemispheres from mTBI with unilateral SDs (n = 3). (D) iOS trace from mTBI with bilateral SD (n = 4). Open field score and NSS were separated by the confirmed SD condition. (E) The open field latency to right. (F) Latency to movement. (G) Total distance traveled. (H) NSS at the acute time-point (GLM, SD effect at acute time-point p = 0.15). (I) NSS at the 3-h time-point (GLM, SD effect at 3-h time-point p = 0.649 ns). For longitudinal NSS considering both time-points: GEE, SD effect p = 0.15, time effect p < 0.001, SD × time interaction p = 0.003. Males are indicated on graphs with triangles n = 32, females are indicated on graphs with circles n = 33; sham SD absent n = 27, mTBI SD absent n = 10, mTBI unilateral SD n = 13, mTBI bilateral SD n = 15. GEE, generalized estimating equation; GLM, generalized linear model; iOS, intrinsic optical imaging; mTBI, mild traumatic brain injury; NSS, Neurological Severity Score; SD, spreading depolarization.
Given this distribution of bilateral SDs, unilateral SDs, and no SDs within our mTBI condition, we performed a general estimating equation analysis that considered the presence of SD as a potential moderator variable on the primary behavioral outcome (NSS). iOS traces are shown for sham and mTBI in Figure 3A–D. Open field data for latency to right, latency to movement, and total distance traveled are shown separated by SD status in Figure 3E–G. When SD status (none, unilateral, or bilateral) was entered as an additional factor into the analysis, the main effect of condition (mTBI vs. sham) was no longer significant for NSS (GEE Wald-χ2 = 1.400, p = 0.237; Fig. 3H,I), whereas both SD status (GEE Wald-χ2 = 8.452, p = 0.015; Fig. 3H,I) and interaction of SD status × time (GEE Wald-χ2 = 11.603, p = 0.003; Fig. 3H,I) were significant along with a main effect of time (GEE Wald-χ2 = 34.088, p < 0.001; Fig. 3H,I).
Simple effect testing indicated that SD status was only significant at the acute NSS assessment (GEE Wald-χ2 = 34.852, p < 0.001; Fig. 3H), with bilateral SD resulting in increased behavioral deficits relative to both unilateral SD and no SD animals (both p-values <0.05). Moreover, there were no significant differences between unilateral SD animals and no SD animals at the acute assessment. In contrast, effect of SD was not significant at the 3-h assessment in terms of behavioral performance (GEE Wald-χ2 = 0.864, p = 0.649; Fig. 3I), with no significant differences observed between bilateral, unilateral, and no SD animals. Collectively, these data suggest that the presence of bilateral SDs is more strongly associated with behavioral deficits than the presence of mTBIs.
mTBIs were not associated with significant neuronal edema or dendritic beading at 24 or 48 h post-injury
Both mTBIs and SDs have been associated with neuronal edema33,34 that could alter cortical network function and contribute to the acute behavioral deficits. To test for neuronal edema, we used Thy1-GFP transgenic animals (Jax# 007788). Thy1-GFP animals were split into two experimental conditions, mTBI (n = 12) or sham (n = 6). The presence or absence of SDs was confirmed with iOS imaging. In this cohort of animals, there were two mTBI animals with a unilateral SD and the rest of mTBI animals had bilateral SDs. The two mTBI animals with unilateral SDs and one sham animal that did not express GFP in any cortical neurons were dropped from the analyses. It remains unclear if the expression of the GFP in neurons changes the threshold of SD.
Brains were collected at 24 or 48 h after mTBI or sham condition, when neuronal edema has been reported.33 Cortical areas across the rostral/caudal plane (±2 mm from bregma) were imaged and cell soma areas were measured with custom ImageJ/Fiji and Matlab codes (Supplementary Fig. S1A). We focused on layer 4/5 pyramidal neurons for these studies, and we found no main effect of condition (mTBI vs. sham; GLM Wald-χ2 = 0.399, p = 0.528; Supplementary Fig. S1) at 24 h (Supplementary Fig. S1B). However, at 48 h mTBI mice had significantly smaller cell somas compared with sham mice (GLM Wald-χ2 = 7.171, p = 0.007; sham > mTBI; Supplementary Fig. S1C).
Dendritic beading is another component of neuronal swelling that could alter cortical network function. To assess dendritic beading, individual ROIs were generated in layers 1–3 of the cortex that included dendritic segments within the same sections that were used for the neuronal cell body measurements. ImageJ plugins “tubeness” and “skeletonize” were used to identify dendritic segments. An overview of the analysis process is shown in Supplementary Figure S1D. Dendritic length segments were measured by the number of slab voxels created by the “skeletonize” analysis. Both sham and mTBI animals had similar dendritic lengths at 24 h (GLM Wald-χ2 = 0.295, p = 0.587; Supplementary Fig. S1E) and 48 h (GLM Wald-χ2 = 1.071, p = 0.301; Supplementary Fig. S1F), again suggesting a lack of dendritic beading and neuronal swelling. However, many of our dendritic segments were under 10 slab voxels in length. The short dendritic segments were most likely due to the 20-mm section thickness. Further, these analyses were limited to the 24- and 48-h time-points following the sham or mTBI.
KCl-induced spreading depolarizations produce acute behavioral deficits
To identify the contribution of SDs to the acute behavioral deficits, we used KCl to chemically induce SDs in the absence of an mTBI. Injection cannulas were surgically placed through burr holes over the somatosensory cortex on each hemisphere and glued in place. Placement of cannulas replicated the impact and SD initiation site of our mTBI model. Near equal numbers of male (n = 20) and female (n = 21) mice were randomly assigned to KCl (n = 24) or saline (n = 17) injections. For both experimental conditions, 0.75 μL was injected through each internal cannula. Similar to our mTBI and sham conditions, animals were anesthetized with isoflurane and the presence or absence of SDs was confirmed with iOS imaging. iOS traces representing no SDs, unilateral SDs, and bilateral SDs after saline and KCl are shown in Figure 4A–D. Immediately following SD confirmation, mice were run through the open field and NSS behavioral tasks. In open field, there was a main effect of condition (KCl vs. saline) on latency for animals to right themselves (GLM Wald-χ2 = 6.281, p = 0.012; KCl > saline; Fig. 4E), regain movement (GLM Wald-χ2 = 6.167, p = 0.013; KCl > saline; Fig. 4F), and total distance traveled in 10 min (Wald-χ2 = 6.495, p = 0.011; KCl < saline; Fig. 4G). There were no significant effects of sex or sex × condition interactions (Table 2).
FIG. 4.


KCl-induced SDs are associated with similar behavioral deficits. iOS traces are normalized to pre-SD baseline. (A) iOS trace from saline with no SDs (n = 3). (B) iOS trace from saline with unilateral SDs (n = 3). (C) iOS traces from KCl with unilateral SDs (n = 4). (D) iOS trace from KCl with bilateral SD (n = 3). Cumulative data are shown on the left panel and the same data are separated by the presence or absence of SDs on the right panel for each behavioral data set. (E) Open field latency to right (GLM, condition effect p = 0.012). (F) Latency to movement (GLM, condition effect p = 0.013). (G) Total distance traveled (GLM, condition effect p = 0.011). (H) NSS for the acute time point. (I) NSS for the 3-h time-point. For longitudinal NSS considering both time-points: GEE, time effect p < 0.001. Males are indicated on graphs with triangles n = 20, females are indicated on graphs with circles n = 21; saline n = 17, KCl n = 24. GEE, generalized estimating equation; GLM, generalized linear model; iOS, intrinsic optical imaging; NSS, Neurological Severity Score; SD, spreading depolarization.
In the NSS tasks neither main effect of condition (KCl vs. saline; GEE Wald-χ2 = 2.855, p = 0.091; Fig. 4H,I) nor sex was significant (GEE Wald-χ2 = 0.584, p = 0.495; Fig. 4H,I). This could be because there were five (∼30%) saline condition animals with confirmed SDs. Saline induced SDs were most likely caused by local increases in intracranial pressure from the injection itself. However, there was a significant effect of time on NSS (GEE Wald-χ2 = 30.487, p < 0.001; acute >3 h; Fig. 4H,I), with worse performance at the acute relative to the 3-h assessment. There were no significant interactions between sex, condition, or time on the NSS (Table 2). The KCl and saline injections were variable in their SD outcomes, with KCl producing bilateral SDs in only 50% of animals and saline injections producing a unilateral SD in 29.41% of animals (Table 1). These results suggest SDs are key contributing factors to the acute behavioral deficits. However, these studies were confounded by potential injury due to burr hole drilling and cannula placement, and by the variability in initiation of SDs from both of our saline and KCl conditions. Therefore, a less invasive method was required to investigate behavioral outcomes of SDs in the absence of an mTBI.
Optogenetic-induced SDs are associated with acute behavioral deficits
To non-invasively initiate SDs, we adopted a previously described optogenetic approach.27,28 A 400-mm fiberoptic patch cord was place on top of the CA-glue-covered skull, one over each hemisphere above the somatosensory cortex, in a similar location to the KCl injection sites (Fig. 1B,C). Near equal numbers of male (n = 21) and female (n = 18) mice were randomly assigned to experimental opto (3 mW for 30 sec; n = 21) or opto ctrl stimulation (1 mW for 30 sec; n = 18). Animals were anesthetized during optogenetic stimulation and SD confirmation identically to mTBI and KCl experimental procedures. In the opto condition, bilateral SDs were initiated 71.43% and unilateral SDs in 28.57% of animals. The opto ctrl condition (1mW light stimulation) did not induce SDs in any animals (Table 1). iOS traces representing SD results from opto and opto ctrl are shown in Figure 5A–C.
FIG. 5.


Optogenetic-induced SDs are associated with similar behavioral deficits. iOS traces are normalized to pre-SD baseline. (A) iOS trace from opto ctrl with no SD (n = 4). (B) iOS traces from opto with unilateral SDs (n = 3). (D) iOS trace from opto with bilateral SD (n = 4). Cumulative data are shown on the left panel and the same data are separated by the presence or absence of SDs on the right panel for each data set. (A) Open field latency to right (GLM, condition effect p < 0.001). (B) Latency to movement (GLM, sex × condition interaction p = 0.027). (C) Total distance traveled (GLM, condition effect p < 0.001). (D) NSS for the acute time-point (GLM, condition effect at acute time-point only p < 0.001). (E) NSS for the 3-h time-point (GLM, condition effect at 3-h time-point only, p = 0.331 ns). For longitudinal NSS considering both time-points: GEE, condition effect p < 0.001, time effect p < 0.001. Males are indicated on graphs with triangles n = 21, females are indicated on graphs with circles n = 18; opto ctrl n = 18, opto n = 21. GEE, generalized estimating equation; GLM, generalized linear model; iOS, intrinsic optical imaging; NSS, Neurological Severity Score; opto, optogenetic stimulation; opto ctrl, optogenetic controls; SD, spreading depolarization.
Opto mice were associated with a significant increase in latency to right (GLM Wald-χ2 = 16.458, p < 0.001; opto > opto ctrl; Fig. 5D) and a significant decrease in total distance traveled in the 10-min trial (GLM Wald-χ2 = 17.078, p < 0.001; opto < opto ctrl; Fig. 5F). However, the opto condition did not alter latency to movement (GLM Wald-χ2 = 0.193, p = 0.660; Fig. 5E), but there was a significant interaction of sex × condition (opto vs. opto ctrl) in latency to movement (GLM Wald-χ2 = 4.898, p = 0.027; Fig. 5E). Main effect of condition (opto vs. opto ctrl) was not significant (GLM Wald-χ2 = 2.763, p = 0.096 (females); Wald-χ2 = 2.024, p = 0.155 (males); Fig. 5E) in either females or males when latency to movement was independently examined for each sex (Table 2).
To test for acute behavioral deficits, we used the NSS tasks as previously described. Similar to the mTBI experiments, optogenetic stimulation was associated with behavioral deficits (main effect of condition; GEE Wald-χ2 = 12.867, p < 0.001; opto > opto ctrl; Fig. 5G,H) that were recovered within 3 h (main effect of time; GEE Wald-χ2 = 51.902, p < 0.001; acute >3 h; Fig. 5G,H). Further, there was a significant three-way interaction between sex, condition, and time (GEE Wald-χ2 = 4.726, p = 0.030; opto > opto ctrl; Fig. 5G,H), with no main effect of sex (GEE Wald-χ2 = 0.361, p = 0.548; Fig. 5G,H) or interaction between sex and condition (GEE Wald-χ2 = 0.225, p = 0.635; Fig. 5G,H). Due to the three-way interaction, separate 2 × 2 GLM was done at the acute and 3-h assessment times to decompose the three-way interaction and examine effects associated with condition and sex. Results from the acute time-point indicated a main effect for condition (opto vs. opto ctrl) (GLM Wald-χ2 = 19.421, p < 0.001) with non-significant effects for sex or sex × condition interaction (GLM Wald-χ2 = 0.430 and Wald-χ2 = 0.360, both p = 0.512 and p = 0.549).
At the 3-h assessment, main effects of condition and sex were not significant, nor were there interactions (GLM Wald-χ2 = 1.994, p = 0.158 [sex]; Wald-χ2 = 0.945, p = 0.331 [condition]; Wald-χ2 = 1.414, p = 0.234 [sex × condition]). To test for potential effects of light intensity alone on behavior, additional controls in wild-type mice are included in Figure 2. Wild-type mice were exposed to either 0 mW or 3 mW light. iOS imaging was used to confirm the lack of light-induced SDs (Fig. 6A). There were no significant differences between 0mW and 3mW light exposure on latency to right (p = 0.7597; Fig. 6B), latency to movement (p = 0.5152; Fig. 6C), distance traveled (p = 0.5368; Fig. 6D), or acute NSS (p > 0.9999; Fig. 6E).
FIG. 6.

Wild-type mice exposed to 0 mW or 3 mW light exposure are not associated with SDs or behavioral deficits. (A) iOS traces from 0 mW of light exposure (white) and 3 mW light exposure (gray), both showing no SDs. (B) Latency to right (Mann-Whittney, p = 0.7597). (C) Latency to movement (Mann-Whittney, p = 0.5152). (D) Total distance traveled (Mann-Whittney, p = 0.5368). (E) Acute NSS (Mann-Whittney, p > 0.9999). iOS, intrinsic optical imaging; NSS, Neurological Severity Score; SD, spreading depolarization.
SDs are associated with behavioral deficits regardless of initiation method (mTBI, KCl, or optogenetic stimulation)
The final set of analyses examined our initial hypothesis that the presence of bilateral SDs drive the acute behavioral deficits across all six experimental conditions (mTBI, sham, KCl, saline, opto, and opto ctrl) on the open field tasks (Fig. 7A–C) and NSS (Fig. 7D,E). Performance on individual NSS tasks is included in Table 3. The escape and seeking tasks showed the most consistent deficit after bilateral SDs compared with unilateral SDs and no SDs. More than 50% of mice with bilateral SDs from mTBI, KCl, or opto failed these tasks. Post hoc analysis of the NSS indicated a significant main effect of the six conditions (Wald-χ2 = 13.360, p = 0.001; Fig. 7D,E), time (GEE Wald-χ2 = 91.049, p < 0.001; acute >3 h; Fig. 7D,E), and SD (no SD, unilateral, bilateral; GEE Wald-χ2 = 11.751, p = 0.003; Fig. 7D,E), as well as a significant SD × time interaction (GEE Wald-χ2 = 10.880, p = 0.004; Fig. 7D,E). Further analyses for condition effect indicated the greatest impairment in the optogenetic-induced SD group relative to both mTBI and KCl cohorts (GEE Wald-χ2 = 19.845, p < 0.001; Fig. 7D,E). In contrast, there was no statistical difference between mTBI and KCl mice (p = 0.50). Our analyses of SD × time interaction indicated a time sensitive increase in impairment on the NSS based on the type of SD observed during the acute time-point assessment (GLM Wald-χ2 = 29.553, bilateral > unilateral > no SD; all p < 0.001). In contrast, effect of SD was not significant at the 3-h assessment due to recovery of the behavioral deficits (GLM Wald-χ2 = 1.404, p = 0.496).
FIG. 7.

Post hoc analysis comparing the absence or presence of SDs to behavior. All data sets were combined including mTBI, KCl, and optogenetic data. (A) Open field latency to right. (B) Latency to movement. (C) Total distance traveled. (D) NSS for the acute time-point (GLM, condition effect at acute time-point only p = 0.044). (E) NSS for the 3-h time-point (GLM, condition effect at 3-h time-point only p = 0.154 ns). For longitudinal NSS considering both time-points: GEE, condition effect p = 0.001, time effect p < 0.001, SD effect p = 0.003, time × SD interaction p = 0.004. On the graphs, pink indicates mTBI, orange indicates sham, yellow indicates KCl, green indicates saline, blue indicates opto, and purple indicates opto ctrl. GEE, generalized estimating equation; GLM, generalized linear model; mTBI, mild traumatic brain injury; NSS, Neurological Severity Score; opto, optogenetic stimulation; opto ctrl, optogenetic controls; SD, spreading depolarization.
Table 3.
Individual NSS Tasks Failed
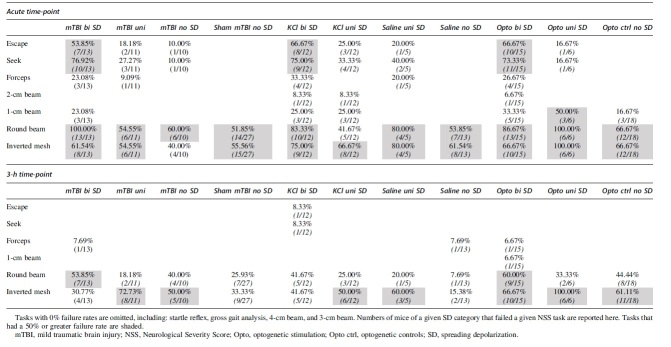
|
We recognize the limitations of these comparisons in that different experimental approaches are used between mTBI, KCl, and optogenetics. Each experimental condition has a separate control group (i.e., sham, saline, and opto ctrl) and some include surgical procedures that generate burr holes through the skull. However, the comparisons shown here strengthen the argument that SDs are associated with acute behavioral deficits despite how they were generated (i.e., mTBI, KCl, or optogenetics).
Discussion
Taken together, our studies suggest that SDs are major contributors to the acute behavioral deficits associated with mTBIs. Mice that had a single mTBI compared with sham mice had a greater latency to right, a greater latency to walk, a shorter total distance traveled, and more failures on the NSS tasks compared with sham mice (Fig. 2). When the presence or absence of SDs is considered, mTBI is no longer associated with these behavioral deficits, rather the SD itself is associated with acute behavioral deficits. mTBI animals without SDs were not significantly different than sham animals (Fig. 3). When SDs were initiated with chemical injection or with optogenetic light stimulation, in the absence of mechanical force to the head, mice had similar behavioral effects to those seen after an mTBI (Figs. 4,5). When analyzed together, the presence of bilateral SDs, initiated with mTBI, KCl, or optogenetics, produces similar behavioral deficits (Fig. 7). Collectively, these data support the hypothesis that bilateral SDs are linked to the acute behavioral deficits in mice.
Unilateral SDs did not produce consistent behavioral deficits in our experiments. These data indicate the importance of SDs in both hemispheres to result in behavioral deficits. mTBI-induced SDs typically radiate from underneath the impact site and travel through the entire connected gray matter, without crossing hemispheres.14 Our mTBI model is associated with almost equal proportions of bilateral SDs, unilateral SDs, and absent SDs. This variability may be due to the mTBI being near the impact-induced threshold for SDs and/or slight variations in the impact site due to the head not being restricted. The variability of the SD initiation in our model is a limitation of our model but does give us the ability to compare mTBI with and without the SD. Our KCl approach was designed to help reduce this variability in SD initiation. However, our KCl approach was met with similar variability between unilateral and bilateral SDs and with saline-induced SDs. SDs initiated with saline are most likely due to volumetric and pressure changes in the intracranial space by the injection itself.35 The variability from the KCl was most likely due to clogged internal cannulas and or plugged implanted cannulas, but these outcomes were kept in the data to mimic mTBI unilateral SD outcomes. Inconsistent SD outcomes from our KCl injections and saline control condition may have led to the lack of significant condition effects in our analysis of those conditions. Unilateral SDs regardless of initiation method did not result in detectable behavioral deficits in the open field or NSS.
Our optogenetic experiments revealed sex interactions. There was a sex × condition (opto vs. opto ctrl) effect where females in the opto group had a slightly longer latency to movement than males in the same group, but females in the opto ctrl group had a shorter latency to movement than males in the opto ctrl group. There was also a sex × time × condition interaction in the optogenetic NSS experiment. At the acute time-point, female opto ctrls had a slightly lower NSS than male opto ctrls, but female opto ctrls had a slightly higher NSS than male opto ctrls at the 3-h time-point. Although we did see these significant interactions, when main effect of sex was analyzed and there were no significant differences between males and females overall. There have been previously reported sex differences in this optogenetic model of SD. Chung and colleagues found a lower SD threshold in female Thy1-ChrR2 mice.36 However, altered threshold would not explain differential behavior post-SD. These data suggest SD recovery may be altered between sexes and future work will investigate these differences. Additional controls were included showing no effect of 3 mW optical exposure on male and female wild-type mouse behavior (Fig. 6).
Across our experimental approaches to initiate SDs, bilateral SDs were associated with behavioral deficits. Table 3 indicates that the escape and seeking tasks show the most consistent deficit after bilateral SDs compared with unilateral SDs and no SDs. More than 50% of mice with bilateral SDs from mTBI, KCl, or opto failed to escape from a smaller arena and did not explore three quadrants of the open field. A caveat to these tasks is that they are dependent on the motivation of the animal to explore its surroundings. Similar deficits of voluntary exploration are seen with rodent models of headaches, which are also associated with mTBIs.37 SDs are also implicated in the visual aura associated with migraines and in headaches in general.38,39 All the mTBI animals with bilateral SDs failed the round 1-cm beam walk, but approximately 50% of the sham mice with no SDs also failed this task.
In these studies, we used iOS imaging to visually confirm the absence or presence of SDs. Whereas we did detect slight differences between the peak to troughs amplitudes in the SD traces, we did not quantify these differences. The iOS traces are notoriously dirty signals that are made up of changes in cerebral blood flow, endogenous fluorescence of FAD(H) and NAD(H), and changes to the water content of the brain. Further, due to movement artifacts the SD traces represent a small fraction of the animals used in these studies. It is common to investigate a single response of SD such as the cerebral blood flow response or the electrophysiological properties of SDs (i.e., DC shift duration and/or duration of high-frequency suppression). However, iOS imaging is easy to implement in any laboratory to simply confirm the absence or presence of SDs.
mTBI-induced neurological impairment is attributed to the neurophysiological effects described by the neurometabolic cascade, including large changes in extracellular K+ and glutamate.6,7,40 Similarly, SDs are associated with complete depolarization of neuronal tissue resulting in large increases in extracellular K+ and glutamate.20,41,42 SDs are known to disrupt ion distributions, suppress high-frequency brain activity, alter cerebral blood flow, and uncouple neurovascular units.10,26,43–45 All downstream consequences of SDs likely contribute to neurological impairment. SDs result in suppression of cortical high-frequency activity due to the depolarization block of neurons and synaptic silencing by adenosine.26,46 The SD-induced suppression of high-frequency activity lasts up to 10 min, which is similar to the period of immobility. However, it remains unclear how long it takes for the cortex to become fully functional once high-frequency activity returns.14 Nonetheless, our data support the hypothesis that bilateral SDs are associated with short-term behavioral deficits in mice.
SDs are known to be associated with certain behavioral phenotypes. The most common acute behaviors associated with SDs alone are freezing and immobility. Freezing has been described following KCl, wire-poke-induced SD in rats, and optogenetically induced SD in mice.24,28,35,45 Similar to our work described here, a rat study described that mTBI-induced SDs had a greater latency to locomotion relative to mTBI animals without SDs.47 Unilateral SDs have been shown to have unique motor behavioral deficits. Mice with unilateral optogenetic-induced SD displayed a decreased contralateral grip strength in a wire-grip test.28 Additionally, awake rats with a unilateral SD initiated with mechanical poke displayed ipsilateral circling within 100–300 sec following SD initiation.45 In addition to motor behavior effects of SDs, pain-like behavior has been described following SD alone. Periorbital allodynia has been seen following KCl and optogenetically induced SDs in rats and mice, respectively.24,27 SDs are also associated with spatial memory impairments. Rats with KCl-induced SD showed deficits in the Barnes maze compared with rats without SDs.25 Collectively, these data support the link between behavioral deficits and SDs.
There is growing evidence for the role of SDs in mTBIs and the associated behavioral deficits.16,48 Mosley and colleagues reported evidence that mTBI-induced SDs are associated with deficits in the Morris water maze.42 Bouley and associates showed long-term (24 and 48 h) behavioral deficits using a similar NSS and weight-drop mTBI model in mice. Similar to our studies, the deficits in the NSS were only present in animals with confirmed SDs.15 Our previous work also showed a correlation between the presence of SDs with acute behavioral deficits in the open field task.14 Here, we show that SDs alone are associated with similar deficits in the NSS relative to mTBI animals with confirmed bilateral SDs. To fully understand the mechanistic role of SDs in the acute behavioral deficits, mTBI-induced SDs will need to be pharmacologically blocked. Unfortunately, known pharmacological blockers of SDs, such as ketamine and memantine, are associated with significant behavioral alterations on their own, making it difficult to assess behavior. Therefore, optogenetic or chemogenic approaches may be required to fully understand the mechanistic role of SDs in mTBIs.
Here we provide a scientific premise for targeting SDs and their downstream consequences to alleviate acute symptoms of an mTBI. Further research is needed to identify mechanisms by which SDs could induce behavioral symptoms lasting days to weeks. There are many known downstream consequences of SDs that could be targeted and potentially other mechanisms that have yet to be established. There are three likely contributors to the acute behavioral deficits: metabolic imbalance, cortical dysfunction, and neurovascular uncoupling.
First, SDs are associated with a huge metabolic burden to restore electro-chemical gradients required for normal neuronal activity.10 This metabolic recovery requires ATP production and glucose uptake described in the neurometabolic cascade.7,26,40 The metabolic load could disrupt the ability of neurons to fire action potentials. Second, SDs were first described by the resulting suppression of high-frequency activity that lasts minutes.46,49,50 However, it remains unclear how long it takes for high-order cortical activity such as cross-frequency coupling and hemispheric coherence to recover following SDs that could contribute to the behavioral deficits. Third, SDs are known to induce neurovascular uncoupling leaving vasculature unresponsive to neuronal demand and exacerbating the metabolic imbalance.10,16,41,42 The neurovascular uncoupling can last for hours leaving the vasculature unresponsive to neuronal activity.42,43 The lack of appropriate oxygen and glucose may alter neuronal firing and contribute to the acute behavioral deficits associated with mTBIs.
Conclusions
SDs are major disruptors of brain physiology and metabolism and have been shown to occur following mild closed-skull injuries in rodents. We show here that bilateral SDs are associated with acute behavioral deficits regardless of the method of initiation (i.e., mTBI, KCl, or optogenetics). Our work supports the idea that SDs contribute to neurological dysfunction and behavioral deficits in mice, and targeting downstream consequences of SDs may promote brain recovery and repair.
Transparency, Rigor, and Reproducibility Summary
These studies followed the best practice recommendations for rigor52 and ARRIVE 2.0 guidelines. All procedures were performed in accordance with the author's university IACUC. C57BL/6J mice are broadly used in brain injury research and will increase rigor of the field overall. C57BL/6J mice were used in these studies and were purchased directly from Jackson Laboratory (Jax #000664). For our optogenetic studies, we used a transgenic line expressing channel rhodopsin (Thy1-ChR-EGF line 18, Jax # 007612). Thy1-ChR-EGF animals were maintained in-house by breeding homozygote-positive mice together. All mice were on a standard diet and housed at 75°F at 40% humidity in a 12-h reversed light cycle. All mice were between 8 and 14 weeks of age.
Recent work indicates sex differences in outcomes of brain injury models and in vulnerability to SDs.20,21 All data were collected using roughly even numbers of male and female mice. Sex differences were statistically investigated in all our analyses. Behavioral testing was scored with automated EthoVision software or by a researcher blinded to experimental conditions to reduce variability and bias. To maximize reproducibility, all studies were conducted with interleaved controls (i.e., sham followed by an mTBI or vice versa). The “n” for our statistical analysis was considered one animal and is represented as one data point in the figures. A priori power analysis was done to assess sample sizes with previously published mTBI behavioral data. However, when the presence or absence of the SDs became apparent in our data set, additional animals were needed. We expected more variability in our injured groups relative to our sham-treated animals and increased the “n”s in our injured group to account for this. Similar a priori analysis was done for our KCl and optogenetic studies assuming the initiation of SDs in every animal. Again, when SD initiation was not consistent additional animals were added with more animals in the SD groups to account for increased variability.
Sample sizes for our six experimental conditions were as follows: n = 38 mTBI, n = 27 sham, n = 24 KCl, n = 17 saline, n = 21 opto, n = 18 opto ctrl, n = 5 WT 0 mW, and n = 6 WT 3 mW. All analyses were conducted in SPSS (version 20.0; IBM Corp., Armonk, NY, USA) using either GEEs for repeated measures (NSS) or GLMs. Our data were determined to have various distributions (normal, gamma, and negative binomial). Therefore, the best model for the distribution was selected. Type III sum of squares was used in all analyses, including those that examined the potential moderating role of SDs on neurobehavioral outcomes. Upon publication this data will be available on dandiarchive.org.
Supplementary Material
Acknowledgments
We would like to acknowledge the Center for Brain Recovery and Repair Preclinical Core (P20/P30GM109089-01).
Authors' Contributions
NJP and RAM conceived and designed the analyses. NJP, BF, CJM, VLC, BRH, and RAM collected data. NJP, VLC, BRH, and ARM performed the analyses. NJP and RAM wrote the manuscript.
Funding Information
These studies were supported by the National Institutes of Health/National Institute of General Medical Sciences (NIH/NIGMS) Center for Brain Recovery and Repair Center grant P20/P30GM109089-01. Department of Defense CDMRP PR200891.
Author Disclosure Statement
No competing financial interests exist.
Supplementary Material
References
- 1. Kay T, Harrington DE, Adams R, et al. Definition of mild traumatic brain Injury. J Head Trauma Rehabil 1993;8(3):86–87. [Google Scholar]
- 2. Mayer AR, Quinn DK, Master CL. The spectrum of mild traumatic brain injury: a review. Neurology 2017;89(6):623–632. [DOI] [PMC free article] [PubMed] [Google Scholar]
- 3. Mccrory P, Meeuwisse W, Dvorak J, et al. Consensus statement on concussion in sport-the 5th International Conference on Concussion in Sport held in Berlin, October 2016. Consensus statement. Br J Sports Med 2018;51:838–847; doi: 10.1136/bjsports-2017-097699 [DOI] [PubMed] [Google Scholar]
- 4. Bigler ED, Maxwell WL. Neuropathology of mild traumatic brain injury: relationship to neuroimaging findings. Brain Imaging Behav 2012;6(2):108–136; doi: 10.1007/S11682-011-9145-0/FIGURES/20 [DOI] [PubMed] [Google Scholar]
- 5. Dikmen S, Machamer J, Temkin N. Mild traumatic brain injury: longitudinal study of cognition, functional status, and post-traumatic symptoms. J Neurotrauma 2017;34:1524–1530; doi: 10.1089/neu.2016.4618 [DOI] [PMC free article] [PubMed] [Google Scholar]
- 6. Brent DA, Max J. Psychiatric sequelae of concussions. Curr Psychiatry Rep 2017;19:108; doi: 10.1007/s11920-017-0862-y [DOI] [PubMed] [Google Scholar]
- 7. Giza CC, Hovda DA. The new neurometabolic cascade of concussion. Neurosurgery 2014;75(0 4):s24–s33; doi: 10.1227/NEU.0000000000000505 [DOI] [PMC free article] [PubMed] [Google Scholar]
- 8. Katayama Y, Becker DP, Tamura T, et al. Massive increases in extracellular potassium and the indiscriminate release of glutamate following concussive brain injury. J Neurosurg 1990;73:889–900. [DOI] [PubMed] [Google Scholar]
- 9. Takahashi H, Manaka S, Sano K. Changes in extracellular potassium concentration in cortex and brain stem during the acute phase of experimental closed head injury. J Neurosurg 1981;55:708–717. [DOI] [PubMed] [Google Scholar]
- 10. Mayevsky A, Chance B. Repetitive patterns of metabolic changes during cortical spreading depression of the awake rat. Brain Res 1974;65:529. [DOI] [PubMed] [Google Scholar]
- 11. Yoshino A, Hovda DA, Kawamata T, et al. Dynamic changes in local cerebral glucose utilization following cerebral concussion in rats: evidence of a hyper- and subsequent hypometabolic state. Brain Res 1991;561(1):106–119; doi: 10.1016/0006-8993(91)90755-K [DOI] [PubMed] [Google Scholar]
- 12. Koizumi H, Fujisawa H, Ito H, et al. Effects of mild hypothermia on cerebral blood flow-independent changes in cortical extracellular levels of amino acids following contusion trauma in the rat. Brain Res 1997;747(2):304–312; doi: 10.1016/S0006-8993(96)01240-1 [DOI] [PubMed] [Google Scholar]
- 13. Meier TB, Bellgowan PSF, Singh R, et al. Recovery of cerebral blood flow following sports-related concussion. JAMA Neurol 2015;72(5):530–538; doi: 10.1001/JAMANEUROL.2014.4778 [DOI] [PubMed] [Google Scholar]
- 14. Pacheco JM, Hines-Lanham A, Stratton C, et al. Spreading depolarizations occur in mild traumatic brain injuries and are associated with postinjury behavior. eNeuro 2019;6(6); doi: 10.1523/ENEURO.0070-19.2019 [DOI] [PMC free article] [PubMed] [Google Scholar]
- 15. Bouley J, Chung DY, Ayata C, et al. Cortical spreading depression denotes concussion injury. J Neurotrauma 2019;36:1008–1017; doi: 10.1089/neu.2018.5844 [DOI] [PMC free article] [PubMed] [Google Scholar]
- 16. Parker E, Aboghazleh R, Mumby G, et al. Concussion susceptibility is mediated by spreading depolarization-induced neurovascular dysfunction. Brain 2022;145(6):2049–2063; doi: 10.1093/brain/awab450/6470601 [DOI] [PMC free article] [PubMed] [Google Scholar]
- 17. Meadows C, Davis H, Mohammad L, et al. Spreading depolarization after chronic subdural hematoma evacuation: associated clinical risk factors and influence on clinical outcome. Neurocrit Care 2021;35(Suppl 2):105–111; doi: 10.1007/s12028-021-01339-5 [DOI] [PMC free article] [PubMed] [Google Scholar]
- 18. Mohammad LM, Abbas M, William Shuttleworth C, et al. Spreading depolarization may represent a novel mechanism for delayed fluctuating neurological deficit after chronic subdural hematoma evacuation. J Neurosurg 2021;134(4); doi: 10.3171/2020.1.JNS192914 [DOI] [PubMed] [Google Scholar]
- 19. Akcali D, Sayin A, Sara Y, et al. Does single cortical spreading depression elicit pain behaviour in freely moving rats? Cephalalgia 2010;30(10):1195–1206; doi: 10.1177/0333102409360828/ASSET/IMAGES/LARGE/10.1177_0333102409360828-FIG2.JPEG [DOI] [PubMed] [Google Scholar]
- 20. Adámek S, Vyskočil F. Potassium-selective microelectrode revealed difference in threshold potassium concentration for cortical spreading depression in female and male rat brain. Brain Res 2011;1370:215–219; doi: 10.1016/J.BRAINRES.2010.11.018 [DOI] [PubMed] [Google Scholar]
- 21. Mollayeva T, Mollayeva S, Colantonio A. Traumatic brain injury: sex, gender and intersecting vulnerabilities. Nat Rev Neurol 2018;14(12):711–722; doi: 10.1038/s41582-018-0091-y [DOI] [PubMed] [Google Scholar]
- 22. Pinkowski NJ, Guerin J, Zhang H, et al. Repeated mild traumatic brain injuries impair visual discrimination learning in adolescent mice. Neurobiol Learn Mem 2020;175:107315; doi: 10.1016/J.NLM.2020.107315 [DOI] [PMC free article] [PubMed] [Google Scholar]
- 23. Kudo C, Nozari A, Moskowitz MA, et al. The impact of anesthetics and hyperoxia on cortical spreading depression. Exp Neurol 2008;212(1):201; doi: 10.1016/J.EXPNEUROL.2008.03.026 [DOI] [PMC free article] [PubMed] [Google Scholar]
- 24. Filiz A, Tepe N, Eftekhari S, et al. CGRP receptor antagonist MK-8825 attenuates cortical spreading depression induced pain behavior. Cephalalgia 2019;39(3):354–365; doi: 10.1177/0333102417735845 [DOI] [PubMed] [Google Scholar]
- 25. Urbach A, Baum E, Braun F, et al. Cortical spreading depolarization increases adult neurogenesis, and alters behavior and hippocampus-dependent memory in mice. J Cereb Blood Flow Metab 2017;37(5):1776–17909; doi: 10.1177/0271678X16643736 [DOI] [PMC free article] [PubMed] [Google Scholar]
- 26. David Andrew R, Hartings JA, Ayata C, et al. The critical role of spreading depolarizations in early brain injury: consensus and contention. Neurocrit Care 2022;37:83–101; doi: 10.1007/s12028-021-01431-w [DOI] [PMC free article] [PubMed] [Google Scholar]
- 27. Harriott AM, Chung DY, Uner A, et al. optogenetic spreading depression elicits trigeminal pain and anxiety behavior. ANN Neurol 2021;89(1):99–110; doi: 10.1002/ana.25926 [DOI] [PMC free article] [PubMed] [Google Scholar]
- 28. Houben T, Cm Loonen I, Baca SM, et al. Optogenetic induction of cortical spreading depression in anesthetized and freely behaving mice. J Cereb Blood Flow Metab 2017;37(5):1641–1655; doi: 10.1177/0271678X16645113 [DOI] [PMC free article] [PubMed] [Google Scholar]
- 29. Zheng Z, Cao Z, Luo J, et al. Characterization of intrinsic optical signal during spreading depolarization. Neuropsychiatry 2018;8(1):302–309; doi: 10.4172/Neuropsychiatry.1000351 [DOI] [Google Scholar]
- 30. Edelstein A, Amodaj N, Hoover K, et al. Computer control of microscopes using μManager. Curr Protoc Mol Biol 2010;Oct:Chapter 14:Unit14:20; doi: 10.1002/0471142727.MB1420S92 [DOI] [PMC free article] [PubMed] [Google Scholar]
- 31. Edelstein AD, Tsuchida MA, Amodaj N, et al. Advanced methods of microscope control using μManager software. J Biol Methods 2014;1(2); doi: 10.14440/jbm.2014.36 [DOI] [PMC free article] [PubMed] [Google Scholar]
- 32. Schindelin J, Arganda-Carreras I, Frise E, et al. Fiji—an Open Source platform for biological image analysis. Nat Methods 2012;9(7):676–682; doi: 10.1038/NMETH.2019 [DOI] [PMC free article] [PubMed] [Google Scholar]
- 33. Sawant-Pokam PA, Vail TJ, Metcalf CS, et al. Preventing neuronal edema increases network excitability after traumatic brain injury. J Clin Invest 2020;130(11):6005; doi: 10.1172/JCI134793 [DOI] [PMC free article] [PubMed] [Google Scholar]
- 34. Harris JL, Yeh HW, Choi IY, et al. Altered neurochemical profile after traumatic brain injury: 1H-MRS biomarkers of pathological mechanisms. J Cereb Blood Flow Metabol 2012;32(12):2122; doi: 10.1038/JCBFM.2012.114 [DOI] [PMC free article] [PubMed] [Google Scholar]
- 35. Vinogradova LV, Rysakova MP, Pavlova IV. Small damage of brain parenchyma reliably triggers spreading depolarization. Neurol Res 2019;42(1):76–82; doi: 10.1080/01616412.2019.1709745 [DOI] [PubMed] [Google Scholar]
- 36. Chung DY, Sadeghian H, Qin T, et al. Determinants of optogenetic cortical spreading depolarizations. Cereb Cortex 2019;29(3):1150–1161; doi: 10.1093/CERCOR/BHY021 [DOI] [PMC free article] [PubMed] [Google Scholar]
- 37. Vuralli D, Ayata C, Bolay H. Cognitive dysfunction and migraine. J Headache Pain 2018;19(1); doi: 10.1186/S10194-018-0933-4 [DOI] [PMC free article] [PubMed] [Google Scholar]
- 38. Hadjikhani N, Sanchez Del Rio M, Wu O, et al. Mechanisms of migraine aura revealed by functional MRI in human visual cortex. Proc Natl Acad Sci U S A 2001;98(8):4687–4692; doi: 10.1073/PNAS.071582498 [DOI] [PMC free article] [PubMed] [Google Scholar]
- 39. Chen SP, Ayata C. Spreading depression in primary and secondary headache disorders. Curr Pain Headache Rep 2016;20(7); doi: 10.1007/S11916-016-0574-8 [DOI] [PubMed] [Google Scholar]
- 40. Romeu-Mejia R, Giza CC, Goldman JT. Concussion pathophysiology and injury biomechanics. Curr Rev Musculoskelet Med 2019;12(2):105; doi: 10.1007/S12178-019-09536-8 [DOI] [PMC free article] [PubMed] [Google Scholar]
- 41. Chang JC, Shook LL, Biag J, et al. Biphasic direct current shift, haemoglobin desaturation and neurovascular uncoupling in cortical spreading depression. Brain 2010;133(Pt 4):996–1012; doi: 10.1093/brain/awp338 [DOI] [PMC free article] [PubMed] [Google Scholar]
- 42. Mosley N, Chung JY, Jin G, et al. Cortical spreading depolarization, blood flow, and cognitive outcomes in a closed head injury mouse model of traumatic brain injury. Neurocrit Care 2022;37(Suppl 1):102–111; doi: 10.1007/s12028-022-01474-7 [DOI] [PMC free article] [PubMed] [Google Scholar]
- 43. Kirov SA, Fomitcheva IV, Sword J. Rapid neuronal ultrastructure disruption and recovery during spreading depolarization-induced cytotoxic edema. Cereb Cortex 2020;30(10):5517–5531; doi: 10.1093/cercor/bhaa134 [DOI] [PMC free article] [PubMed] [Google Scholar]
- 44. Helbok R, Schiefecker AJ, Friberg C, et al. Spreading depolarizations in patients with spontaneous intracerebral hemorrhage: association with perihematomal edema progression. J Cereb Blood Flow Metab 2017;37(5):1871–1882; doi: 10.1177/0271678X16651269 [DOI] [PMC free article] [PubMed] [Google Scholar]
- 45. Vinogradova LV, Suleymanova EM, Medvedeva TM. Transient loss of interhemispheric functional connectivity following unilateral cortical spreading depression in awake rats. Cephalalgia 2021;41(3):353–365; doi: 10.1177/0333102420970172 [DOI] [PubMed] [Google Scholar]
- 46. Lindquist BE, Shuttleworth W. Evidence that adenosine contributes to Leao's spreading depression in vivo. J Cereb Blood Flow Metab 2017;37(5):1656–1669; doi: 10.1177/0271678X16650696 [DOI] [PMC free article] [PubMed] [Google Scholar]
- 47. Parker E, Aboghazleh R, Mumby G, et al. Concussion susceptibility is mediated by spreading depolarization-induced neurovascular dysfunction. Brain 2022;145(6):2049–2063; doi: 10.1093/brain/awab450/6470601 [DOI] [PMC free article] [PubMed] [Google Scholar]
- 48. Hanalioglu S, Hidayatov T, Isikay I, et al. Early cerebral blood flow changes, cerebrovascular reactivity and cortical spreading depolarizations in experimental mild traumatic brain injury model. Turk Neurosurg 2022;32(3):488–499; doi: 10.5137/1019-5149.JTN.37742-22.1 [DOI] [PubMed] [Google Scholar]
- 49. Leao AAP. Spreading depression of activity in the cerebral cortex. J Neurophysiol 1944;7:391–396. [DOI] [PubMed] [Google Scholar]
- 50. LEAO AAP. Further observations on the spreading depression of activity in the cerebral cortex. J Neurophysiol 1947;10(6):409–414; doi: 10.1152/JN.1947.10.6.409 [DOI] [PubMed] [Google Scholar]
- 51. Steward O, Balice-Gordon R. Rigor or mortis: best practices for preclinical research in neuroscience. Neuron 2014;84(3):572–581; doi: 10.1016/j.neuron.2014.10.042 [DOI] [PubMed] [Google Scholar]
Associated Data
This section collects any data citations, data availability statements, or supplementary materials included in this article.