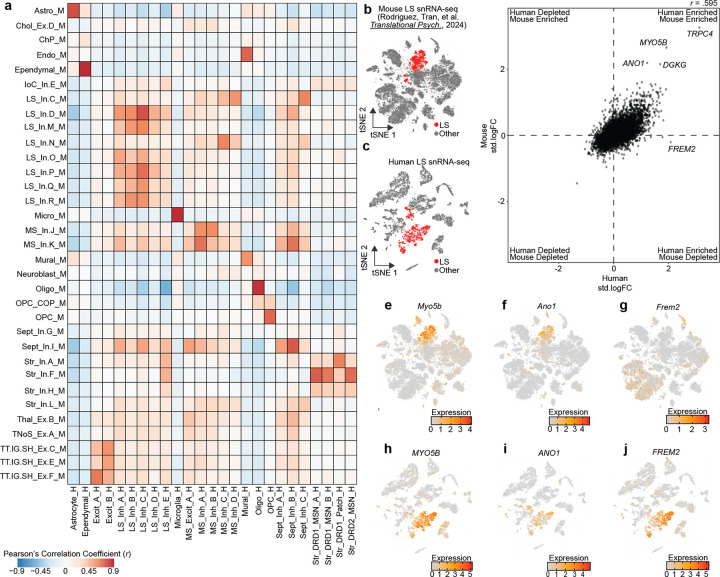
Figure 3.
Identification of conserved transcriptional markers for lateral septum (LS) neurons. a, Heatmap of Pearson’s correlation coefficients calculated by correlating the standardized log fold changes of the top 100 marker genes from each cluster that has a homologous partner in each species. b-c, t-SNE of mouse and human snRNA-seq datasets containing LS neurons. Cells are colored by LS neuronal identity. d, Standardized log fold changes were calculated for all genes in LS neurons in mouse or human and correlated to identify conserved transcriptional markers. e-g, Feature plots demonstrating distribution of expression of Myo5b, Ano1, and Frem2 in mouse. h-j, Feature plots demonstrating distribution of expression of MYO5B, ANO1, and FREM2 in human snRNA-seq dataset containing the LS.

