Abstract
APOBEC3B cytosine deaminase contributes to the mutational burdens of tumors, resulting in tumor progression and therapy resistance. Small molecule APOBEC3B inhibitors have potential to slow or mitigate these detrimental outcomes. Through molecular dynamics (MD) simulations and computational solvent mapping analysis, we identified a novel putative allosteric pocket on the C-terminal domain of APOBEC3B (A3Bctd), and virtually screened the ChemBridge Diversity Set (N~110,000) against both the active and potential allosteric sites. Selected high-scoring compounds were subsequently purchased, characterized for purity and composition, and tested in biochemical assays, which yielded 13 hit compounds. Orthogonal NMR assays verified binding to the target protein. Initial selectivity studies suggest these compounds preferentially target A3Bctd over related deaminase APOBEC3A (A3A), and MD simulations indicate this selectivity may be due to the steric repulsion from H56 that is unique to A3A. Taken together, our studies represent the first virtual screening effort against A3Bctd that has yielded candidate inhibitors suitable for further development.
1. Introduction
APOBEC3 (apolipoprotein B mRNA editing catalytic polypeptide-like 3, A3) enzymes catalyze the conversion of a cytosine base to uracil in single-stranded DNA (ssDNA) (Figure 1A).1 There are seven members of the A3 family, A3A/B/C/D/F/G/H, and each protein contains either a single catalytic domain or two domains, where the C-terminal domain (ctd) is catalytic and the N-terminal domain (ntd) is pseudocatalytic (Figure 1B).2,3 A3 proteins are structurally similar, containing a conserved five β-sheet, six α-helix tertiary structure, where the flexible loops 1, 3, and 5 surround the active site to form important interactions with the ssDNA substrate (Figure 1C, L1/3/5).4 Most A3 proteins prefer to deaminate at a 5’-TC-3’ dinucleotide context, where the −1 T makes a number of interactions with loop 7 (Figure 1C, yellow, L7); A3G is the one exception and prefers to deaminate at a 5’-CC-3’ dinucleotide motif.5
Figure 1.
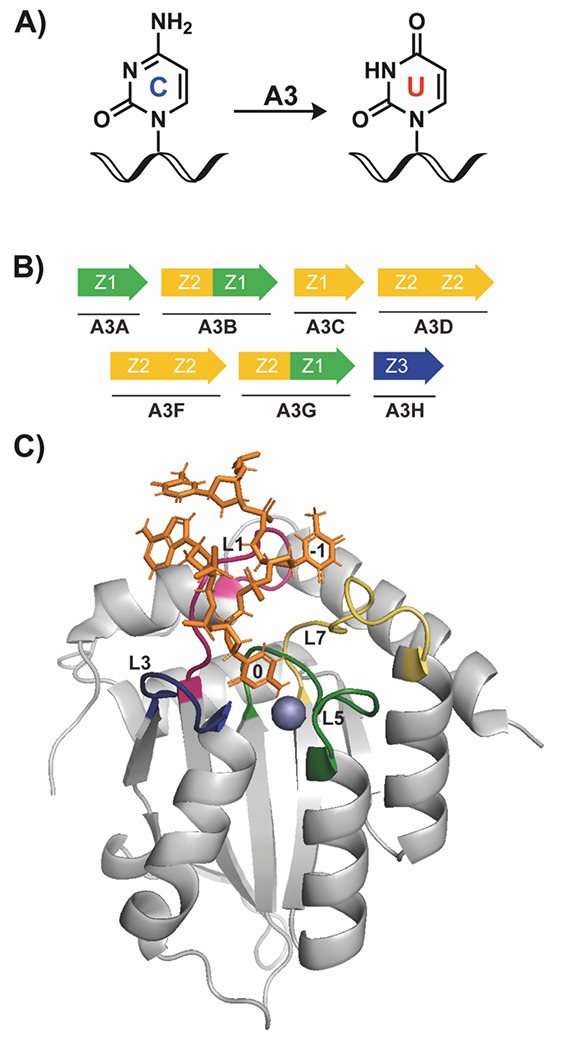
Overview of APOBEC3 protein structure and function. A) A3 enzymes deaminate at target cytosine (C) bases in ssDNA, converting the nucleobase to uracil (U). B) The seven members of the A3 family are either single domain (A3A/C/H) or double domain (A3B/D/F/G) enzymes. Colors represent different phylogenetic grouping, based on domain sequence. C) Structure of A3Bctd bound to a single-stranded 5-mer oligonucleotide (orange). In this structure, the 0 on the oligonucleotide indicates the target cytosine which is deaminated by A3 proteins, and −1 indicates the 5’ nucleotide, which makes extensive interactions with the protein to impart binding selectivity. Highlighted loops are loops 1 (L1, pink), 3 (L3, blue), 5 (L5, green), and 7 (L7, yellow), which are also important in determining substrate selectivity. The blue sphere is a coordinated zinc ion in the active site, which is required for enzymatic activity. PDB: 5TD5.
A3D/F/G/H were originally identified as a part of the innate immune system defense against viral infection that function to clear foreign DNA from cells,6 but more recently, errant A3A and A3B activity has been implicated as drivers of genomic instability related to cancer tumor mutagenesis.7–9 High A3A and A3B expression is correlated with more aggressive tumors, and poor clinical prognosis;10,11 however, the exact role of each enzyme in cancer mutagenesis is still debated. One recent study suggests both A3A and A3B contribute to the mutational landscape in various cancers, and that A3B may also play a role in restricting A3A activity.8 Therefore, questions remain on the exact function of A3B in cancer development and metastasis, as well as its interactions with A3A, which could be better understood with the use of selective small molecule inhibitors.
Early APOBEC inhibitors (e.g., MN1 and MN23, see Figure S1) were identified from high-throughput screening using a quenched fluorescence deaminase assay; however, those compounds suffer from multiple structural liabilities that preclude further development.12,13 A well-known cytidine deaminase transition state inhibitor, deoxyzebularine (dZ), was integrated into a ssDNA strand to generate a micromolar inhibitor of A3B, 14,15 and further elaboration of zebularine-based nucleic acid inhibitors have garnered inhibitors with promising biochemical and cellular potency.16
However, nucleic acid-based analogues of this design require delivery agents or further modifications to enable cellular uptake, limiting utility as probes. Most recently, a number of nonspecific A3/AID small molecule inhibitors were published with mid-micromolar inhibitory activity (Figure S1), but these compounds have not been tested for cellular efficacy and are not selective within the A3 family or among the wider APOBEC family.17,18
A3B is a particularly challenging drug target. It has a small and closed active site and the dynamics of the active site opening are not well understood. We ascribe these features to the difficulty in identifying A3B inhibitors from screening of small molecule libraries.19 Therefore, we turned to computer-aided drug discovery (CADD) as a new approach for targeting A3B. To date, there are no published crystal structures of A3B in complex with small molecules. Moreover, the A3Bctd protein used in published crystal structures is often heavily mutated.4,20 Therefore, in silico modeling and CADD of wild-type A3Bctd can aid ligand design where structure-guided crystallography lacks. With the increase in computing power and improvements in underlying algorithms, in silico screening can explore a larger chemical space than is feasible with typical high-throughput screening. Here, we report our virtual screening effort against both the active and allosteric sites, as well as the biochemical and biophysical validation of the compounds. We also show data suggesting that these compounds may be selective for A3Bctd over A3A.
2. Results and Discussion
2.1. Molecular dynamics (MD) simulations of A3Bctd identify a putative allosteric site
We previously explored dynamics of wild-type A3Bctd both in apo and ssDNA-bound forms via MD simulations totaling 16 μs.21 In this prior work, the DNA-bound crystal structure (PDB: 5TD5) was modeled back to wild-type by reverting all mutations to the wild-type sequence, as well as adding back in the deleted L3. All A3Bctd snapshots from those MD simulations were clustered based on their active-site shape using POVME3.0 program (Figure 2A).22 While the general structure is similar between the eight different clusters, differences can be observed in the flexible loop regions, as well as in the positioning of the α-helices.
Figure 2.
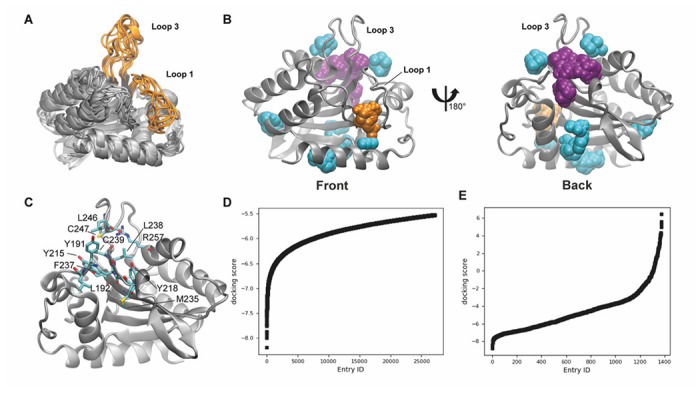
Molecular dynamics simulations and virtual screening of the A3Bctd active site and putative allosteric pocket. A) Eight cluster representative structures from MD simulations shown in silver ribbons, loops 1 and 3 highlighted in orange. B) Binding hot spots of Cluster6 representative structure depicted with FTMap probes as spheres. The front view highlights the FTMap probes binding into the active site, colored in orange. The back view highlights the location of the putative allosteric site, where the FTMap probes are colored in purple. C) Amino acids in 4 Å proximity of FTMap probes predicted to bind the putative allosteric site. This is the same view as the one shown on the right side of panel B. D) and E) Docking scores of compounds (in kcal/mol) from the virtual screen targeting the D) active site and E) putative allosteric site. These results are a representation of the screening results, where compounds with a > 5.5 kcal/mol docking score for the active site (D) and > 6 kcal/mol docking score for the putative allosteric site (E) are not shown for clarity.
All eight representative A3Bctd snapshots – one from each of the eight clusters POVME detected – were then assessed for binding hot spots using FTMap, a computational solvent mapping program.23 The program utilizes small organic probe molecules and globally searches the protein surface for druggable sites. Consensus sites (CS) on the protein are locations where the highest number of probes dock. In addition to the A3Bctd active site (Figure 2B), an additional CS hot spot was detected by FTMap at the back of L3 and far from the active site (Figure 2C). FTProd, which compares and classifies FTMap-detected binding sites across multiple protein structures,24 detected this new site as a binding hot spot in 7 out of 8 cluster representative A3Bctd structures (Figure S2). Due to the difficulty of finding small molecules that bind the A3Bctd active site via HTS, we decided to assess both sites through virtual screening. Cluster0 and Cluster6 representative A3Bctd snapshots were selected for virtual screening as they had the first and second largest number of FTMap probes at the active site and the putative allosteric site, respectively.
2.2. Virtual screening against the A3Bctd active site and putative allosteric site
Schrodinger Glide was employed to virtually screen the ChemBridge Diversity Set of 110,000 compounds for the active site, as well as the putative allosteric site, in their MD-generated conformations selected above.25-27 The compounds were ranked based on their docking score and, separately, their ligand efficiency for the active site and putative allosteric site independently. Targeting the active site, 387 compounds were selected based on a docking score cutoff of −6.8 kcal/mol and another 311 compounds were selected with a ligand efficiency cutoff of −0.37 kcal/mol (Figure 2D). An additional 712 compounds were selected using a docking score cutoff of −3.5 kcal/mol from the virtual screen targeting putative allosteric site (Figure 2E). Filtering further based on compound availability, the final set of 1408 compounds was purchased for in vitro testing.
2.3. Initial screening and characterization yielded 13 primary hits
The 1408 compounds were screened at 500 μM in our previously published microplate-based deaminase activity assay in biological duplicate.12 The previously reported A3B inhibitors MN1 and MN23 were used as positive controls in the assay, and MN1 – also known as aurintricarboxylic acid – also inhibits UDG.12 Hits were considered those in which the residual deaminase activity of both replicates was less than 30% (Figure 3A). The primary in vitro screen of 1408 compounds yielded 23 hits, resulting in a total hit rate of approximately 2%. This hit rate is reasonable given that previous HTS against APOBEC3 enzymes have generated hit rates between 0.02% and 0.8%;19 in fact, we would expect a higher hit rate than a traditional screen of a diverse compound library given that the compounds were selected via a primary in silico screen. The plated compounds that hit in single-point response were then retested in an additional single-point replicate, followed by dose response to reconfirm (Figures S3-4). Of the 23 hits, ten did not reconfirm upon follow-up testing and three contained known PAINS-like moieties,28 yielding a final total of 10 hits. One of the best performing compounds among the hits, 10, had a docking score of −6.84 kcal/mol. The docking scores selected for in vitro screening extended from −6.8 to −8.1 kcal/mol; therefore, the docking score of 10 was low compared to others. If compounds with that docking score showed activity against A3Bctd, we hypothesized that the original docking score cutoff may have been too stringent. Therefore, the virtual screening cutoff was lowered and more compounds were selected for a second round of testing.
Figure 3.
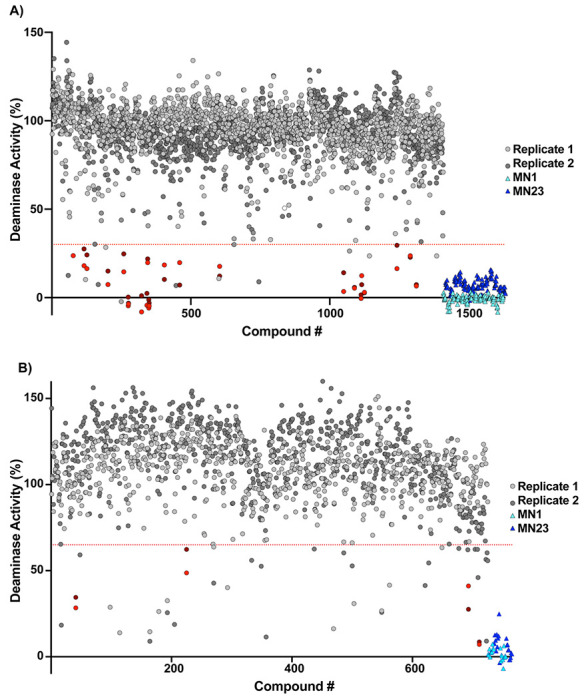
Primary screening hits from in vitro assay screening. A) First screen of 1408 compounds at 500 μM in biological duplicate. Red dots indicate positive hits. Dashed line indicates 30% residual deaminase activity cutoff. MN1 and MN23 are positive controls; the compounds are run on every plate but grouped at the end of the compound list for clarity. B) Second screen of 725 compounds at 100 μM in biological duplicate. Red dots indicate positive hits. Dashed line indicates 60% residual deaminase activity cutoff. MN1 and MN23 are positive controls.
An additional 627 compounds from a lowered binding score cutoff of −6.5 kcal/mol were tested, as well as 98 compounds that were selected based on structural and 2D/3D similarity to the initial hits including 10 (Figure 3B). These compounds were screened with the same A3Bctd activity assay at a 100 μM concentration, which is lower than the initial screening concentration of 500 μM because we were interested in those compounds that were more potent than the best hits from the initial screen. An additional four compounds were also considered hits based on a 60% residual activity cutoff, filtering for PAINS warnings, and commercial availability of additional material.
In aggregate, 19 compounds – 10 from the initial screen, four from the second screen, and five compounds discovered through SAR by catalogue against 10 – were all repurchased and the compounds were purified by preparative HPLC. Compound 27 hydrolyzed quickly in water, and further study was discontinued (Figure S25). Compound 28 was insoluble in the HPLC mobile phase and was removed from further study. In total, 17 compounds were purified to >95% purity by 215 nm and 254 nm analysis for further testing (Table S2, Figures S6-22).
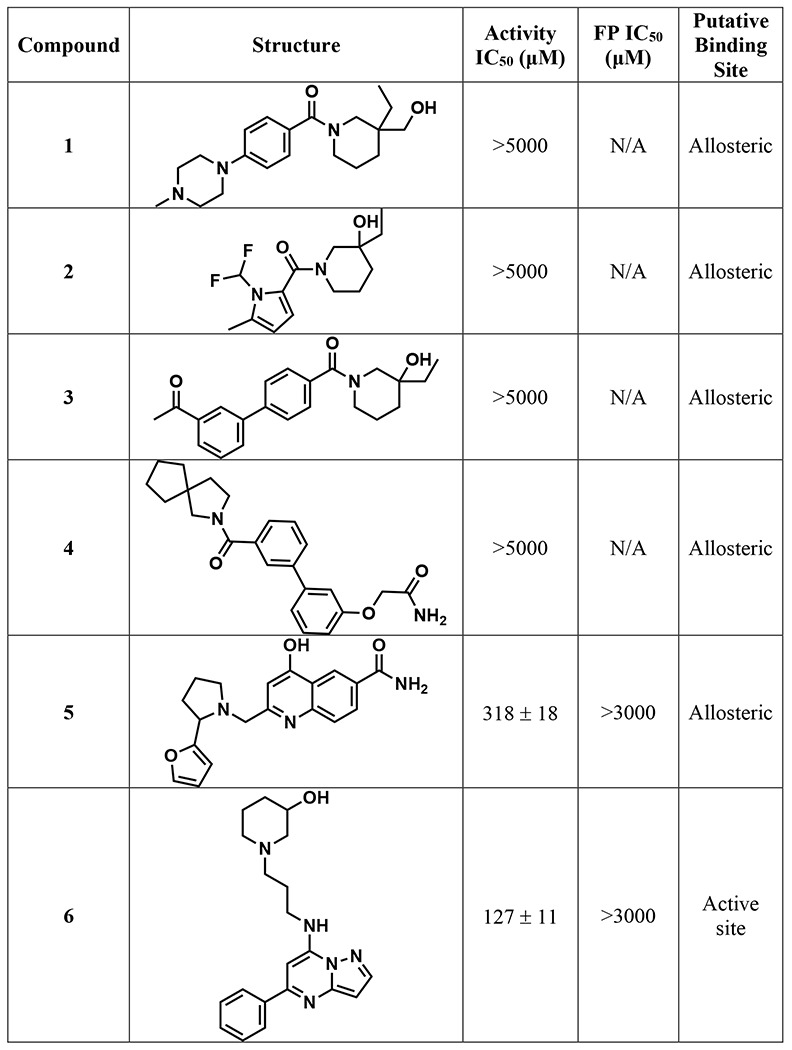
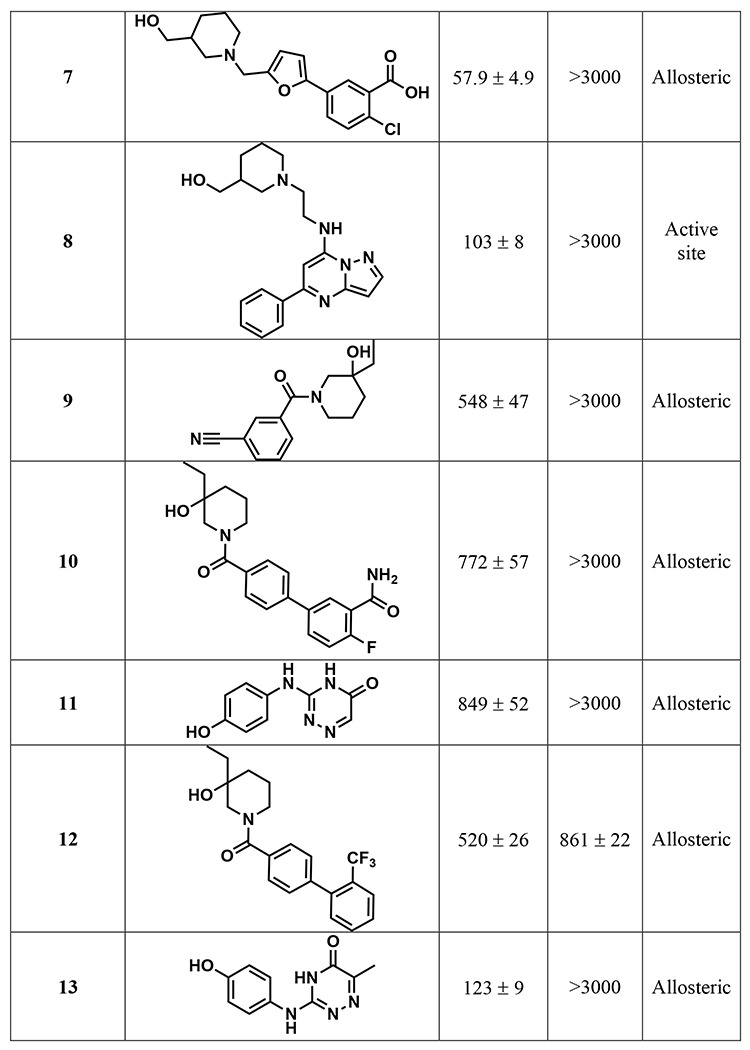
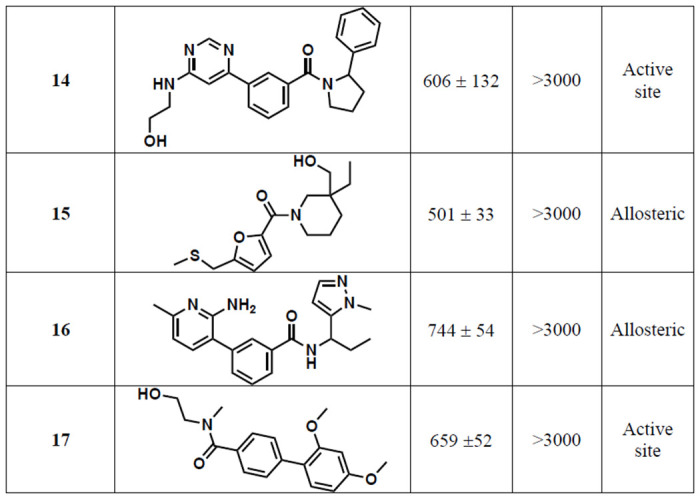
The purified compounds were then re-tested in the same activity assay used for screening, and 13 retained inhibitory activity after purification (Figure 4A). Of the four that did not inhibit, three of them were compounds selected through “SAR by catalog” against 10 and were not tested in either of the initial screens. The IC50 of most compounds that retained activity was between 500 μM and 1 mM, although four compounds have IC50 values around 100 μM (Table 1). The activity assay is a coupled assay, where it relies upon the activity of two proteins to achieve signal. The cytosine deaminase (in this case, A3Bctd) deaminates the target cytosine to a uracil, and then uracil DNA glycosylase (UDG) excises the uracil base, leaving an abasic site that can be cleaved upon addition of aqueous sodium hydroxide. If the compounds inhibit UDG and not A3Bctd, the result of the assay will appear the same. Therefore, the compounds were also tested for inhibition of UDG by performing the same assay, except the substrate oligo has the uracil base instead of a cytosine. None of the 13 compounds that inhibited A3Bctd after purification inhibited UDG in this control assay (Table S4).
Figure 4.
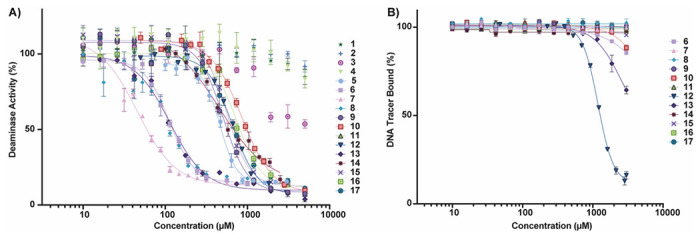
Confirmatory testing of repurchased and purified compounds. A) Activity assay against A3Bctd after compound purification. Graph is one representative replicate of two biological replicates. Error bars are the standard error of the mean (SEM) of three technical replicates. B) Fluorescence polarization assay to test the ability of the compounds to displace DNA. Representative replicate of two biological replicates. Error bars are the SEM of three technical replicates.
Table 1.
Structures and associated IC50S of the 17 repurified compounds, along with the putative binding site based on virtual screening. IC50 is the average ± SEM of two biological replicates.
|
|
|
2.4. Fluorescence polarization assay shows compounds do not displace DNA from the active site
A fluorescence polarization assay, which measures displacement of a fluorophore-labeled DNA substrate, was used to assess potential binding location and mode of action of the compounds that inhibited A3Bctd.14,15 Most of the compounds did not displace DNA from the active site (Figure 4B); some compounds appeared to potentially displace DNA at very high concentrations (>1 mM). A negative result in this FP assay does not necessarily mean the compounds are not binding to the protein; instead, it indicates the mechanism of inhibition is likely not through substrate displacement. Only one compound, 12 displaced DNA from the active site of A3Bctd in a dose-dependent manner with an IC50 of 861 ± 22 μM. This was particularly interesting because 12 is a closely related analogue of 10, which did not displace ssDNA. The two compounds differ only in the substitution pattern on the aryl ring farther from the piperidine moiety, and we hypothesized that additional steric bulk at the ortho position could interact with loop 3, leading to substrate displacement. Of the 12 compounds tested in the FP assay, four were predicted to bind to the active site: 6, 8, 14, and 17 (Figure 4B). One compound, 5 could not be tested in additional assays, including FP, due to a lack of available material for re-purchase.
2.5. Synthesis of 10*
To obtain more material for further study 10 was synthesized in four steps (Scheme 1) and labeled 10* to differentiate this batch from commercially purchased material. Commercially available benzyl-protected piperidone 18 was reacted with EtMgBr, which yielded Grignard product 19 in good yield. Hydrogenation of the benzyl group and subsequent amidation with benzoyl chloride afforded 20 in 50% yield over two steps. Suzuki coupling of 20 with boronic acid 21 resulted in 10* in 75% yield.
Scheme 1.

Synthesis of 10*.
2.6. Assessing qualitative and quantitative binding affinity of hit compounds
Utilizing only two assays with the same readout (e.g., fluorescence) leads to the possibility of false positives due to compound interference.29 Therefore, we endeavored to rigorously characterize our hits through orthogonal assays. In order to confirm the compounds were indeed binding to the target protein, we employed the Carr-Purcell-Meiboom-Gill (CPMG) NMR pulse sequence as a ligand-observed 1H NMR method to observe compound binding.30,31 Binding of the small molecule to the target protein is qualitatively observed as attenuation in NMR signal from protons on the ligand (Figure 5). Signal attenuation was calculated by overlaying spectra obtained in the absence and presence of protein, normalizing the DMSO signal, measuring the intensity of a selected peak in the protein present sample and dividing by the intensity of the same signal in the protein absent sample, then multiplying by 100 to obtain the value as a percentage.
Figure 5.
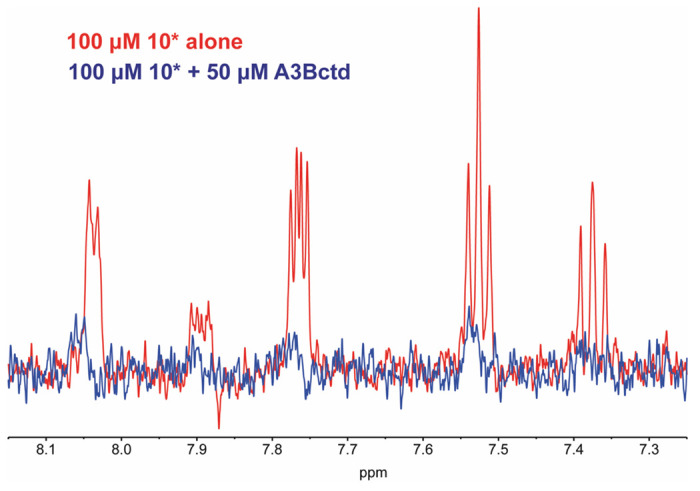
Evaluation of compounds by ligand-observed NMR. Example of compound (10*) binding as observed by CPMG NMR. Aromatic proton signals are observed in the compound alone sample; signal attenuation observed upon addition of protein.
Binding was observed for all but one of compounds that inhibited A3Bctd deaminase activity (Table 2). There was slight signal attenuation with 9, but given the error from two biological replicates, the observed signal attenuation is likely noise. Although we have quantified the signal attenuation of the compounds, the absolute value of the signal attenuation is not directly equated to the binding affinity of the compound; for example, although 6 has a signal attenuation of 59% and 10* has a signal attenuation of 44%, this does not necessarily mean 6 has a lower Kd than 10*. Signal attenuation is, in part, a factor of Kd, but there are many factors that influence the change T2 relaxation, including the chemical environment and distance between the ligand and protein protons.32
Table 2.
Ligand-observed 1H CPMG NMR signal attenuation of hit compounds (100 μM). Error reported is standard deviation of two biological replicates. Individual spectra can be found in the Supplementary Information.
| Compound | Signal attenuation (%) | Compound | Signal attenuation (%) |
|---|---|---|---|
| 6 | 58.8 ± 6.5 | 12 | 95.8 ± 5.90⊥ |
| 7 | 17.1 ± 11.4 | 13 | 28.0 ± 4.0 |
| 8 | 55.0 ± 7.9 | 14 | 41.7 ± 1.1 |
| 9 | 5.45 ± 4.46 | 15 | 20.1 ± 10.0 |
| 10* | 43.7 ± 10.2 | 16 | 33.7 ± 3.4 |
| 11 | 33.4 ± 4.7 | 17 | 49.7 ± 2.1 |
Potential compound aggregation.
One advantage of utilizing CPMG NMR as a secondary binding assay is the ability to confirm compound identification through inspection of the proton signals. Additionally, CPMG NMR can hint towards potential issues with compound aggregates; this was the case with compound 12. When observing the CPMG 1H NMR spectrum of the compound alone, we noted there were far fewer signals in the aromatic region (~6.5-8.0 ppm) than there should be based on the compound structure. However, the standard 1H NMR spectrum showed the presence of the expected aromatic proton signals (Figure S45), indicating the loss of these signals in the relaxation-edited NMR was not due to compound degradation. Instead, this suggests the compound is aggregating in solution, which potentially explains the DNA displacement seen in the FP assay. These data highlight the importance of orthogonal and robust assay testing of any hit compounds from screening.
2.7. Compound selectivity against A3A
One important parameter for the development of A3 inhibitors is understanding the selectivity across the protein family. The most closely related A3 protein to A3Bctd is A3A, which shares 92% sequence homology. Therefore, the compounds that inhibited A3Bctd were tested for inhibition against A3A in the same deaminase assay activity assay. Interestingly, none of the compounds inhibited A3A, suggesting the mechanism of inhibition was selective for A3Bctd over A3A.
To observe if these compounds could bind to A3A, we also tested the compounds in CPMG NMR. Although the compounds did not inhibit the protein, most of the compounds still bound to the protein (Table 3). Again, it is important to note that with this method, it is not appropriate to compare between protein samples and suggest a certain compound binds with a better affinity to one protein over another based on the relative signal attenuation. Although the signal attenuation has been listed here, the same aggregation issues previously observed with 12 were observed when testing the compound against A3A (Figure S79). Additionally, although more signal attenuation was observed in one replicate with 9 with A3A here than with A3Bctd above, the compound still only appeared to attenuate signal on one biological replicate and therefore was not considered a positive binder.
Table 3.
Signal attenuation in the CPMG 1H NMR assay against A3A.
| Compound | Signal attenuation (%) | Compound | Signal attenuation (%) |
|---|---|---|---|
| 6 | 55.5 ± 6.5 | 12 | 63.8 ± 2.9⊥ |
| 7 | 36.0 ± 11.6 | 13 | 44.9 ± 7.9 |
| 8 | 56.3 ± 4.7 | 14 | 23.9 ± 11.3 |
| 9 | 14.9 ± 12.5 | 15 | 19.7 ± 1.2 |
| 10* | 28.5 ± 3.8 | 16 | 29.2 ± 12.9 |
| 11 | 43.9 ± 0.1 | 17 | N/A** |
Potential compound aggregation.
Compound could not be tested due to lack of material.
In order to further understand why these compounds bind but do not inhibit A3A, explicitly solvated all-atom MD simulations of 10 with A3Bctd and A3A were performed in triplicate to evaluate the dynamics of the ligand in the allosteric pocket. In A3Bctd simulations, 10 stayed bound to the allosteric pocket for the entirety of three 1 μs simulations, and the average distance between the ligand center of mass (COM) and residue F237 COM (a central residue in the allosteric pocket) was 5.36 +/− 1.4 Å across all three replicates (Figure 6A). In A3A simulations, 10 was less stable in the allosteric pocket, and the average ligand-F54 COM distance (analogous to F237 in A3Bctd) was 20.4 +/− 6.9 Å across all three replicates (Figure 6B), suggesting that 10 makes more stabilizing interactions in the A3Bctd allosteric pocket than in A3A, despite their high sequence similarity.
Figure 6.
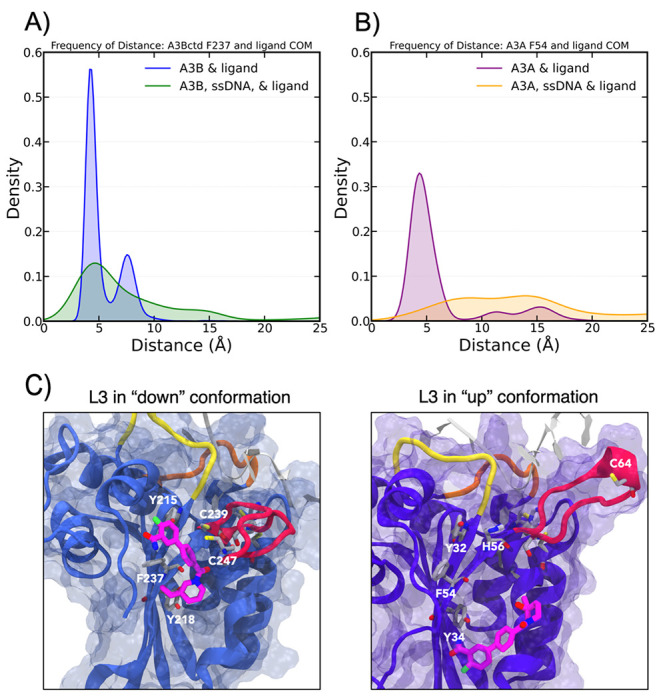
A) Distance between the ligand center of mass (COM) and F237 for all 3 μs of simulations of A3Bctd of each system. B) Distance between the ligand center of mass (COM) and F54 for all 3 μs of simulations of A3A of each system. C) A3A (left) and A3Bctd (right) with 10 in the allosteric pocket, with the up and down conformation of L3 (in red) displayed. L1 is shown in yellow, and L7 is shown in orange. ssDNA is shown in gray, and selected residues in the allosteric site are highlighted.
In A3A simulations, L3 displays an “up” conformation, and is oriented towards the DNA binding groove. In A3Bctd simulations, L3 displays a “down” conformation, with C239 and C247 interacting, pulling the loop down towards the allosteric pocket (Figure 6C). This “down” conformation of L3 in A3Bctd may stabilize the loop’s inherent flexibility, prevent L3 interactions with ssDNA, and act as a clamp, trapping the ligand in the allosteric pocket. In contrast, the analogous H56 in A3A on L3 does not interact with any residues in the allosteric pocket during our simulations, and instead interacts with ssDNA, which may help stabilize ssDNA in the A3A active site. This stark difference in L3 conformation between A3A and A3Bctd may help explain the difference in inhibitory action of compound 10 on A3A and A3Bctd.
Given the experimental and computational evidence that 10 is selective for A3Bctd over A3A, we also performed simulations with ssDNA in the active site and 10 bound to the allosteric site. In these simulations, 10 was less stable in the allosteric site in both A3A and A3Bctd systems. In A3A simulations, compound 10 was on average 16.2 +/− 4.6 Å from F54, and in A3Bctd simulations, compound 10 was on average 9.5 +/− 5.5 Å from F237. Kernel Density Estimation (KDE) further show that although 10 is on average farther from the A3Bctd allosteric site when ssDNA is bound, there is still a small maximum at approximately 5 Å, whereas there is no clear maximum in the A3A KDE when ssDNA is present (Figure 6A/B). Our simulations suggest that compared to A3A, 10 is more stable in the A3Bctd allosteric pocket when ssDNA is bound, which is supported by the selectivity for these allosteric compounds to inhibit A3Bctd but not A3A. Furthermore, the ssDNA stayed bound to the active site during the entirety of the simulations, which agrees with our FP assays reported above, as compound 10 was unable to displace ssDNA from the active site.
2.8. Development of cysteine reactive probe for binding site determination
Previous results suggested that many of these compounds were acting through an allosteric inhibition mechanism, as they did not block DNA binding to the active site, but still bound the protein as observed via NMR. The computational docking of 10 bound to A3Bctd suggested the compound in the putative allosteric would be positioned near two potentially solvent exposed cysteine residues, C239 and C247 (Figure 6C). To probe the binding mode of this compound, we modified the aryl amide region of 10 and appended a chloroacetamide moiety for cysteine reactivity, resulting in 24 (Scheme 2). Intact protein mass spectrometry was performed to ensure the covalent compound adducted to A3Bctd in a dose- and time-dependent manner (Figure 7A). 24 was incubated with A3Bctd for one and three hours at varying molar equivalents of compound over protein, and the degree of covalent adduction was quantified using the intensity of the adduct mass species. At one hour, a majority of the protein shows adduction of the covalent compound at or above 10x the protein concentration. Expectedly, we observe a higher degree of labeling at the longer incubation times as covalent adduction is a time-dependent event. Multiple adduction events are detected at the higher time and concentration points, implying some nonspecific reactivity towards cysteines. This reactivity could be due to the electrophilic warhead, as chloroacetamides are generally more cysteine reactive than other groups, like acrylamides.33 When the covalent warhead was converted to the acrylamide (25, SI 1.1.6) there were no multiple adduction events detected (Figure S104).
Scheme 2.

Synthesis of 24.
Figure 7.
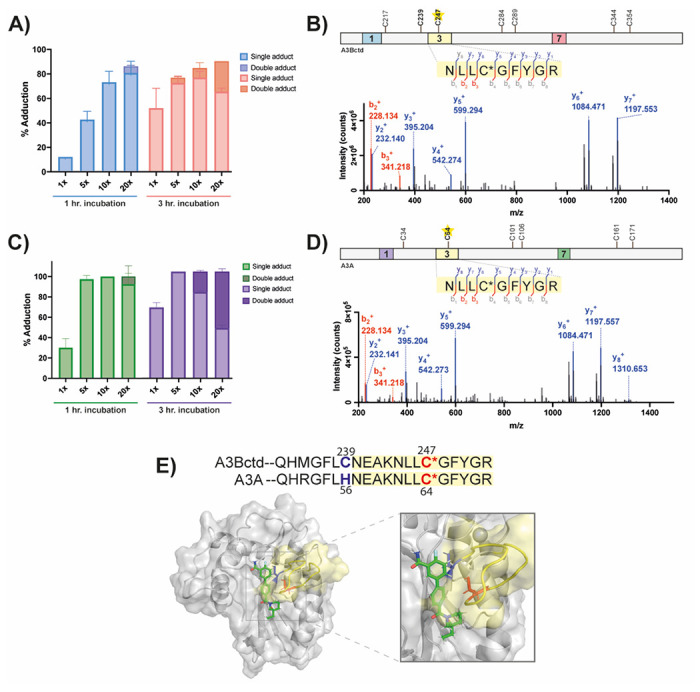
Development of a cysteine-reactive probe for mass spectrometry-based experiments. A, C) Percent adduction of 24 to A3Bctd (A) and A3A (C) using intact protein mass spectrometry, N = 2, error bars represent standard deviation. B/D) Collision-induced fragmentation pattern of peptides from A3Bctd (B) and A3A (D) treated 24. Precursor peptides encompass amino acids 244-252 (B) and 61-69 (D). The lines between the amino acids indicate observed b- and y-ions. Sequence of the protein is depicted above with DNA-engaging loops 1, 3, and 7 highlighted. Cysteines predicted to be adducted are bolded, while experimentally detected adduction site depicted with a star. E) Model of 10 docked against A3Bctd (structure based of PDB: 5TD5) with the adducted cysteine in red, and other solvent exposed cysteine in blue, while loop three is highlighted in yellow. Sequence similarity between A3A and A3Bctd depicted above.
To identify the specific site of adduction, the compound-adducted A3Bctd was digested with trypsin for bottom-up proteomic analysis, and 24 was found to covalently label C247 (Figure 7B). This cysteine is in the middle of L3, which suggests that compound binding to the allosteric pocket of A3Bctd interacts with that loop, confirming the computational modeling that suggests L3 provides stabilizing interactions to compound binding, and could potentially restrict the movement of L3 as a mechanism of inhibition.
Considering the demonstrated selectivity of these compounds for A3Bctd over A3A, A3A was subjected to the same intact protein and bottom-up mass spectrometry experiments as A3Bctd. 24 adducted to A3A in a similar manner as reported for A3Bctd, although with a higher percentage of second adduction events at the higher concentrations (Figure 7C). After tryptic digest, we identified 24 adducted to C64, the analogous cysteine in A3A as C247 in A3Bctd (Figure 7D). Although a similar binding mode was detected for A3A, our computational model predicts that the analogous allosteric pocket on A3A may be occluding the binding of the compound due to the bulky histidine unique to A3A. Thus, the compound is likely adducting to the most reactive solvent exposed cysteine in A3A, but not actively binding in the allosteric pocket to restrict L3 movement. These results are supported by CysDB, a recently reported database developed by the Backus lab that used chemoproteomics datasets to profile the reactivity and druggability of cysteines in the human proteome.34 CysDB reported that the only druggable cysteine in A3B is C247, the same residue adducted by 24, whereas no druggable cysteines were identified in A3A. These intact mass and tryptic digest mass spectrometry results support the computational model of these compounds binding to the allosteric site identified on A3Bctd and provide some rationale on the selectivity for A3Bctd over A3A.
3. Conclusions
In total, we screened over 100,000 compounds from the ChemBridge Diversity Set library through a virtual screening effort targeting the active site and a novel putative allosteric site. After ranking the compounds and selecting the top performing hits, 2133 compounds were screened through a biochemical activity assay and 14 initial hit compounds were identified. After additional SAR by catalog, 17 compounds were HPLC purified and retested, confirming 13 hits. These compounds were then tested for binding through multiple orthogonal assays, including fluorescence polarization and CPMG NMR. The compounds all bind to the protein, but do not displace DNA from the active site of the protein, indicating their mechanism of inhibition is not through competition with the ssDNA substrate. While the compounds bind to both A3Bctd and the related protein A3A, they are selective for A3Bctd inhibition despite the highly homologous nature of the two proteins. One of the original hit compounds was converted to a chloroacetamide probe, and through bottom-up proteomics we identified the compound adducts near the computationally-predicted allosteric pocket on A3Bctd and at the same cysteine in A3A. Computational experiments suggest this difference in inhibitory activity is likely because of the presence of a bulky histidine residue near the allosteric binding pocket in A3A, which does not exist in A3Bctd.
Supplementary Material
4. Acknowledgements
We would like to acknowledge and thank Peter Villalta and Yingchun Zhao of the University of Minnesota’s Analytical Biochemistry Shared Resource Center for their expertise in the mass spectrometry instrumentation used in this manuscript.
5. Funding
This work was supported by the National Institutes of Health, National Cancer Institute (P01-CA234228, to RSH, REA, DAH) and a Recruitment of Established Investigators Award from the Cancer Prevention and Research Institute of Texas (CPRIT RR220053, to RSH). KMFJ was funded by the National Science Foundation Gradate Research Fellowship Program (NSF GRFP). CKJM was supported by an NIH, NCI traineeship (T32-CA009523). RSH is an Investigator of the Howard Hughes Medical Institute and the Ewing Halsell President’s Council Distinguished Chair at University of Texas Health San Antonio.
6 References
- 1.Harris RS, Petersen-Mahrt SK, Neuberger MS. Mol. Cell 2002, 10, 1247. DOI: 10.1016/S1097-2765(02)00742-6 [DOI] [PubMed] [Google Scholar]
- 2.Haché G, Liddament MT, Harris RS. J. Biol. Chem. 2005, 280, 10920. DOI: 10.1074/jbc.M500382200 [DOI] [PubMed] [Google Scholar]
- 3.Conticello SG. Genome Biol. 2008, 9, 229. DOI: 10.1186/gb-2008-9-6-229 [DOI] [PMC free article] [PubMed] [Google Scholar]
- 4.Shi K, Carpenter MA, Banerjee S, Shaban NM, Kurahashi K, Salamango DJ, McCann JL, Starrett GJ, Duffy JV, Demir O, Amaro RE, Harki DA, Harris RS, Aihara H. Nat. Struct. Mol. Biol. 2017, 24, 131. DOI: 10.1038/nsmb.3344 [DOI] [PMC free article] [PubMed] [Google Scholar]
- 5.Beale RC, Petersen-Mahrt SK, Watt IN, Harris RS, Rada C, Neuberger MS. J. Mol. Biol. 2004, 337, 585. DOI: 10.1016/j.jmb.2004.01.046 [DOI] [PubMed] [Google Scholar]
- 6.Sheehy AM, Gaddis NC, Choi JD, Malim MH. Nature 2002, 418, 646. DOI: 10.1038/nature00939 [DOI] [PubMed] [Google Scholar]
- 7.Jakobsdottir GM, Brewer DS, Cooper C, Green C, Wedge DC. BMC Biol. 2022, 20, 117, DOI: 10.1186/s12915-022-01316-0 [DOI] [PMC free article] [PubMed] [Google Scholar]
- 8.Petljak M, Dananberg A, Chu K, Bergstrom EN, Striepen J, von Morgen P, Chen Y, Shah H, Sale JE, Alexandrov LB, Stratton MR, Maciejowski J. Nature 2022, 607, 799. DOI: 10.1038/s41586-022-04972-y [DOI] [PMC free article] [PubMed] [Google Scholar]
- 9.Alexandrov LB, et al. Nature 2020, 578, 94. DOI: 10.1038/s41586-020-1943-3 [DOI] [PMC free article] [PubMed] [Google Scholar]
- 10.Law E. K. et al. Sci. Adv. 2016, 2, e1601737. DOI: 10.1126/sciadv.1601737 [DOI] [PMC free article] [PubMed] [Google Scholar]
- 11.Law E. K. et al. J. Exp. Med. 2020, 217. DOI: 10.1084/jem.20200261 [DOI] [PMC free article] [PubMed] [Google Scholar]
- 12.Li M, Shandilya SM, Carpenter MA, Rathore A, Brown WL, Perkins AL, Harki DA, Solberg J, Hook DJ, Pandey KK. ACS Chem. Biol. 2012, 7, 506. DOI: 10.1021/cb200440y [DOI] [PMC free article] [PubMed] [Google Scholar]
- 13.Olson M. E. High-throughput Screening and Chemical Synthesis for the Discovery of APOBEC3 DNA Cytosine Deaminase Inhibitors, University of Minnesota Ph.D. Thesis, (2015). [Google Scholar]
- 14.Kvach MV, Barzak FM, Harjes S, Schares HAM, Jameson GB, Ayoub AM, Moorthy R, Aihara H, Harris RS, Filichev VV, Harki DA, Harjes E. Biochemistry 2019, 58, 391. DOI: 10.1021/acs.biochem.8b00858 [DOI] [PMC free article] [PubMed] [Google Scholar]
- 15.Kvach MV, Barzak FM, Harjes S, Schares HAM, Kurup HM, Jones KFM, Sutton L, Donahue J, D’Aquila RT, Jameson GB, Harki DA, Krause KL, Harjes E, Filichev VV. Chembiochem 2020, 21, 1028. DOI: 10.1002/cbic.201900505 [DOI] [PMC free article] [PubMed] [Google Scholar]
- 16.Harjes S, Kurup HM, Rieffer AE, Bayarjargal M, Filitcheva J, Su Y, Hale TK, Filichev VV, Harjes E, Harris RS, Jameson GB. Nature Comm. 2023, 14, 6382. DOI: 10.1038/s41467-023-42174-w [DOI] [PMC free article] [PubMed] [Google Scholar]
- 17.King JJ, Borzooee F, Im J, Asgharpour M, Ghorbani A, Diamond CP, Fifield H, Berghuis L, Larijani M. ACS Pharmacol. Transl. Sci. 2021, 4, 1390. DOI: 10.1021/acsptsci.1c00091 [DOI] [PMC free article] [PubMed] [Google Scholar]
- 18.Chen C. et al. J. Immunother. Cancer 2022, 10, e005503. DOI: 10.1136/jitc-2022-005503 [DOI] [PMC free article] [PubMed] [Google Scholar]
- 19.Grillo MJ, Jones KFM, Carpenter MA, Harris RS, Harki DA. Trends Pharmacol. Sci. 2022, 43, 362. DOI: 10.1016/j.tips.2022.02.007 [DOI] [PMC free article] [PubMed] [Google Scholar]
- 20.Shi K, Carpenter MA, Kurahashi K, Harris RS, Aihara H. J. Biol. Chem. 2015, 290, 28120. DOI: 10.1074/jbc.M115.679951 [DOI] [PMC free article] [PubMed] [Google Scholar]
- 21.Wagner JR, Demir O, Carpenter MA, Aihara H, Harki DA, Harris RS, Amaro RE. J. Chem. Inf. Model 2019, 59, 2264. DOI: 10.1021/acs.jcim.8b00427 [DOI] [PMC free article] [PubMed] [Google Scholar]
- 22.Wagner JR, Sorensen J, Hensley N, Wong C, Zhu C, Perison T, Amaro RE. J. Chem. Theory Comput. 2017, 13, 4584. DOI: 10.1021/acs.jctc.7b00500 [DOI] [PMC free article] [PubMed] [Google Scholar]
- 23.Kozakov D, Grove LE, Hall DR, Bohnuud T, Mottarella SE, Luo L, Xia B, Beglov D, Vajda S. Nat. Protoc. 2015, 10, 733. DOI: 10.1038/nprot.2015.043 [DOI] [PMC free article] [PubMed] [Google Scholar]
- 24.Votapka L, Amaro RE. Bioinformatics 2012, 29, 393. DOI: 10.1093/bioinformatics/bts689 [DOI] [PMC free article] [PubMed] [Google Scholar]
- 25.Friesner RA, Banks JL, Murphy RB, Halgren TA, Klicic JJ, Mainz DT, Repasky MP, Knoll EH, Shelley M, Perry JK, Shaw DE, Francis P, Shenkin PS. J. Med. Chem. 2004, 47, 1739. DOI: 10.1021/jm0306430 [DOI] [PubMed] [Google Scholar]
- 26.Friesner RA, Murphy RB, Repasky MP, Frye LL, Greenwood JR, Halgren TA, Sanschagrin PC, Mainz DT. J. Med. Chem. 2006, 49, 6177. DOI: 10.1021/jm051256o [DOI] [PubMed] [Google Scholar]
- 27.Halgren TA, Murphy RB, Friesner RA, Beard HS, Frye LL, Pollard WT, Banks JL. J. Med. Chem. 2004, 47, 1750. DOI: 10.1021/jm030644s [DOI] [PubMed] [Google Scholar]
- 28.Baell JB & Holloway GA. J. Med. Chem. 2010, 53, 2719. DOI: 10.1021/jm901137j [DOI] [PubMed] [Google Scholar]
- 29.Markossian S. et al. Assay Guidance Manual. Eli Lilly & Company and the National Center for Advancing Translational Sciences (2004). [PubMed] [Google Scholar]
- 30.Meiboom S & Gill D. Rev. Sci. Instrum. 1958, 29, 688. DOI: 10.1063/1.1716296 [DOI] [Google Scholar]
- 31.Hajduk PJ, Olejniczak ET, Fesik SW. J. Am. Chem. Soc. 1997, 119, 12257. DOI: 10.1021/ja9715962 [DOI] [Google Scholar]
- 32.Gossert AD & Jahnke W. Prog. Nucl. Magn. Reson. Spectrosc. 2016, 97, 82. DOI: 10.1016/j.pnmrs.2016.09.001 [DOI] [PubMed] [Google Scholar]
- 33.Kuljanin M. et al. Nat. Biotechnol. 2021, 39, 630. DOI: 10.1038/s41587-020-00778-3. [DOI] [PMC free article] [PubMed] [Google Scholar]
- 34.Boatner LM, Palafox MF, Schweppe DK, Backus KM. Cell Chem. Biol. 2023, 30, 683–698 e683, doi: 10.1016/j.chembiol.2023.04.004 [DOI] [PMC free article] [PubMed] [Google Scholar]
Associated Data
This section collects any data citations, data availability statements, or supplementary materials included in this article.


