Abstract
Increasing evidence shows that long non-coding RNAs (lncRNAs) play an important role in a variety of disorders including kidney diseases. It is well recognized that inflammation is the initial step of kidney injury and is largely mediated by nuclear factor Kappa B (NF-κB) signaling. We had previously identified lncRNA-Arid2-IR is an inflammatory lncRNA associated with NF-κB-mediated renal injury. In this study, we examined the regulatory mechanism through which Arid2-IR activates NF-κB signaling. We found that Arid2-IR was differentially expressed in response to various kidney injuries and was induced by transforming growth factor beta 1(TGF-β1). Using RNA sequencing and luciferase assays, we found that Arid2-IR regulated the activity of NF-κB signal via NLRC5-dependent mechanism. Arid2-IR masked the promoter motifs of NLRC5 to inhibit its transcription. In addition, during inflammatory response, Filamin A (Flna) was increased and functioned to trap Arid2-IR in cytoplasm, thereby preventing its nuclear translocation and inhibition of NLRC5 transcription. Thus, lncRNA Arid2-IR mediates NF-κB-driven renal inflammation via a NLRC5-dependent mechanism and targeting Arid2-IR may be a novel therapeutic strategy for inflammatory diseases in general.
Electronic supplementary material
The online version of this article (10.1007/s00018-020-03659-9) contains supplementary material, which is available to authorized users.
Keywords: Arid2-IR, NLRC5, Flna, NF-κB, Inflammation
Introduction
Inflammation plays a driving role in many renal diseases and is largely mediated by NF-κB signaling in response to the initial renal insults [1]. In cellular level, classical NF-κB activation is usually a rapid and transient response to stimuli. IKKs are recruited to activated receptor complexes whereby IKKβ is phosphorylated by either trans-autophosphorylation or TAK1 and MEKK3 [2, 3]. The activated IKK complex phosphorylates IκB, trigging it for polyubiquitination and proteasomal degradation, thus releasing p65/p50 and other dimers [4]. Although many inhibitors influence NF-κB activation and tend to reduce inflammation, there are no data regarding specific NF-κB inhibition in kidney.
LncRNAs (long non-coding RNAs) are commonly defined as long RNA transcripts longer than 200 nucleotides that do not encode proteins in most instances [5, 6]. LncRNAs are further classified as natural antisense transcripts, overlapping lncRNAs, long intergenic non-coding RNAs and intronic non-coding RNAs on the basis of their position on the genome [7]. It is now widely understood that lncRNAs are expressed in a cell type, tissue, developmental stage or disease state-specific manner. Evaluating lncRNAs could identify cellular pathologies, provide prognostic value, or even inform therapeutic options for patients [8]. Seminal studies showed that lncRNAs are involved in kidney development and dysregulated in the processes of kidney disease. LncRNA MALAT1 (metastasis-associated lung adenocarcinoma transcript 1) and TUG1 (taurine-up-regulated gene 1) were found dysregulated in patients with AKI (acute kidney injury) and in mouse models of DKD (diabetic kidney disease) [9–13]. LncRNA PVT1 (plasmacytoma variant translocation 1) is identified associated with ESRD (end-stage of renal disease) in type 1 and type 2 diabetes and may mediate the development and progression of diabetic nephropathy through mechanisms involving ECM (extra cellular matrix) accumulation [14, 15]. In our previous study, we identified 151 Smad3-dependent lncRNAs during renal injury in the mouse model of UUO (unilateral ureteral obstructive nephropathy) using high-throughput RNA sequencing. Real-time PCR confirms that lncRNAs np_5318, np_17856, np_28496 (also named as Arid2-IR) are up-regulated in wild type, but down-regulated in Smad3 knockout kidneys where progressive renal inflammation and fibrosis are abolished [16]. Arid2-IR is an inflammatory lncRNA that plays a role in renal inflammation as knocking down of Arid2-IR inhibits activation of NF-κB signaling and renal inflammation [17]. However, mechanisms whereby Arid2-IR regulates NF-κB signaling remain unknown, which was examined in the present study.
Results
Arid2-IR is induced by TGF-β1 and differentially expressed in different kidney diseases
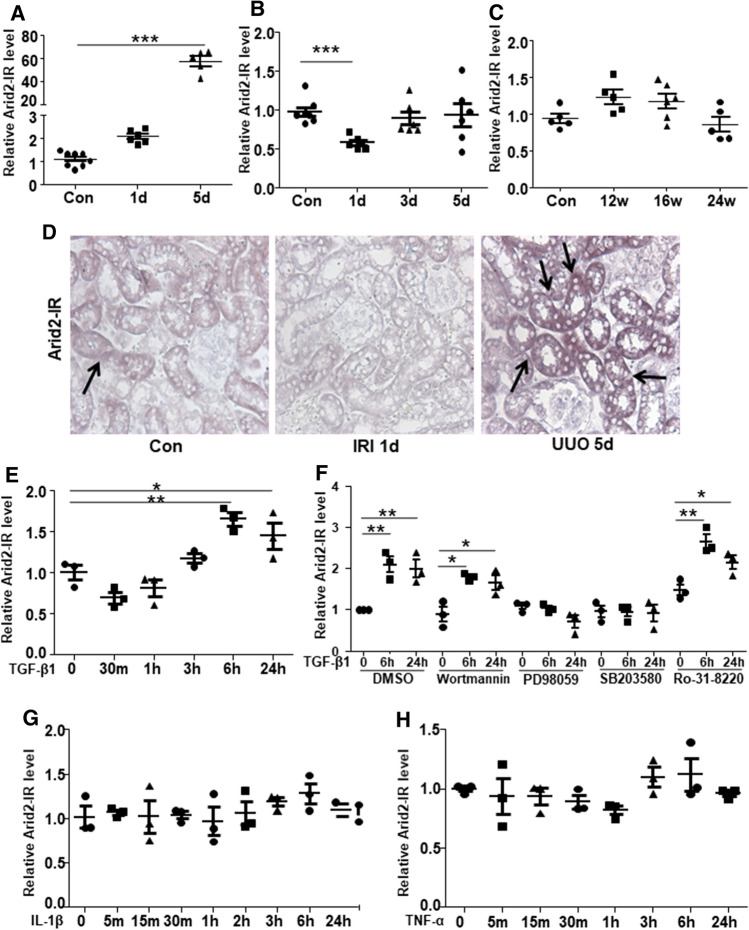
We first examined the specificity of Arid2-IR in renal inflammation in three different mouse models of kidney diseases including the UUO, ischemic reperfusion injury-induced acute kidney injury (IRI-AKI) and type 2 diabetes in db/db mice. UUO is a classical model with pathological features of progressive tubulointerstitial inflammation and fibrosis. IRI-AKI is a common AKI featuring extensive tubular epithelial necrosis. Whereas, diabetic kidney disease shows minor renal inflammation and fibrosis. Our previous study showed that Arid2-IR is the most up-regulated lncRNA in UUO kidney which was mainly expressed by renal tubular epithelial cells [16, 17]. In this study, quantitative real-time PCR showed that Arid2-IR expression did not change significantly at UUO day 1 but increased about 60-fold in UUO kidney at day 5 (Fig. 1a). On the contrary, Arid2-IR expression decreased by 50% on day 1 of IRI-AKI model, then gradually recovered from day 3 to day 5 (Fig. 1b). No significant changes of Arid2-IR were detected in kidneys of db/db mice at the age over 12–24 weeks (Fig. 1c). In situ result in Fig. 1d also shows that Arid2-IR is weakly expressed in tubulointerstitial region of normal mouse kidney, which is reduced in IRI 1d and largely up-regulated in the UUO kidney at day 5. These results indicated that Arid2-IR was exclusively and dramatically induced in UUO model day 5 with progressive renal inflammation and fibrosis but reduced in AKI with severe tubular necrosis and exhibited no alteration in db/db mice with minimal renal inflammation and fibrosis. We next dissect the regulatory mechanisms of differential Arid2-IR expression in vitro by stimulating mTECs (a major site of Arid2-IR expression) with various cytokines. As shown in Fig. 1e, Arid2-IR expression was significantly induced at 6 h, 24 h by TGF-β1. We, thus, blocked pathways by treating mTECs with various specific chemical inhibitors before TGF-β1 treatment. As shown in Fig. 1f, specific inhibitors for PI3K (wortmannin), PKC (Ro-31–8220) did not display obvious effect on TGF-β1-induced Arid2-IR level compare to DMSO. In contrast, inhibition of MEK (PD98059), p38 MAPK (SB203580) significantly inhibited TGF-β1-induced Arid2-IR level. The result indicated that TGF-β1 regulates Arid2-IR expression through the p38/MEK pathway. No significant changes were observed in mTECs treated with IL-1β or TNF-α from 0 to 24 h (Fig. 1g–h).
Fig. 1.
QPCR was used to detect the level of Arid2-IR in kidney disease models and mTECs. Relative expression level of Arid2-IR in the kidney tissues of a UUO, b IRI and c DKD models. Data are expressed as means ± SEM of 5–8 mice. ***p < 0.001 versus control mice. d In situ hybridization of Arid2-IR expression in mice kidney tissue of control, IRI 1d and UUO 5d. Positive signal (purple) for Arid2-IR is indicated by arrows. MTECs treated by TGF-β1 (10 ng/mL) e IL-1β (10 ng/mL) g and TNF-α (20 ng/mL) h for 24 h. f MTECs blocked with DMSO or specific inhibitors for PI3K (wortmannin), MEK (PD98059), p38 MAPK (SB203580), PKC (Ro-31–8220) before TGF-β1 treated for 0, 6 h, 24 h. Relative expression level of Arid2-IR was detected at different time points. *p < 0.05, **p < 0.01 versus 0 h. Data are expressed as means ± SEM of three independent experiments
Thus, Arid2-IR is induced by profibrotic TGF-β1 rather than proinflammatory cytokines but plays a role in renal inflammation as seen in the UUO kidney with severe renal fibrosis and inflammation. Whereas, severe TEC necrosis may result in a loss of Arid2-IR as seen in AKI because TECs are the major sites of Arid2-IR expression. In contrast, no alteration of Arid2-IR in the diabetic kidney may be associated with minimal renal inflammation and fibrosis.
Gene profiles of Arid2-IR downstream transcripts identified by RNA-seq
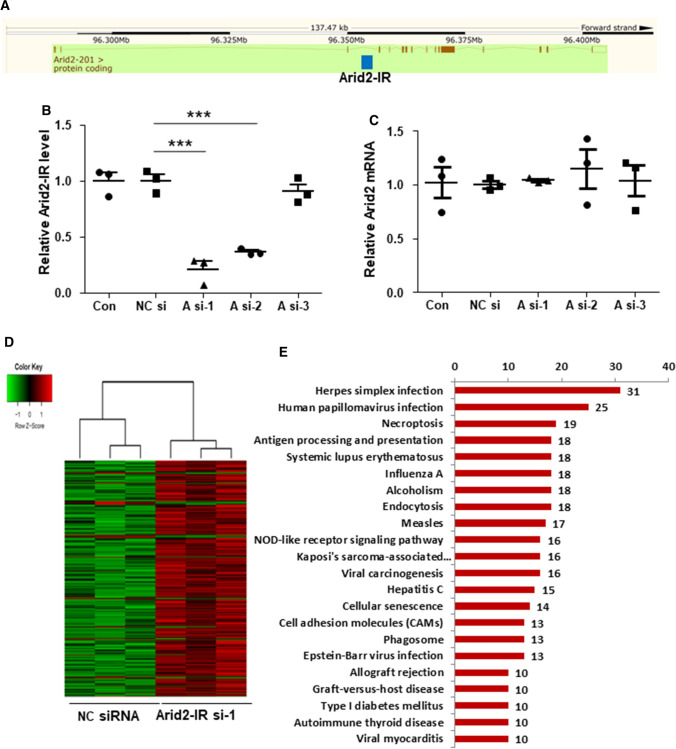
Some lncRNAs are physically linked to the locus from which they are transcripted; thus, they may regulate the transcription of their genomic neighborhood or host genes in cis [18]. As shown in Fig. 2a, Arid2-IR was located within the intron region between the fourth and fifth exons of Arid2 on the chromosome 15 of the mouse genome (mm10 Chr 15: 96,351,803–96,353,200). The full sequence of the lncRNA Arid2-IR was provided in Supplementary File 1. The qPCR manifested that siRNA-mediated effect on the expression of Arid2-IR, A si-1 decreased Arid2-IR level most significantly (Fig. 2b). Knockdown of Arid2-IR by siRNA transfection in mTECs significantly altered the expression of Arid2-IR, yet had no effect on the mRNA level of Arid2, suggesting that Arid2-IR does not regulate host gene transcription in cis (Fig. 2c).
Fig. 2.
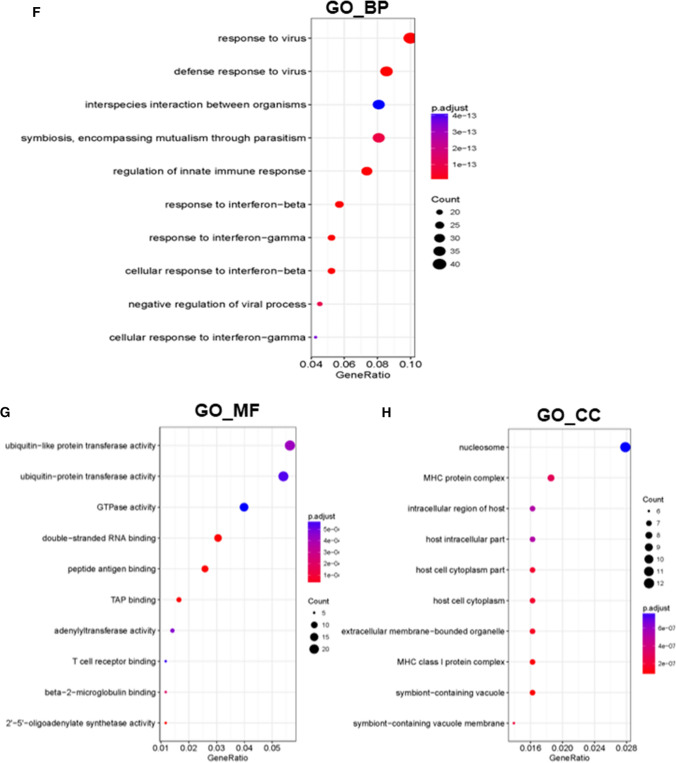
a Location of Arid2-IR in the mouse genome. Raw figure was downloaded from https://www.ensembl.org/ and modified. Blue box represents Arid2-IR. QPCR was used to detect relative level of Arid2-IR b and host gene Arid2 c in Arid2-IR siRNA-1, siRNA-2, siRNA-3 or NC siRNA-transfected mTECs. A si-1, 2, 3 were short for Arid2-IR siRNA-1, 2, 3. NC si was short for NC siRNA. d Heat map of expression profile of differentially expressed genes in Arid2-IR siRNA-1 and NC siRNA-transfected mTECs. e Significant KEGG pathways of differentially expressed genes in Arid2-IR siRNA-transfected group. Significant GO terms of biological process (f), molecular function (g), and cellular component (h) of differentially expressed genes in Arid2-IR siRNA-transfected group
To identify downstream genes regulated by Arid2-IR, high-throughput RNA sequencing was performed to profile DEGs (differentially expressed genes) in Arid2-IR-knockdown mTECs compared to negative control (NC) siRNA-transfected mTECs. As shown by heatmap of the clustered DEGs, knockdown of Arid2-IR promoted numerous gene expressions (Fig. 2d), indicating it might potentially function as a gene suppressor. All Arid2-IR-related DEGs are listed in Supplementary Table 1. To explore potential biological functions of Arid2-IR, these DEGs were subjected to KEGG pathway enrichment and GO annotation analysis. All the results of GO and KEGG analysis are listed in Supplementary Tables 2 and 3, respectively. The top significant KEGG pathways in which Arid2-IR-related DEGs enriched included herpes simplex infection, human papillomavirus infection, necroptosis, antigen processing and presentation (Fig. 2e). The most three significant GO terms of biological process (GO_BP) included response to virus, defense response to virus and symbiosis, encompassing mutualism through parasitism (Fig. 2f). For GO terms of molecular function (GO_MF) as shown in Fig. 2g, the most significant terms were ‘ubiquitin-like protein transferase activity, ubiquitin–protein transferase activity and GTPase activity’ in the Arid2-IR siRNA group compare to the NC group. The most significant GO term of cellular component (GO_CC) was ‘nucleosome’ in Arid2-IR-related DEGs (Fig. 2h). Consistent with our previous report [17], the results of KEGG and GO analysis also supported that Arid2-IR may play a role in inflammation.
NLRC5 is a downstream target gene of Arid2-IR and is negatively regulated by Arid2-IR transcriptionally
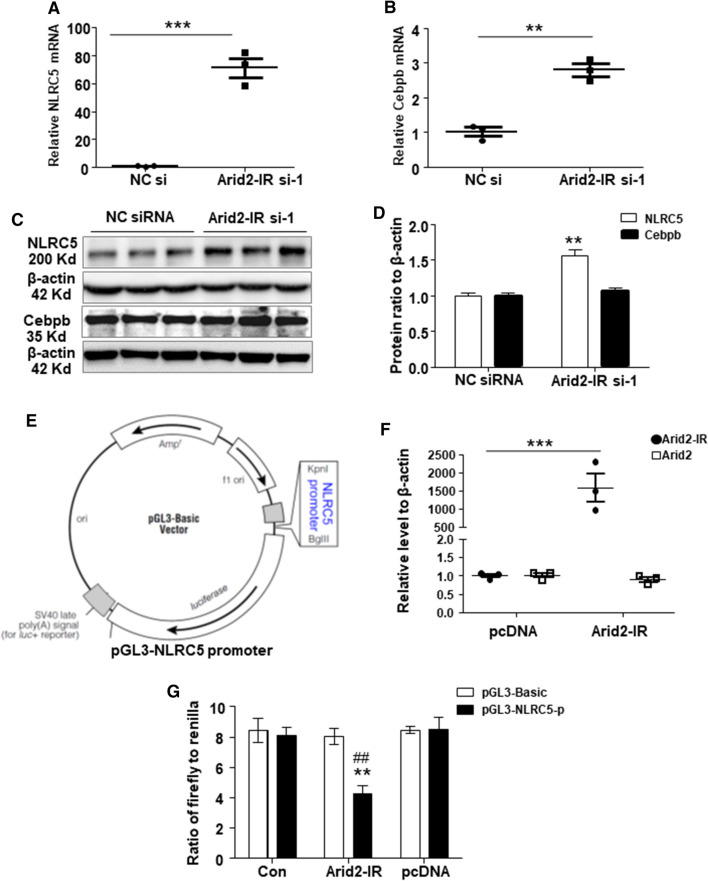
Among these dysregulated genes, Cebpb (CCAAT/enhancer-binding protein, beta), Tgtp1 (T cell specific GTPase 1), 1110008F13Rik (also known as RAB5 interacting factor), and NLRC5 (NLR family CARD domain containing 5) were the top four most significant DEGs (Supplementary Table 1). All these four genes were up-regulated in Arid2-IR knockdown mTECs compared to the NC control group. We then focused on Cebpb and NLRC5 which were regarded as important regulators in immune response based on literatures [19–23]. First, we validated the mRNA expression of NLRC5 and Cebpb in vitro by qPCR. Both genes, especially NLRC5, were remarkably up-regulated at the mRNA level in Arid2-IR knocking down mTECs, (Fig. 3a–b), suggesting that Arid2-IR may regulate NLRC5 and Cebpb transcriptionally. Knockdown of Arid2-IR also significantly increased the expression of NLRC5 protein, yet did not affect the protein level of Cebpb, (Fig. 3c–d), indicating Arid2-IR had a greater inhibitory effect on NLRC5 expression. As shown in Supplementary Fig. 1, qPCR result of 3 Arid2-IR siRNAs confirmed that Arid2-IR-siRNA-regulated NLRC5 level was not due to off-target effect. To further prove whether Arid2-IR regulates NLRC5 expression, we further constructed a pGL3-Basic vector containing the 2 kb length (mm10 chr8:94432391–94434390) of NLRC5 promoter region in the 5′ end of luciferase reporter gene (Fig. 3e). QPCR result showed that overexpression of pcDNA3.1-Arid2-IR vector increased Arid2-IR expression dramatically in 293 T cells (Fig. 3f), which resulted in significantly inhibition of the luciferase activity of pGL3-NLRC5 promoter when compared to pcDNA3.1 empty vector, demonstrating that Arid2-IR negatively regulates NLRC5 expression at the transcriptional level (Fig. 3g).
Fig. 3.
QPCR was used to detect the relative level of NLRC5 (a) and Cebpb (b) in Arid2-IR siRNA-1 or NC siRNA-transfected mTECs. c Protein level of NLRC5 and Cebpb in Arid2-IR siRNA-1 or NC siRNA-transfected mTECs analyzed by Western blot analysis. d Graphic presentation of relative abundance of NLRC5 and Cebpb normalized to β-actin in Arid2-IR siRNA-1 or NC siRNA-transfected mTECs. **p < 0.01, ***p < 0.001 versus NC siRNA. e Schematic representation of the luciferase reporter constructs. Two kilobase-length of NLRC5 promoter region inserted in the 5′end of luciferase reporter gene at KpnI/BglII site in pGL3-basic vector. (F) Relative level of Arid2-IR and Arid2 in Arid2-IR overexpression vector (Arid2-IR) or pcDNA3.1 empty vector (pcDNA) transfected 293 T cells was analyzed by qPCR. ***p < 0.001 Arid2-IR versus pcDNA group. g Dual luciferase assay was performed to detect the luciferase activity of pGL3-NLRC5-promoter compared to pcDNA3.1 empty vector in 293 T cells. pGL3-NLRC5-p: pGL3-NLRC5 promoter; pGL3-Basic: empty vector. Data were shown as the relative luciferase activity of firefly to renilla. **p < 0.01 versus pcDNA, ##p < 0.01 versus pGL3-Bacic. All data are mean ± SEM of at least three independent experiments
Arid2-IR binds directly to Flna, which is enhanced under inflammatory conditions
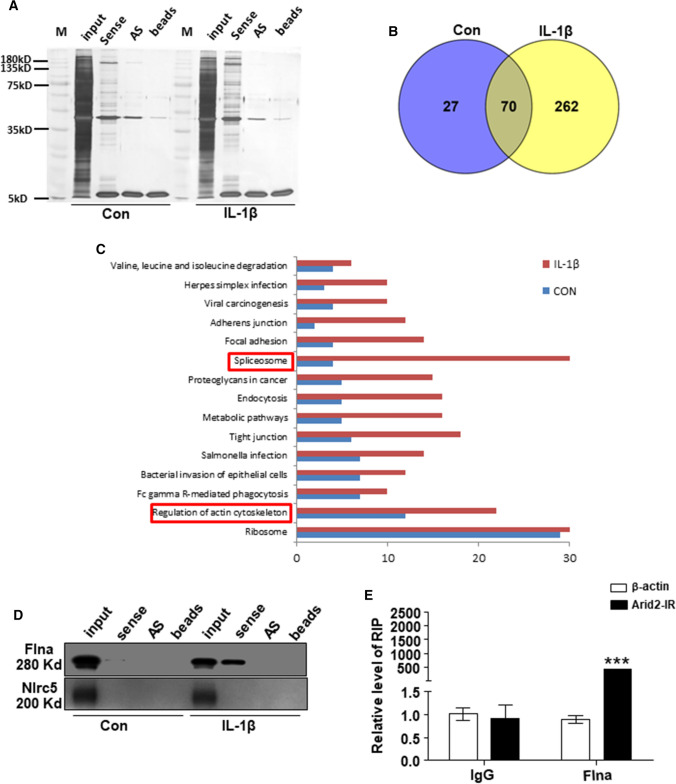
Since lncRNAs often exert their functions by interaction with one or more RNA-binding proteins [24], we performed RNA pull-down assays in mTECs treated with or without IL-1β and biotin-labeled Arid2-IR. The silver staining showed proteins bound to Arid2-IR sense and anti-sense (negative control) probes (Fig. 4a). Then, we identified total proteins that associated with Arid2-IR by mass spectrometry. As shown in Fig. 4b and Supplementary Table 4, there were 97 and 332 proteins or peptides in control or IL-1β-treated mTEC associated with Arid2-IR, respectively, with 70 of them overlapped in two groups. Apparently, IL-1β treatment increased the numbers of potential Arid2-IR-binding proteins. We then analyzed GO and KEGG catalogs of all the potential Arid2-IR-interacting proteins identified by mass spectrometry (supplementary Tables 5 and 6). As shown by KEGG analysis, except the most abundant ribosome protein in cell, the Arid2-IR-binding proteins especially clustered in ‘splicesome’ and ‘regulation of actin cytoskeleton’ after IL-1β treatment when compared to control group (Fig. 4c). Among these 70 overlapped proteins which may potentially bind to Arid2-IR, filamin A (Flna) is a cytoskeleton protein well known for its actin cross-linking function. It serves as a scaffold for large numbers of cellular proteins and involves in multiple cell functions, of which cell migration and adhesion is especially critical [25]. Most importantly, Flna is also dramatically increased in the UUO kidney as previously reported [26], which was also confirmed in IL-1β-treated mTECs by western blot after RNA pull-down (Fig. 4d), indicating upregulation of Flna protein and enhanced the interaction between Arid2-IR and Flna in response to IL-1β treatment. Enhanced binding of Arid2-IR to Flna in mTECs was further confirmed by RNA immunoprecipitation and qPCR, and immunoprecipitation with the Flna antibody (Fig. 4e).
Fig. 4.
RNA pull-down study was performed with mTECs cell lysates. a Silver staining of proteins bound to Arid2-IR sense or antisense biotin-labeled probe in control or IL-1β (10 ng/mL) treated mTECs at 30 min. AS antisense. b Venn diagrams demonstrate the number of Arid2-IR binding proteins detected by Mass spectrometry in both control or IL-1β treated mTECs. c KEGG analysis show that potential Arid2-IR binding proteins especially clustered in ‘splicesome’ and ‘regulation of actin cytoskeleton’ after IL-1β treatment when compared to control group. d Flna but not NLRC5 bound with Arid2-IR confirmed by Western blot after RNA pull-down. e Arid2-IR bound with Flna compare to IgG as shown by RNA immunoprecipitation followed by qPCR. Data were shown as the relative level of Arid2-IR to β-actin. All data are mean ± SEM of at least three independent experiments. ***p < 0.001 versus IgG
Relationship of Arid2-IR, NLRC5 and Flna expression in response to renal injury
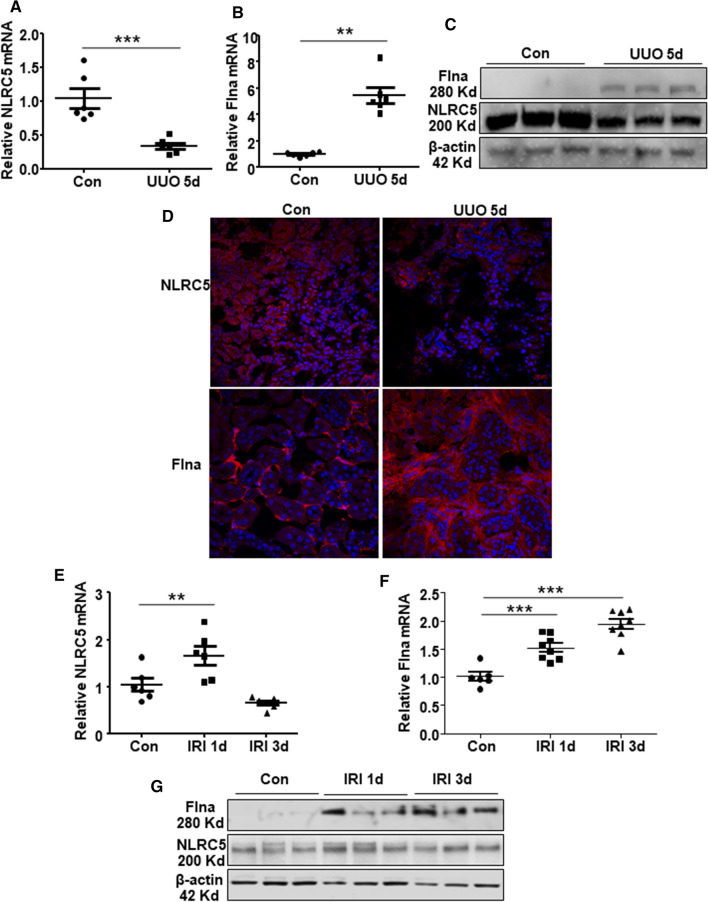
We then examined if increased Arid2-IR was associated with an increase in Flna expression but decrease in NLRC5 expression in the UUO kidney. As shown in Fig. 1a, Arid2-IR was markedly increased in the kidney of UUO day 5, which was associated with an increase in expression of Flna but decrease in NLRC5 at both mRNA (Fig. 5a–b) and protein levels (Fig. 5c–d and quantified in Supplementary Fig. 2a). In contrast, diseased Arid2-IR in the IRI-AKI kidney at day 1 (Fig. 1b) was associated with an increase in expression of NLRC5, although Flna was gradually increased in a time-dependent manner (Fig. 5e–g and quantified in Supplementary Fig. 2b). Immunocytochemistry also indicates that protein level of NLRC5 was induced in IRI 1d and markedly decreased in UUO kidney in renal tubular region compared to control (Supplementary Fig. 2c). These results revealed a negatively regulatory relationship between Arid2-IR and NLRC5 during the pathogenesis of renal inflammation, which was enhanced by Flna.
Fig. 5.
QPCR was used to detect the relative mRNA level of NLRC5 (a) and Flna (b) in the kidney tissue of UUO day5 compared to control group. (c)Western blot was used to analyze the protein level of NLRC5 and Flna in UUO models day5 compared to control group.(d) Immunofluorescence show the expression and location of NLRC5(red, upper panel) and Flna (red, lower panel)in control and UUO kidney day5. DAPI staining is blue. QPCR was used to detect the relative mRNA level of NLRC5 (e) and Flna (f) in IRI models at 1d and 3d compared to control group. (g)Western blot was used to analyze the protein level of NLRC5 and Flna in IRI models compared to control group. Data are expressed as means ± SEM of 5–8 mice. **p < 0.01, ***p < 0.001 versus control mice
The results of in vivo studies shown, unlike NLRC5 level was closely negative-related with Arid2-IR level, the expression of Flna did not relate with Arid2-IR, supporting that NLRC5 is a bona fide target gene of Arid2-IR.
Arid2-IR promotes NF-κB-driven renal inflammation by targeting NLRC5
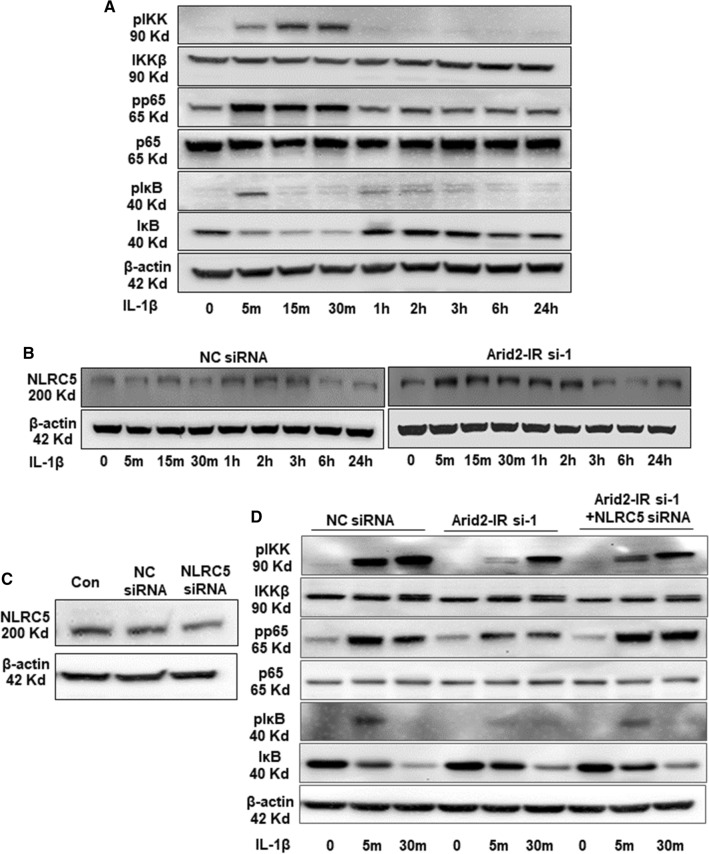
We previously showed that downregulation of Arid2-IR inhibits renal inflammation in UUO model and IL-1β-induced NF-κB activity in mTECs [17]. Here, we further investigated whether Arid2-IR activates NF-κB signaling by targeting NLRC5 in IL-1β-treated mTECs. Indeed, addition of IL-1β was able to induce activation of NF-κB signaling by phosphorylating IKKβ, NF-κB p65, and IκB (Fig. 6a and quantified in Supplementary Fig. 3a). To explore the regulatory mechanism Arid2-IR in activation of NF-κB signaling, we silenced Arid2-IR by siRNA and found that knockdown of Arid2-IR was able to inactivate NF-κB signaling, which was associated with enhanced expression of NLRC5 under high IL-1β conditions (Fig. 6b and quantified in Supplementary Fig. 3b). We next examined whether NLRC5 is essential for Arid2-IR-mediated NF-κB signaling by silencing the NLRC5 with siRNA on mTECs (Fig. 6c and quantified in Supplementary Fig. 3c). Strikingly, knockdown of NLRC5 rescued the Arid2-IR siRNA-induced inhibition of phosphorylation of IKK, NF-κB and IκB (Fig. 6d and quantified in Supplementary Fig. 3d), demonstrating that Arid2-IR may regulate the activity of IKK-NF-κB signal via a NLRC5-dependent mechanism.
Fig. 6.
a Western blot analysis was performed to exam the protein level of phosho-IKK, IKKβ, phosho-p65, p65, phosho-IκB, IκB, after IL-1β (10 ng/mL) treated mTECs at different time points. b The protein level of NLRC5 was detected at different time points in IL-1β (10 ng/mL) treated mTECs. MTECs were transfected with Arid2-IR or NC siRNA (200 nM) for 24 h before IL-1β treatment. c Western blot analysis was performed to detect the protein level of phosho-IKK, IKKβ, phosho-p65, p65, phosho-IκB, IκB, after IL-1β (10 ng/mL) treated mTECs at 0, 5 min, 30 min. d MTECs were transfected with Arid2-IR, NC siRNA, or Arid2-IR + NLRC5 siRNA (200 nM), respectively, for 24 h before IL-1β treatment. All data are representative of at least three independent experiments
Flna trapped Arid2-IR in the cytoplasm to inhibit its nuclear translocation.
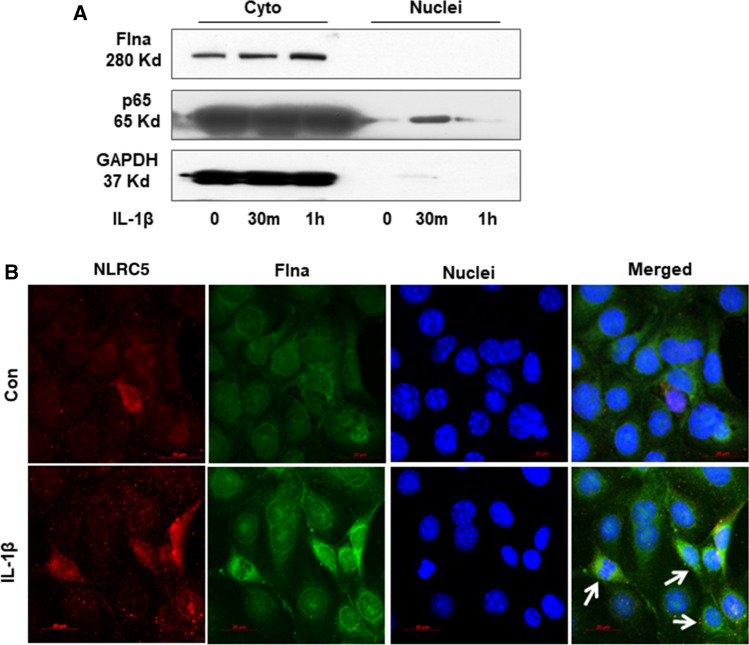
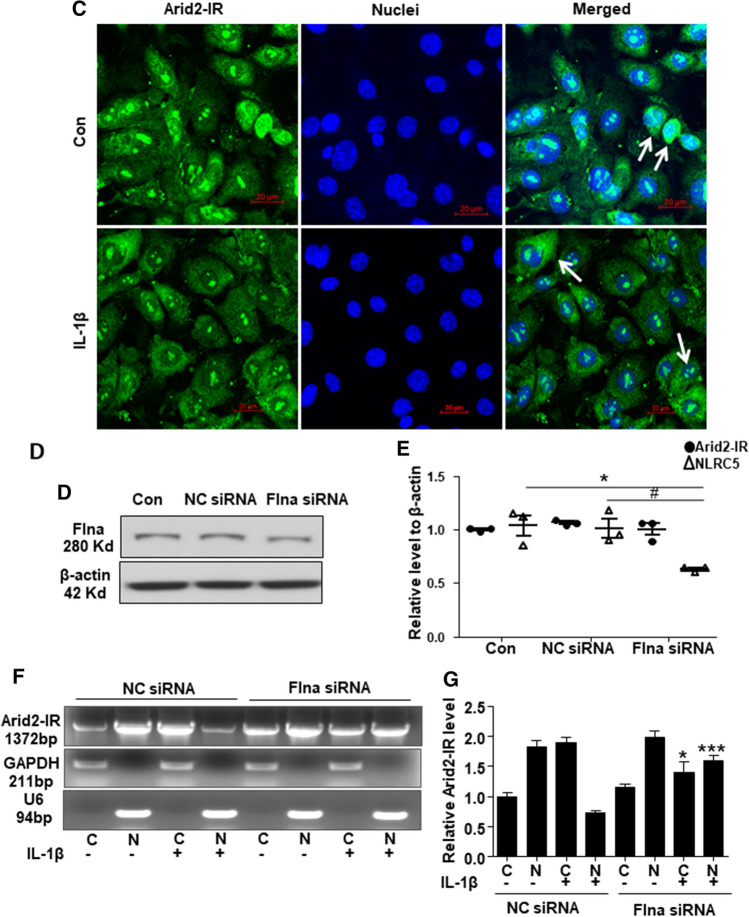
It is reported that Flna could translocate into nuclear to suppress gene transcription [27]. To further explore whether Flna could directly interact with Arid2-IR and negatively regulate NLRC5 transcription, as shown in Fig. 7a–b, Flna protein was only detectable in cytoplasm of mTECs and was significantly increased at 30 min after IL-1β stimulation. In contrast, fluorescence in situ hybridization (FISH) demonstrated that Arid2-IR was primarily localized in the nuclei of mTECs, which was recruited to the cytoplasm after IL-1β treated at 30 min (Fig. 7c). Interestingly, NLRC5 was expressed in both nuclear and cytoplasmic compartments and like Flna was increased in response to IL-1β (Fig. 7b). We, thus, hypothesized that Flna may anchor Arid2-IR in the cytoplasm, thereby preventing its nuclear translocation to promote NF-κB signaling via the NLRC5-dependent mechanism. We examined this hypothesis by silencing Flna in mTECs (Fig. 7d and quantified in Supplementary Fig. 4a) and found that knockdown of Flna by siRNA inhibited cytoplasmic Arid2-IR but promoting its nuclear translocation to transcriptionally inhibit NLRC5 expression (Fig. 7e–g). Furthermore, we also detected whether nuclear translocation of Arid2-IR correlates with apoptosis by flow cytometry, and found that knocking down of Arid-2 did not affect the apoptosis rate of mTEC (Supplementary Fig. 4b).
Fig. 7.
a Western bolt was performed to analyze the nuclei and cytoplasm protein in IL-1β (10 ng/mL) treated mTECs at 30 min and 1 h. b Immunofluorescence was performed to detect cellular location of Flna (green) and NLRC5 (red) in mTECs treated with IL-1β (10 ng/mL) for 30 min. White arrows indicated the mTECs that Flna protein was significantly increased in the cytoplasm after IL-1β treatment, which NLRC5 was also up-regulated. c Fluorescence in situ hybridization was performed to detect cellular location of Arid2-IR (green) in mTECs treated with IL-1β (10 ng/mL) for 30 min. White arrows indicated the mTECs which Arid2-IR was recruited to the cytoplasm after IL-1β treatment. d The protein level of Flna was detected in Flna or NC siRNA(200 nM) transfected mTECs by Western bolt. e QPCR presentation of relative level of Arid2-IR and NLRC5 normalized to β-actin in Flna or NC siRNA-transfected mTECs. All data are mean ± SEM of at least three independent experiments. *p < 0.05 versus control, #p < 0.05 versus NC siRNA. f Agarose gel electrophoresis of RT-PCR was used to detect Arid2-IR level in the nuclei and cytoplasm fraction of IL-1β (10 ng/mL) treated mTECs. MTECs were transfected with Flna or NC siRNA (200 nM) for 24 h before IL-1β treatment. C cytoplasm, N Nuclei. g Statistical analysis was used to represent Arid2-IR level in mTECs. *p < 0.05, ***p < 0.001 versus NC siRNA
Discussion
In this study, we identified that lncRNA-Arid2-IR was induced by TGF-β1 and differentially expressed in three different kidney disease models. Thus, increased Arid2-IR expression contributes significantly to progressive renal fibrosis and inflammation as seen in the UUO kidney. In contrast, in the AKI in which extensive renal tubular cell necrosis occurs, expression of Arid2-IR was largely reduced because TECs are the major sites of Arid2-IR-expressing cells. Interestingly, no significant alteration of Arid2-IR was noted in diabetic kidney of db/db mice where renal inflammation and fibrosis are minimal. Results from these studies demonstrated that expression of Arid2-IR is disease-specific.
The most significant finding from the present study is the identification of mechanism whereby Arid2-IR promotes NF-κB-mediated renal inflammation by targeting NLRC5. In this study, RNA sequencing and reporter assays found that NLRC5, a negative regulator of NF-κB, was as a downstream target gene of Arid2-IR and Arid2-IR negatively regulated NLRC5 to enhance activation of NF-κB signaling in vivo and in vitro. NLRC5 belongs to the highly conserved NOD-like protein family which expresses in various cell types and tissues [28]. Several studies have suggested that NLRC5 is an MHC class I gene transactivator [22, 29, 30]. In NLRC5‑deficient mice, constitutive expression of the classical murine MHC class I genes was substantially impaired in T cells, NK cells and NKT cells [30]. However, the functions of NLRC5 in regulating innate immunity and inflammation remain controversial. Cui et al. found NLRC5 as a negative regulator of NF-κB and type I interferon signaling pathways induced by TLR [31], whereas others do not detect any changes in NF-κB-related genes in bone marrow-derived macrophages isolated from NLRC5-deficient mice [32]. In the kidney, NLRC5 is highly expressed in diabetic kidney disease and IRI-induced AKI at 24 h and 48 h [33], NLRC5-deficient mice are protected against renal injury as evidenced by decreased serum creatinine levels, improved morphological injuries, and reduced inflammatory responses [33]. These results suggest that NLRC5 is protective in renal inflammation. Consistent with these studies, we found that NLRC5 was induced by inflammatory cytokine IL-1β in mTECs. Interestingly, NLRC5 was dramatically decreased in a mouse model of UUO, which was reversely correlated with expression of Arid2-IR. The regulatory role of Arid2-IR in NLRC5 expression during renal inflammation was revealed by RNA sequencing and reporter assay with the identification of NLRC5 as a target gene of Arid2-IR. The finding of knocking down NLRC5 to rescue the Arid2-IR siRNA-induced inactivation of NF-κB signaling revealed a protective role of NLRC5 in Arid2-IR-mediated NF-κB-driven renal inflammation.
In the present study, we also found that Flna directly interacted with Arid2-IR and prevented its nuclear translocation to negatively regulate NLRC5 transcriptionally. Flna is a well-known actin-binding protein that orchestrates the engineering of the actin cytoskeleton in response to signaling cascades to regulate cell shape and migration [25]. It also serves as a scaffold for over 90 binding partners and involves in multiple cell functions [34, 35]. Mutations in Flna are associated with a wide range of human genetic disorders, including skeletal, craniofacial, cardiovascular defects and cancers. Flna is also as a nucleolar protein that associates with the RNA polymerase I and RNA polymerase III-transcribed genes transcription [27, 36]. In the present study, we found that Flna was expressed in the cytoplasm and was induced by IL-1β to trap Arid2-IR to prevent its nuclear translocation to negatively regulate NLRC5, thereby inhibiting Arid2-IR-mediated NF-κB-driven renal inflammation.
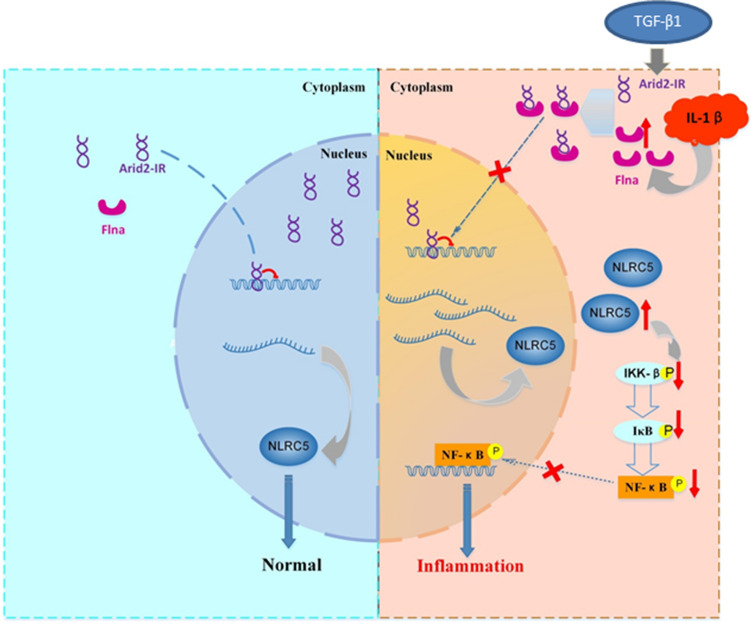
In summary, as shown in Fig. 8, under disease conditions, Arid2-IR is induced by profibrotic TGF-β1 but functions to promote renal inflammation by activating NF-κB signaling. Whereas Flna and NLRC5 are induced by inflammatory cytokines (such as IL-1β), but function to negatively regulate Arid2-IR-mediated renal inflammation. Indeed, under inflammation conditions, Flna traps Arid2-IR in cytoplasm to prevent its nuclear translocation to activate NF-κB-driven renal inflammation by targeting NLRC5. Thus, lncRNA Arid2-IR functions as a key regulator of NF-κB-dependent renal inflammation and may be a novel therapeutic target for inflammatory diseases in general.
Fig. 8.
The molecular mechanism of Arid2-IR in normal or inflammation. Under normal condition (left panel), Arid2-IR mainly locates in nuclei and negatively regulates the transcription of NLRC5. In renal injury(right panel), Arid2-IR is induced by TGF-β1, whereas elevated Flna induced by inflammatory cytokines (IL-1β) traps Arid2-IR in cytoplasm prevent its nuclear translocation and activate NF-B-driven renal inflammation by targeting NLRC5
Materials and methods
Animal models
Mouse model of UUO was induced in left kidney of male C57BL/6 J mice at 8 weeks of age (20–22 g body weight) as described earlier and left kidney tissues were harvested at day 5 [37]. IRI (ischemia reperfusion injury) model was induced in male C57BL/6 J mice at 8 weeks of age (20–22 g body weight) by bilaterally clamping their renal arteries with a vascular clip and then removed 40 min later to allow reperfusion as described earlier [38]. Mice were sacrificed and kidney tissues were collected 1d and 3d after IRI surgery under anaesthesia by intraperitoneal injection of pentobarbitone. C57BL background leptin receptor knock-out type 2 db/db mice (C57BL/KsJ) and db/m mice were purchased from Shanghai Model Organisms Center (Shanghai, China). DKD (db/db) or control (db/m) mice were sacrificed at age of 12 weeks, 16 weeks and 24 weeks under an aesthesia by intraperitoneal injection of pentobarbitone. Whole kidney was used for histological analysis, and cortex region of mice kidney tissue was mainly used in this study for qPCR and western blot analysis. The experimental procedures were approved by the Animal Experimentation Ethics Committee at The First Affiliated Hospital of Sun Yat-sen University.
Primary mouse tubular epithelial cells culture
Primary mouse tubular epithelial cells (mTEC) were isolated from the kidney of wild-type male C57BL/6 J mice. Cells were collected and cultured in DMEM/F12 media (Gibco, USA) with 1% Streptomycin/Penicillin (Gibco, USA), 10%FBS (Gibco, USA), ITS liquid media supplement (Sigma, USA), Murine EGF (10 ng/ml, Peprotech, USA) as previous describe. The primary mTECs were characterized as E-cadherin-positive and a-SMA-negative, as shown in Supplementary Fig. 5, the purity is over 95%. After 2nd passage, primary mouse tubular epithelial cells were seeded in 10-cm plate or 6-well plates for further experiments. 293 T cells were cultured in DMEM/F12 media (Gibco, USA) with 1% Streptomycin/Penicillin (Gibco, USA), 5%FBS (Gibco, USA). Cytokines, such as TGF-β1, IL-1β and TNF-α, used for in vitro study were all purchased from R&D systems (USA). Specific inhibitors for PI3K (wortmannin, CST-9951S), MEK (PD98059, CST-9900S), p38 MAPK (SB203580, CST-5633S), and PKC (Ro-31–8220, Calbiochem) were dissolved in DMSO (dimethyl sulfoxide). MTECs were treated with final concentration of wortmannin (1 μM), PD98059 (50 μM), p38 MAPK SB203580 (10 μM), Ro-31–8220 (5 μM), or equal volume of vehicle control (DMSO) for 2 h, followed by 0, 6 h and 24 h treatment of TGF-β1 (10 ng/ml).
Down-regulation and overexpression of Arid2-IR
For knocking down Arid2-IR, mTECs were transfected with 3 small interfering RNAs (siRNA) targeting Arid2-IR (A si-1, A si-2 and A si-3) or NC (scrambled negative control) siRNA at final concentration of 200 nM. For siRNA transient transfection, 60–80% confluent mTECs were transfected with siRNA using the RNA Max (Invitrogen, USA) according to the manufacturer’s instructions. For overexpression of Arid2-IR, the full length of Arid2-IR was inserted into pcDNA3.1 vector (Invitrogen, USA) at the NheI and EcoRI sites. To overexpress Arid2-IR, 80% confluent 293 T cells were transfected with 3 μg pcDNA3.1-Arid2-IR plasmids or pcDNA3.1 empty vector with Lipofectamine 3000 (Invitrogen, USA) according to the manufacturer’s instructions. SiRNA sequences (customized by Ribo Biological Technology, Guangzhou, China) and primers (customized by Sangon Biotech, Shanghai, China) used for vector construction are listed in Supplementary Table 7.
RNA sequencing
Primary TECs were collected 24 h post transfection with siRNA-targeting Arid2-IR (A si-1) and NC siRNA for RNA-Seq (n = 3 for each gorup) (Igenecode, Beijing). The RNA sequencing data were deposited in the National Center for Biotechnology Information database (accession number PRJNA668429).
Analysis of differentially expressed genes
The RPKM (Reads Per Kilobase per Million mapped reads) were used to quantifying the transcript expression. FastQC is used for quality control checks on raw sequence data. The DEGs (differentially expressed genes) were analyzed by DESeq2 for the identification of Arid2-IR-related genes. The genes with false discovery rate (FDR = adjusted p-values) < 0.05 were considered to indicate significant alteration. Pearson’s correlation coefficient based on transcript abundance (RPKM) was used to measure the gene expression similarity between samples (Supplementary Fig. 6).
GO and pathway analysis
The significant pathways and functional information that DEGs enriched were analyzed by GO (gene ontology) and KEGG (Kyoto Encyclopedia of Genes and Genomes). GO analyses of DEGs were performed on DAVID, DEGs were clustered in biological process (BP), molecular function (MF), and cellular component (CC), and the significantly enriched GO terms were considered as FDR < 0.05. Pathways of Arid2-IR-associated DEGs in renal injury were analyzed by KEGG, FDR < 0.05 was considered as significance.
Reverse transcription and quantitative real-time PCR
To quantify the expression level of lncRNA or mRNA in cultured cells (n = 3 for each group) or kidney tissues (n = 5–8 for each group), qPCR (quantitative real-time PCR) was performed with TB green Premix Ex Taq II kit (Takara, Japan). Total RNA (1 μg) was reverse-transcribed into first-strand cDNA using genomic DNA eraser PrimeScript RT reagent Kit (Takara, Japan). QPCR was conducted using the condition of 95 ℃ for 1 min, then 40 cycles of 95 ℃ for 15 s, 58 ℃ for 15 s and 72 ℃ for 30 s on ABI7900 (Applied Biosystems, USA). Sequences of the primers are listed in Supplementary Table 7. The relative levels of target genes were calculated using the 2−△△CT method, and the data were normalized by β-actin and expressed as the mean ± SEM [39].
Western blot analysis
Protein from kidney tissues and cultured cells was extracted using the protein lysis buffer with protease inhibitor, and western blot was performed as previously described. In brief, after blocking non-specific binding with 5% skim milk in TBST, membranes were then incubated overnight at 4 ℃ with the primary antibody against NLRC5 (Abcam, ab105411), Cebpb (CST, 3087), Flna (Millipore, CBL228), pIKK (phosphor-IKK, CST, 2697S), IKKβ (CST, 8943S), pp65 (phosphor-p65, CST, 3033S), p65 (CST, 4764S), pIκB (CST, 9246S), IκB (CST, 4814S), β-actin (CST, 3700) followed by horseradish peroxidase-conjugated secondary antibody for 1 h at room temperature and detected by chemiluminescent reagent (SuperSignal West Pico Plus, ThermoFisher). Quantification of the protein level was performed by measuring the intensity of the hybridization signals using the Fluorchem Image analysis program. The ratio for the protein examined was normalized against β-actin and expressed as the mean ± SEM.
Nuclear and cytoplasmic RNA and protein extraction
To determine the location of Arid2-IR and Flna expression, the nuclear and cytoplasmic fractions of cultured cells were isolated with PARIS Kit (Invitrogen, USA) according to the manufacturer’s instructions. QPCR and western blot were conducted in nuclear and cytoplasmic fraction separately. Arid2-IR level was normalized by GAPDH (cytoplasm) and U6 (nuclear) expressed as the mean ± SEM. PCR primers for U6 are purchased from Ruibo Biological Technology.
Luciferase reporter construction and Dual luciferase assay
To construct the luciferase reporter vector containing NLRC5 promoter, 2 kb length of NLRC5 promoter region was cloned into pGL3-Basic vector (Promega, USA) at KpnI/BglII sites (primers listed in Supplementary Table 7). The sequence of reporter vector containing NLRC5 promoter was confirmed by DNA sequencing (Supplementary File 2). 293 T Cells were cultured in 24-well plates for 24 h at 80% confluent, and then reporter vectors were co-transfected with Arid2-IR-overexpression vector (pcDNA3.1-Arid2-IR) or empty vector (pcDNA3.1) at final amount of 0.5 μg. Renilla luciferase reporter plasmid pRL-TK (Promega, USA) was co-transfected as transfection efficiency control, and cells were collected by lysis buffer supplied in dual luciferase reporter assay kit (Promega, USA) 24 h after transfection. The luciferase activity was measured by dual luciferase reporter assay kit according to the manufacturer’s instructions on Spectra Max L (Molecular Devices, USA). The data are given as mean ± SEM and shown as the ratio of firefly to renilla luciferase activity.
Immunofluorescence and immunocytochemistry staining
Primary mTECs were cultured on 10-mm coverslips (EM Science, NJ, USA) and fixed in PBS (phosphate-buffered saline) containing 4% paraformaldehyde 15 min at room temperature and permeated in 0.5% Triton X-100 for 5 min. After washing with PBS, cells were blocked in solution with PBS containing 5% BSA and 10% goat serum for 30 min at room temperature. Cells were incubated overnight at 4 ℃ with the primary antibodies anti-NLRC5 (Abcam, ab105411), Flna(Millipore, CBL228) diluted in blocking solution at 1:100, and then incubated with Alexa-546 goat anti-rabbit antibody or Alexa-488 goat anti-mouse antibody (Invitrogen, USA), respectively, for 1 h at room temperature. DAPI was subsequently used for nuclei staining for 5 min and samples were mounted in mounting medium (R&D Systems, USA). For mouse kidney, 10-μm OCT-embedded sections were fixed in 4% paraformaldehyde in PBS for 20 min. After three times of wash in PBS, tissue sections were treated with 0.5% Triton X-100 solution for 10 min, and blocked in solution with PBS containing 5% BSA and 10% goat serum for 30 min at room temperature. The sections were incubated overnight at 4 ℃ with primary antibodies against Flna, NLRC5, and then incubated with Alexa-546 goat anti-mouse or anti-rabbit antibody (Invitrogen, USA) for 1 h at room temperature. Images were analyzed and collected with 160 Zeiss LSM 810 Confocal Imaging System (Zeiss, Jena, Germany). Paraformaldehyde-fixed paraffin-embedded kidney tissues were used for immunocytochemistry staining of NLRC5 following the protocol described before [17].
In situ hybridization and RNA fluorescence in situ hybridization
To detect the expression pattern and location of Arid2-IR in kidney, in situ hybridization was performed in paraformaldehyde-fixed paraffin-embedded tissue with Digoxigenin-labeled probes (shown in Supplementary Table 7) at final concentration at 20 μM, following the instructions of ISH Detection Kit (Boster, China).
To detect the expression and cellular location of Arid2-IR in the primary mTEC, fluorescence in situ hybridization was performed. Antisense and sense (negative control) probes were synthesised with T7 RNA polymerase and labeling with Alex-488 using FISH Tag™ RNA Kit (Invitrogen, USA) according to the manual instruction. Primers used for probe synthesis are listed in Supplementary Table 7. RNA fluorescence in situ hybridization was performed according to the protocol [40]. Briefly, primary mTECs were cultured on 10-mm coverslip (EM science, NJ, USA) 24 h at 80% confluent, and then were treated or untreated with IL-1β for 30 min. First, cells were fixed in PBS containing 4% paraformaldehyde for 15 min at room temperature and permeate with 0.5% Triton X-100 for 5 min, then rinsed in PBS thrice for 10 min each and then in 2 × SSC (Saline Sodium Citrate) buffer once for 10 min. Second, cells were incubated in hybridization solution (Qiagen, Germany) at 37 ℃ for 30 min. At the same time, the probes were denatured by heating at 90 ℃ for 5–10 min and immediately chilled on ice. Then, cells were incubated with 100 μL of hybridization solution with probe (20 nM) at 42 ℃ in dark for 12–16 h. Coverslips with cells were washed thrice in freshly made 50% formamide with 2 × SSC for 5 min, thrice in 2 × SSC, 1 × SSC for 5 min at 37 ℃, and then twice in 4 × SSC for 10 min at room temperature. Lastly, cells were stained with DAPI prepared in 4 × SSC, and washed in 4 × SSC for 5–10 min before mounting. Images were analyzed and collected with 160 Zeiss LSM 810 Confocal Imaging System (Zeiss, Jena, Germany).
RNA pull-down and mass spectrometry
Arid2-IR antisense (negative control) and sense probes were transcribed with T7 RNA polymerase (Roche, Switzerland), and labeled with biotin using Biotin RNA labeling Mix Kit (Roche, Switzerland) according to the manufacturer’s instructions. RNA (5 μg) was mixed with cell lysates (5 mg) in 500 μl IP lysis buffer with RNase Inhibitor and incubated at room temperature for 1 h. Streptavidin magnetic beads (50 μl) (Invitrogen, USA) were added to each sample and incubated for 1 h. The retrieved proteins were separated and detected by western blot. Silver staining was conducted according to the manufacturer’s protocols with a silver staining kit (Beyotime Biotechnology, Shanghai). Mass spectrometry was performed to identify the proteins or peptides interacting with Arid2-IR followed by RNA pull-down.
RNA immunoprecipitation
RNA immunoprecipitation (RIP) was performed using Magna RIP RNA-Binding Protein Immunoprecipitation Kit (Millipore, USA) according to manufacturer’s instructions. Briefly, primary mTECs were cultured in 10-cm plate for 24 h and then treated with IL-1β (10 ng/mL) for 30 min. For one RIP reaction, 100 μL of cell lysate from 2.0 × 10⁷ cells was collected. 5 μg anti-Flna (Millipore, USA) or IgG antibodies were incubated with cell lysate in 1.5 mL tubes with rotating for overnight at 4 ℃. RNA was retrieved and purified for qPCR as described before. Primers for Arid2-IR and β-actin used for qPCR are listed in Supplementary Table 7.
Flow cytometry
Mouse tubular epithelial cells were cultured in 6-well plate for 24 h and then transfected with Arid2-IR siRNA-1 or NC siRNA at final concentration of 200 nM. After 24 h transfection, cells were treated with IL-1β (10 ng/mL) for 0 h, 0.5 h or 6 h. Then, mTECs were stained using an Annexin V fluorescein isothiocyanate (FITC) apoptosis detection kit (BD, USA) according to the manufacturer’s instructions. The proportions of apoptotic cells were determined using flow cytometer (BD, USA). The apoptotic cells could be distinguished as the stained cells with Annexin V (+)/Propidium Iodide (−).
Statistical analysis
Data obtained from this study were expressed as means ± SEM, and the statistical significance was analyzed using unpaired t test or one-way analysis of variance followed by Newman–Keuls for multiple comparisons from GraphPad Prism 5.0. Differences were considered statistically significant at p < 0.05.
Electronic supplementary material
Below is the link to the electronic supplementary material.
Supplementary Table 1. All Arid2-IR-related DEGs identified by RNA-seq (XLSX 36 kb)
Supplementary Table 2. GO analysis of all significant Arid2-IR-related DEGs (FDR<0.05) (XLSX 27 kb)
Supplementary Table 3. KEGG analysis of all Arid2-IR-related DEGs (FDR<0.05) (XLSX 11 kb)
Supplementary Table 4. Arid2-IR associated proteins or peptides identified by mass spectrometry in mTECs untreated or treated by IL-1β (10 ng/mL) for 30min (XLSX 30 kb)
Supplementary Table 5. Top ten significant GO catalogs of potential Arid2-IR interacting proteins identified by mass spectrometry (XLSX 17 kb)
Supplementary Table 6. Top fifteen significant KEGG pathways of potential Arid2-IR interacting proteins identified by mass spectrometry (XLSX 14 kb)
Supplementary Table 7. All the primers, probes and siRNA sequences used in this study (XLSX 11 kb)
Supplementary File 1. Sequences of Arid2-IR full length (DOCX 13 kb)
Supplementary File 2a. DNA sequencing results of pGL3-NLRC5-promoter. The inserted nucleotides were sequenced by RV3 primers. (AB1 271 kb)
Supplementary File 2b. DNA sequencing results of pGL3-NLRC5-promoter. The inserted nucleotides were sequenced by GLp2 primers (AB1 269 kb)
Supplementary Figure 1. QPCR was used to detect relative level of NLRC5 in Arid2-IR siRNA-1, siRNA-2, siRNA-3 or NC siRNA transfected mTECs. ***p < 0.001 versus NC siRNA, ##p < 0.01 Arid2-IR siRNA-1versus Arid2-IR siRNA-2.A si-1, 2, 3 were short for Arid2-IR siRNA-1, 2, 3 (PNG 7 kb)
Supplementary Figure 2. Statistical of Flna and NLRC5 protein level in UUO(A) and IRI(B) kidney respectively. * p < 0.05 versus control mice (PNG 344 kb)
Supplementary Figure 3. (A) Statistical of the protein level of phosho-IKK, IKKβ, phosho-p65, p65, phosho-IκB, IκB in IL-1β (10 ng/mL) treated mTECs at different time points. *p < 0.05, ***p < 0.001 versus 0h. (B)Statistical of NLRC5 protein level in NC or Arid2-IR siRNA-1 transfected mTECs. MTECs were then treated by IL-1β (10 ng/mL) at different time points. *p < 0.05, **p < 0.01, ***p < 0.001 versus 0h. (C) Statistical of NLRC5 protein level in NLRC5 or NC siRNA transfected mTECs. **p < 0.01 versus con; ###p < 0.001 versus NC. (D) Statistical of the protein level of phosho-IKK, IKKβ, phosho-p65, p65, phosho-IκB, IκB in IL-1β (10 ng/mL) treated mTECs at 0, 5m, 30m. **p < 0.01, ***p < 0.001 versus 0h; ##p < 0.01, ###p < 0.001 versus NC siRNA at same time point; &&p < 0.01, &&&p < 0.001 versus Arid2-IR siRNA-1 at same time point (PDF 160 kb)
Supplementary Figure 4. (A)Statistical of Flna protein level in NC or Flna siRNA treated mTECs. **p < 0.01 versus con; ##p < 0.01 versus NC. (B)The apoptosis rate of mTECs had no significantly change after transfecting with transfected with Arid2-IR siRNA-1 or NC siRNA (n = 3 for each group) (PNG 39 kb)
Supplementary Figure 5. Immunofluorescence of E-cadherin (green, left panel) and a-SMA (green, right panel) of mTECs, Over 95% cells were E-cadherin positive and a-SMA negative. DAPI staining is blue. Magnification: ×200 (PNG 379 kb)
Supplementary Figure 6. Pearson’ s correlation analysis was performed base on transcript abundance (RPKM) of the gene in Arid2-IR siRNA-1 (n=3) and NC (n=3) siRNA transfected groups (PNG 133 kb)
Acknowledgements
This study was supported by the following Grants: Guangzhou Science, Technology and Innovation Commission (201806010123), Guangdong Basic and Applied Basic Research Foundation(2020A1515010247), Kelin Young Talents Program of the First Affiliated Hospital of Sun Yat-sen University (Y50179) National Key R&D Program of China (2016YFC0906101), Operational Grant of Guangdong Provincial Key Laboratory(2017B030314019), Guangdong Provincial Programme of Science and Technology(2017A050503003), Guangdong Provincial Programme of Science and Technology(2017B020227006), Guangzhou Municipal Programme of Science and Technology(201704020167), The Research Grants Council of Hong Kong (14163317, 14117418, 14104019, R4012-18F, and C7018-16G). The Health and Medical Research Fund of Hong Kong (HMRF 05161326, 14152321); The Guangdong-Hong Kong-Macao-Joint Labs Program from Guangdong Science and Technology Department (2019B121205005).
Abbreviations
- UUO
Unilateral ureteral obstruction
- mTEC
Primary mouse tubular epithelial cells
- DKD
Diabetic kidney disease
- IRI
Ischemia Reperfusion Injury
- SSC
Saline Sodium Citrate
- PBS
Phosphate-buffered saline
- Flna
Filamin A
- NLRC5
NLR family CARD domain containing 5
- qPCR
Quantitative real-time PCR
- RIP
RNA immunoprecipitation
- DEGs
Differentially expressed genes
Author contributions
HL and QZ designed the study and revised the manuscript. PZ and CY performed the experiments and wrote the manuscript. JY collected data and did the statistical analysis. ZL prepared figures. All authors have read and approved the final submitted manuscript.
Compliance with ethical standards
Conflict of interest
All the authors declare that they have no conflicts of interest.
Footnotes
Publisher's Note
Springer Nature remains neutral with regard to jurisdictional claims in published maps and institutional affiliations.
Puhua Zhang, Chaolun Yu, and Jianwen Yu contributed equally to this work.
References
- 1.Courtois G, Gilmore TD. Mutations in the NF-kappaB signaling pathway: implications for human disease. Oncogene. 2006;25:6831–6843. doi: 10.1038/sj.onc.1209939. [DOI] [PubMed] [Google Scholar]
- 2.Karin M, Ben-Neriah Y. Phosphorylation meets ubiquitination: the control of NF-[kappa]B activity. Annu Rev Immunol. 2000;18:621–663. doi: 10.1146/annurev.immunol.18.1.621. [DOI] [PubMed] [Google Scholar]
- 3.Yang J, Lin Y, Guo Z, Cheng J, Huang J, Deng L, Liao W, Chen Z, Liu Z, Su B. The essential role of MEKK3 in TNF-induced NF-kappaB activation. Nat Immunol. 2001;2:620–624. doi: 10.1038/89769. [DOI] [PubMed] [Google Scholar]
- 4.Annemann M, Plaza-Sirvent C, Schuster M, Katsoulis-Dimitriou K, Kliche S, Schraven B, Schmitz I. Atypical IkappaB proteins in immune cell differentiation and function. Immunol Lett. 2016;171:26–35. doi: 10.1016/j.imlet.2016.01.006. [DOI] [PubMed] [Google Scholar]
- 5.Rinn JL, Chang HY. Genome regulation by long noncoding RNAs. Annu Rev Biochem. 2012;81:145–166. doi: 10.1146/annurev-biochem-051410-092902. [DOI] [PMC free article] [PubMed] [Google Scholar]
- 6.Banfai B, Jia H, Khatun J, Wood E, Risk B, Gundling WE, Jr, Kundaje A, Gunawardena HP, Yu Y, Xie L, et al. Long noncoding RNAs are rarely translated in two human cell lines. Genome Res. 2012;22:1646–1657. doi: 10.1101/gr.134767.111. [DOI] [PMC free article] [PubMed] [Google Scholar]
- 7.Ulitsky I, Bartel DP. lincRNAs: genomics, evolution, and mechanisms. Cell. 2013;154:26–46. doi: 10.1016/j.cell.2013.06.020. [DOI] [PMC free article] [PubMed] [Google Scholar]
- 8.Schmitt AM, Chang HY. Long noncoding RNAs in cancer pathways. Cancer Cell. 2016;29:452–463. doi: 10.1016/j.ccell.2016.03.010. [DOI] [PMC free article] [PubMed] [Google Scholar]
- 9.Kolling M, Genschel C, Kaucsar T, Hubner A, Rong S, Schmitt R, Sorensen-Zender I, Haddad G, Kistler A, Seeger H, et al. Hypoxia-induced long non-coding RNA Malat1 is dispensable for renal ischemia/reperfusion-injury. Scientific reports. 2018;8:3438. doi: 10.1038/s41598-018-21720-3. [DOI] [PMC free article] [PubMed] [Google Scholar]
- 10.Liu X, Hong C, Wu S, Song S, Yang Z, Cao L, Song T, Yang Y. Downregulation of lncRNA TUG1 contributes to the development of sepsis-associated acute kidney injury via regulating miR-142–3p/sirtuin 1 axis and modulating NF-kappaB pathway. J Cell Biochem. 2019;120(7):11331–11341. doi: 10.1002/jcb.28409. [DOI] [PubMed] [Google Scholar]
- 11.Hu M, Wang R, Li X, Fan M, Lin J, Zhen J, Chen L, Lv Z. LncRNA MALAT1 is dysregulated in diabetic nephropathy and involved in high glucose-induced podocyte injury via its interplay with beta-catenin. J Cell Mol Med. 2017;21:2732–2747. doi: 10.1111/jcmm.13189. [DOI] [PMC free article] [PubMed] [Google Scholar]
- 12.Li X, Zeng L, Cao C, Lu C, Lian W, Han J, Zhang X, Zhang J, Tang T, Li M. Long noncoding RNA MALAT1 regulates renal tubular epithelial pyroptosis by modulated miR-23c targeting of ELAVL1 in diabetic nephropathy. Exp Cell Res. 2017;350:327–335. doi: 10.1016/j.yexcr.2016.12.006. [DOI] [PubMed] [Google Scholar]
- 13.Duan LJ, Ding M, Hou LJ, Cui YT, Li CJ, Yu DM. Long noncoding RNA TUG1 alleviates extracellular matrix accumulation via mediating microRNA-377 targeting of PPARgamma in diabetic nephropathy. Biochem Biophys Res Commun. 2017;484:598–604. doi: 10.1016/j.bbrc.2017.01.145. [DOI] [PubMed] [Google Scholar]
- 14.Alvarez ML, DiStefano JK. Functional characterization of the plasmacytoma variant translocation 1 gene (PVT1) in diabetic nephropathy. PLoS ONE. 2011;6:e18671. doi: 10.1371/journal.pone.0018671. [DOI] [PMC free article] [PubMed] [Google Scholar]
- 15.Hanson RL, Craig DW, Millis MP, Yeatts KA, Kobes S, Pearson JV, Lee AM, Knowler WC, Nelson RG, Wolford JK. Identification of PVT1 as a candidate gene for end-stage renal disease in type 2 diabetes using a pooling-based genome-wide single nucleotide polymorphism association study. Diabetes. 2007;56:975–983. doi: 10.2337/db06-1072. [DOI] [PubMed] [Google Scholar]
- 16.Zhou Q, Chung AC, Huang XR, Dong Y, Yu X, Lan HY. Identification of novel long noncoding RNAs associated with TGF-beta/Smad3-mediated renal inflammation and fibrosis by RNA sequencing. Am J Pathol. 2014;184:409–417. doi: 10.1016/j.ajpath.2013.10.007. [DOI] [PubMed] [Google Scholar]
- 17.Zhou Q, Huang XR, Yu J, Yu X, Lan HY. Long noncoding RNA Arid2-IR is a novel therapeutic target for renal inflammation. Mol Ther. 2015;23:1034–1043. doi: 10.1038/mt.2015.31. [DOI] [PMC free article] [PubMed] [Google Scholar]
- 18.Kopp F, Mendell JT. Functional classification and experimental dissection of long noncoding RNAs. Cell. 2018;172:393–407. doi: 10.1016/j.cell.2018.01.011. [DOI] [PMC free article] [PubMed] [Google Scholar]
- 19.Li W, Tanikawa T, Kryczek I, Xia H, Li G, Wu K, Wei S, Zhao L, Vatan L, Wen B, et al. Aerobic glycolysis controls myeloid-derived suppressor cells and tumor immunity via a specific CEBPB isoform in triple-negative breast cancer. Cell Metab. 2018;28:87–103.e106. doi: 10.1016/j.cmet.2018.04.022. [DOI] [PMC free article] [PubMed] [Google Scholar]
- 20.Gao Y, Sun W, Shang W, Li Y, Zhang D, Wang T, Zhang X, Zhang S, Zhang Y, Yang R. Lnc-C/EBPbeta negatively regulates the suppressive function of myeloid-derived suppressor cells. Cancer Immunol Res. 2018;6:1352–1363. doi: 10.1158/2326-6066.CIR-18-0108. [DOI] [PubMed] [Google Scholar]
- 21.Wu Y, Shi T, Li J. NLRC5: a paradigm for NLRs in immunological and inflammatory reaction. Cancer Lett. 2019;451:92–99. doi: 10.1016/j.canlet.2019.03.005. [DOI] [PubMed] [Google Scholar]
- 22.Yoshihama S, Roszik J, Downs I, Meissner TB, Vijayan S, Chapuy B, Sidiq T, Shipp MA, Lizee GA, Kobayashi KS. NLRC5/MHC class I transactivator is a target for immune evasion in cancer. Proc Natl Acad Sci USA. 2016;113:5999–6004. doi: 10.1073/pnas.1602069113. [DOI] [PMC free article] [PubMed] [Google Scholar]
- 23.Luan P, Jian W, Xu X, Kou W, Yu Q, Hu H, Li D, Wang W, Feinberg MW, Zhuang J, et al. NLRC5 inhibits neointima formation following vascular injury and directly interacts with PPARgamma. Nat Commun. 2019;10:2882. doi: 10.1038/s41467-019-10784-y. [DOI] [PMC free article] [PubMed] [Google Scholar]
- 24.Quinn JJ, Chang HY. Unique features of long non-coding RNA biogenesis and function. Nat Rev Genet. 2016;17:47–62. doi: 10.1038/nrg.2015.10. [DOI] [PubMed] [Google Scholar]
- 25.Stossel TP, Condeelis J, Cooley L, Hartwig JH, Noegel A, Schleicher M, Shapiro SS. Filamins as integrators of cell mechanics and signalling. Nat Rev Mol Cell Biol. 2001;2:138–145. doi: 10.1038/35052082. [DOI] [PubMed] [Google Scholar]
- 26.Zhou Q, Xiong Y, Huang XR, Tang P, Yu X, Lan HY. Identification of genes associated with Smad3-dependent renal injury by RNA-seq-based transcriptome analysis. Sci Rep. 2015;5:17901. doi: 10.1038/srep17901. [DOI] [PMC free article] [PubMed] [Google Scholar]
- 27.Deng W, Lopez-Camacho C, Tang JY, Mendoza-Villanueva D, Maya-Mendoza A, Jackson DA, Shore P. Cytoskeletal protein filamin A is a nucleolar protein that suppresses ribosomal RNA gene transcription. Proc Natl Acad Sci USA. 2012;109:1524–1529. doi: 10.1073/pnas.1107879109. [DOI] [PMC free article] [PubMed] [Google Scholar]
- 28.Kobayashi KS, van den Elsen PJ. NLRC5: a key regulator of MHC class I-dependent immune responses. Nat Rev Immunol. 2012;12:813–820. doi: 10.1038/nri3339. [DOI] [PubMed] [Google Scholar]
- 29.Meissner TB, Li A, Kobayashi KS. NLRC5: a newly discovered MHC class I transactivator (CITA) Microbes Infect. 2012;14:477–484. doi: 10.1016/j.micinf.2011.12.007. [DOI] [PMC free article] [PubMed] [Google Scholar]
- 30.Staehli F, Ludigs K, Heinz LX, Seguin-Estevez Q, Ferrero I, Braun M, Schroder K, Rebsamen M, Tardivel A, Mattmann C, et al. NLRC5 deficiency selectively impairs MHC class I- dependent lymphocyte killing by cytotoxic T cells. J Immun (Baltimore, Md.:1950) 2012;188:3820–3828. doi: 10.4049/jimmunol.1102671. [DOI] [PubMed] [Google Scholar]
- 31.Cui J, Zhu L, Xia X, Wang HY, Legras X, Hong J, Ji J, Shen P, Zheng S, Chen ZJ, et al. NLRC5 negatively regulates the NF-kappaB and type I interferon signaling pathways. Cell. 2010;141:483–496. doi: 10.1016/j.cell.2010.03.040. [DOI] [PMC free article] [PubMed] [Google Scholar]
- 32.Yao Y, Wang Y, Chen F, Huang Y, Zhu S, Leng Q, Wang H, Shi Y, Qian Y. NLRC5 regulates MHC class I antigen presentation in host defense against intracellular pathogens. Cell Res. 2012;22:836–847. doi: 10.1038/cr.2012.56. [DOI] [PMC free article] [PubMed] [Google Scholar]
- 33.Li Q, Wang Z, Zhang Y, Zhu J, Li L, Wang X, Cui X, Sun Y, Tang W, Gao C, et al. NLRC5 deficiency protects against acute kidney injury in mice by mediating carcinoembryonic antigen-related cell adhesion molecule 1 signaling. Kidney Int. 2018;94:551–566. doi: 10.1016/j.kint.2018.02.031. [DOI] [PubMed] [Google Scholar]
- 34.Nakamura F, Stossel TP, Hartwig JH. The filamins: organizers of cell structure and function. Cell Adhes Migr. 2011;5:160–169. doi: 10.4161/cam.5.2.14401. [DOI] [PMC free article] [PubMed] [Google Scholar]
- 35.Shao QQ, Zhang TP, Zhao WJ, Liu ZW, You L, Zhou L, Guo JC, Zhao YP. Filamin A: insights into its exact role in cancers. Pathol Oncol Res POR. 2016;22:245–252. doi: 10.1007/s12253-015-9980-1. [DOI] [PubMed] [Google Scholar]
- 36.Wang J, Zhao S, Wei Y, Zhou Y, Shore P, Deng W. Cytoskeletal Filamin A differentially modulates RNA polymerase III gene transcription in transformed cell lines. J Biol Chem. 2016;291:25239–25246. doi: 10.1074/jbc.M116.735886. [DOI] [PMC free article] [PubMed] [Google Scholar]
- 37.Li R, Chung AC, Dong Y, Yang W, Zhong X, Lan HY. The microRNA miR-433 promotes renal fibrosis by amplifying the TGF-beta/Smad3-Azin1 pathway. Kidney Int. 2013;84:1129–1144. doi: 10.1038/ki.2013.272. [DOI] [PubMed] [Google Scholar]
- 38.Roelofs JJ, Rouschop KM, Leemans JC, Claessen N, de Boer AM, Frederiks WM, Lijnen HR, Weening JJ, Florquin S. Tissue-type plasminogen activator modulates inflammatory responses and renal function in ischemia reperfusion injury. J Am Soc Nephrol JASN. 2006;17:131–140. doi: 10.1681/ASN.2005010089. [DOI] [PubMed] [Google Scholar]
- 39.Livak KJ, Schmittgen TD. Analysis of relative gene expression data using real-time quantitative PCR and the 2(-Delta Delta C(T)) method. Methods (San Diego, Calif.) 2001;25:402–408. doi: 10.1006/meth.2001.1262. [DOI] [PubMed] [Google Scholar]
- 40.Tripathi V, Fei J, Ha T, Prasanth KV. RNA fluorescence in situ hybridization in cultured mammalian cells. Methods Mol Biol. 2015;1206:123–136. doi: 10.1007/978-1-4939-1369-5_11. [DOI] [PubMed] [Google Scholar]
Associated Data
This section collects any data citations, data availability statements, or supplementary materials included in this article.
Supplementary Materials
Supplementary Table 1. All Arid2-IR-related DEGs identified by RNA-seq (XLSX 36 kb)
Supplementary Table 2. GO analysis of all significant Arid2-IR-related DEGs (FDR<0.05) (XLSX 27 kb)
Supplementary Table 3. KEGG analysis of all Arid2-IR-related DEGs (FDR<0.05) (XLSX 11 kb)
Supplementary Table 4. Arid2-IR associated proteins or peptides identified by mass spectrometry in mTECs untreated or treated by IL-1β (10 ng/mL) for 30min (XLSX 30 kb)
Supplementary Table 5. Top ten significant GO catalogs of potential Arid2-IR interacting proteins identified by mass spectrometry (XLSX 17 kb)
Supplementary Table 6. Top fifteen significant KEGG pathways of potential Arid2-IR interacting proteins identified by mass spectrometry (XLSX 14 kb)
Supplementary Table 7. All the primers, probes and siRNA sequences used in this study (XLSX 11 kb)
Supplementary File 1. Sequences of Arid2-IR full length (DOCX 13 kb)
Supplementary File 2a. DNA sequencing results of pGL3-NLRC5-promoter. The inserted nucleotides were sequenced by RV3 primers. (AB1 271 kb)
Supplementary File 2b. DNA sequencing results of pGL3-NLRC5-promoter. The inserted nucleotides were sequenced by GLp2 primers (AB1 269 kb)
Supplementary Figure 1. QPCR was used to detect relative level of NLRC5 in Arid2-IR siRNA-1, siRNA-2, siRNA-3 or NC siRNA transfected mTECs. ***p < 0.001 versus NC siRNA, ##p < 0.01 Arid2-IR siRNA-1versus Arid2-IR siRNA-2.A si-1, 2, 3 were short for Arid2-IR siRNA-1, 2, 3 (PNG 7 kb)
Supplementary Figure 2. Statistical of Flna and NLRC5 protein level in UUO(A) and IRI(B) kidney respectively. * p < 0.05 versus control mice (PNG 344 kb)
Supplementary Figure 3. (A) Statistical of the protein level of phosho-IKK, IKKβ, phosho-p65, p65, phosho-IκB, IκB in IL-1β (10 ng/mL) treated mTECs at different time points. *p < 0.05, ***p < 0.001 versus 0h. (B)Statistical of NLRC5 protein level in NC or Arid2-IR siRNA-1 transfected mTECs. MTECs were then treated by IL-1β (10 ng/mL) at different time points. *p < 0.05, **p < 0.01, ***p < 0.001 versus 0h. (C) Statistical of NLRC5 protein level in NLRC5 or NC siRNA transfected mTECs. **p < 0.01 versus con; ###p < 0.001 versus NC. (D) Statistical of the protein level of phosho-IKK, IKKβ, phosho-p65, p65, phosho-IκB, IκB in IL-1β (10 ng/mL) treated mTECs at 0, 5m, 30m. **p < 0.01, ***p < 0.001 versus 0h; ##p < 0.01, ###p < 0.001 versus NC siRNA at same time point; &&p < 0.01, &&&p < 0.001 versus Arid2-IR siRNA-1 at same time point (PDF 160 kb)
Supplementary Figure 4. (A)Statistical of Flna protein level in NC or Flna siRNA treated mTECs. **p < 0.01 versus con; ##p < 0.01 versus NC. (B)The apoptosis rate of mTECs had no significantly change after transfecting with transfected with Arid2-IR siRNA-1 or NC siRNA (n = 3 for each group) (PNG 39 kb)
Supplementary Figure 5. Immunofluorescence of E-cadherin (green, left panel) and a-SMA (green, right panel) of mTECs, Over 95% cells were E-cadherin positive and a-SMA negative. DAPI staining is blue. Magnification: ×200 (PNG 379 kb)
Supplementary Figure 6. Pearson’ s correlation analysis was performed base on transcript abundance (RPKM) of the gene in Arid2-IR siRNA-1 (n=3) and NC (n=3) siRNA transfected groups (PNG 133 kb)


