

Abstract
RNase H activities from HeLa cells (either of cytoplasmic or mitochondrial origin), and from mitochondria of beef heart and Xenopus ovaries, have been tested with RNA–DNA substrates of defined length (20 bp) and sequence. Substrates were either blunt-ended, or presented DNA or RNA overhangs. The hydrolysis profiles obtained at early times of the digestion showed a good correlation between the class of RNase H, either type I or II assigned according to biochemical parameters, whatever the organism. Consequently, the pattern of primary cuts can be considered as a signature of the predominant RNase H activity. For a given sequence, hydrolysis profiles obtained are similar, if not identical, for either blunt-ended substrates or those presenting overhangs. However, profiles showed variations depending on the sequence used. Of the three sequences tested, one appears very discriminatory, class I RNases H generating a unique primary cut 3 nt from the 3′ end of the RNA strand, whereas class II RNases H generated two simultaneous primary cuts at 6 and at 8 nt from the 5′ end of the RNA strand. Hydrolysis profiles further confirm the assignation of the mitochondrial RNase H activity from HeLa cells, beef heart and Xenopus oocytes to the class II.
INTRODUCTION
Ribonucleases H are nucleases that specifically cleave the RNA strand of RNA–DNA hybrids; this activity was first identified in calf thymus extracts (1), and its ubiquitous occurrence in prokaryotic as well as in eukaryotic cells was soon recognised (2). Moreover, it has been shown to be associated with reverse transcriptases (3), constituting a well-defined subdomain distinct from the DNA polymerising centre of this enzyme. The important roles played by this RNase H activity in the whole process of reverse transcription is now well understood (4). On the contrary, the physiological role of the cellular enzymes is more elusive, although their participation in various aspects of nucleic acid metabolism such as DNA replication, DNA repair and transcription is suspected (5). The situation is complicated by the presence of multiple RNases H within a given cell type. In eukaryotic cells, on the ground of biochemical and immunological experiments, it was recognised early that there were at least two different activities, namely class I and class II ribonucleases H (6,7), encoded by two different genes (8–10).
RNases H have been shown to play a critical role in antisense effects of oligodeoxynucleotides where their presence appears to be a key factor to success (11), but also to be a source of decreased specificity when ‘bystander oligonucleotides’ (mismatched oligos hybridising to untargeted messenger RNAs) provide substrates for RNases H (12,13).
Knowledge of the behaviour of these RNases H could help in the design of antisense oligonucleotides, enhancing their efficiency against targeted sequences and decreasing their efficiency on imperfect DNA–RNA hybrids. At first, it would be of interest to know if these enzymes display a common behaviour, that is an identical manner of hydrolysing a given DNA–RNA hybrid substrate, despite their different biochemical characteristics, or if each enzyme has its own behaviour, in which case hydrolytic profiles obtained with substrates of defined length and sequence would provide a kind of signature, characteristic of each enzyme.
To answer this question we have designed a set of hybrids, 20 nt long, containing all possible dinucleotides and presenting AU or GC rich regions placed at either the 5′ or the 3′ side of the hybrid. These hybrids have been made either blunt or of RNA hybridised to a longer DNA oligonucleotide and vice versa. Hydrolysis profiles have been obtained with partially purified RNases HI and HII from HeLa cells as well as with RNases H of mitochondrial extracts from Xenopus oocytes, beef heart or cultured HeLa cells. Overall, these hydrolytic profiles constitute a signature of the class of these enzymes whereas no significant variation was seen from one species to another for a given class.
Moreover, in this study we have collected additional biochemical data on mitochondrial RNase H activities which, when combined with hydrolytic profiles, point out that the main mitochondrial RNase H is an RNase HII, at least in the three species examined (Xenopus, bovine, human), thus confirming our previous assumptions (14).
MATERIALS AND METHODS
Nucleic acid substrates
Both DNA and RNA oligonucleotides have been chemically synthesised. DNA oligonucleotides were obtained from Eurobio (Les Ulis, France) and Genset (Paris, France). RNA oligonucleotides were synthesised on an Expedite 8909 synthesiser (15). Purification and radiolabelling were done according to standard procedures (15). Concentrations were determined from their absorbance at 260 nm (16). DNA–RNA hybrids were obtained by mixing 20 µM of RNA strand and radiolabelled RNA (∼400 000 c.p.m. for 100 µl final volume) together with 24 µM of DNA strand in 10 mM Tris–HCl pH 8.0, 1 mM EDTA and 100 mM NaCl. The resulting solution was heated for 2 min at 98°C, then allowed to cool down at room temperature. [3H] RNA–DNA hybrid and [32P] polyrA–polydT were obtained as described previously (17).
Sources for RNase H activities
Recombinant human ribonuclease HII (10) was a generous gift from Dr Robert Crouch (NICHD, NIH, Bethesda, MD, USA), whereas immunopurified bovine ribonuclease HI (9) was kindly provided by Dr Peter Frank (Institut für Tumorbiologie und Krebsforschung, Vienna, Austria).
Nuclei, mitochondria, and cytosolic fractions prepared by differential centrifugation were obtained from Computer Cell Culture Center (Mons, Belgium); mitochondria from Xenopus laevis oocytes were prepared according to the procedure of Brun et al. (18). Beef heart mitochondria were prepared as follows: fresh hearts were obtained at the slaughterhouse soon after death and transported to the laboratory in cracked ice. All preparation steps were done at 4°C. After removal of fat, pericardium and internal connective tissue, the heart was cut into small cubes, minced with a domestic meat grinder and resuspended in 2 vol of buffer M (0.3 M sucrose, 1 mM EGTA, 5 mM MOPS, 5 mM KH2PO4,, 0.1% BSA adjusted to pH 7.4 with KOH). The suspension was homogenised in a ‘Warring blender’ twice for 30 s at high speed. The homogenate was readjusted to pH 7.4 and centrifuged for 15 min at 1500 g. The supernatant was saved, filtered on two layers of cheesecloth, and centrifuged for 10 min at 10 000 g. The resulting mitochondrial pellet was washed at least three times in buffer M, followed by centrifugation for 10 min at 10 000 g until the supernatant was colourless. After the last wash, the pellet was resuspended in a small volume of buffer M devoid of BSA, and the protein concentration was determined as described by Lowry et al. (19) using serum albumin as a standard. Then the suspension was centrifuged for 10 min at 10 000 g, the supernatant was discarded, and the mitochondrial pellet was stored at –80°C.
Fractionation of HeLa cell cytosolic extract
Cytosolic fraction (9 ml) was ultracentrifuged for 1 h at 50 000 g and the supernatant was dialysed overnight against buffer P (50 mM Tris–HCl pH 7.9 at 4°C; 10 mM KCl; 1.5 mM β-mercaptoethanol). The dialysate (8 ml at 12.5 mg protein per ml) was diluted five times in buffer P and loaded on a 35 ml phosphocellulose column (P11 Whatman) equilibrated with buffer P. After extensive washing with buffer P (until the OD 280 nm had returned to baseline), the adsorbed proteins were eluted with a linear 10–500 mM KCl gradient in buffer P. Collected fractions were analysed for protein content using the Bradford assay (20), for RNase H activity using a liquid assay with [3H]RNA–DNA hybrid as substrate (17), and for NaCl concentration by conductimetry.
Fractionation of HeLa cell nuclear extract
Extract was prepared from purified nuclei using the procedure described by Rossmanith et al. (21). An aliquot of 2 ml of nuclear extract (6 mg/ml) was diluted 20 times with buffer P and fractionated on a phosphocellulose column as described above.
Partial purification of the mitochondrial RNase H from beef heart
A frozen mitochondrial pellet, stored at –80°C, was rapidly thawed at 37°C, and resuspended at ∼5 mg protein/ml in lysis buffer (20 mM Tris–HCl, pH 7.5, 0.5 M KCl, 1 mM DTT, 1% Triton X-100 and Complete®, a cocktail of protease inhibitors from Roche Diagnostics, Meylan, France). The resulting suspension was incubated for 45 min at 4°C under gentle agitation, and in the middle (at 5 and 20 min) was passed in a Potter homogeniser (five strokes each time). Then, it was centrifuged for 3 h at 250 000 g at 4°C, in a Kontron TFT 70.38 rotor. The resulting supernatant was dialysed overnight against 20 mM sodium phosphate pH 7.5, 2 mM 2-mercaptoethanol, 20% glycerol, and stored at –20°C.
Crude mitochondrial extract (21 ml) was dialysed overnight against 2 l of buffer A (50 mM Tris–HCl pH 7.5, 1.5 mM 2-mercaptoethanol). After clarification by centrifugation at 50 000 g for 15 min at 4°C, the dialysate (36 ml of 3 mg protein/ml) was loaded (0.9 ml/min) onto a phosphocellulose column (1.6 cm diameter × 32 cm height) previously equilibrated with buffer A. After OD 280 nm had returned to baseline, the column was run first for 60 min with buffer A + 0.3 M NaCl, then with a linear 0.3 M→1 M NaCl gradient, eluting the RNase H activity at ~0.55 M NaCl. Active fractions were pooled and concentrated in storage buffer (50 mM Tris pH 7.9, 1 M ammonium sulfate, 1 mM 2-mercaptoethanol, 1 mM EDTA, 10% glycerol) by reiterative ultrafiltrations through a Centricon® Plus-20 filter.
Tests for RNase H activity
Liquid assays using [H3]RNA–DNA hybrid were performed as described previously (17). One unit of activity is the amount of enzyme converting100 pmol of tritiated RNA–DNA hybrid into TCA-soluble material in 10 min at 37°C under optimal conditions. Activity gels using 32P-labelled polyrA–polydT were performed in the presence of 0.2 mM MnCl2 for enhanced sensitivity (22). An activity gel is basically an SDS–PAGE in which a radiolabelled nucleic acid substrate (e.g., an RNA–DNA hybrid with a labelled RNA strand, for an RNase H) has been embedded in the resolving gel by copolymerisation. After electrophoresis, the gel is submitted to a treatment which removes the SDS and allows polypeptides to renature and gain activity. An RNase H will digest the radiolabelled strand of the RNA–DNA hybrid substrate, which will be visualised as a white band on a dark background after autoradiography.
The reaction mixture for analysis of the hydrolysis patterns of RNA–DNA hybrids was made in 100 µl of either buffer I (30 mM Tris–HCl pH 8.0, 30 mM ammonium sulfate, 2 mM MgCl2, 0.1% 2-mercaptoethanol) or buffer II (30 mM Tris–HCl pH 8.5, 40 mM ammonium sulfate, 20 mM MgCl2, 0.1% 2-mercaptoethanol) and contained 2 µM substrate, that is a radiolabelled RNA–DNA hybrid of defined length and sequence, prepared as described above. The choice of the buffer was made according to the assignation of the activity to class I or class II, resulting from prior investigations using liquid assays and activity gels.
After addition of the enzyme (3–15 µl depending on the volume activity), the mixture was incubated at 37°C. Aliquots of 8 µl were taken at different times (0, 0.5, 1, 2, 5, 10, 15, 30, 60 and 90 min) and then added to 17 µl stop solution containing yeast tRNA (1 mg/ml), 0.6 M sodium acetate and 50 mM EDTA. Ethanol (200 µl) was added to each sample which were then incubated for 30 min at –80°C. After 15 min centrifugation at 24 000 g, 4°C, the pellet was washed with 75% ethanol and dried. The pellet was dissolved in 20 µl loading buffer, then loaded on a 20% polyacrylamide gel containing 7 M urea, TBE 1×, together with samples of radiolabelled RNA which had been submitted to mild alkaline hydrolysis and to partial digestion with RNase T1. The gel was electrophoresed for ∼2 h at 40 W, until the xylene cyanol dye had run half the gel length, and autoradiographed.
RESULTS
Xenopus mitochondrial RNase H
Eukaryotic cells contain at least two RNase H activities, HI and HII. From previous work, HI has been recognised to be essentially nuclear, whereas the localisation of HII was found to be more ubiquitous (14,23). More notably, it has been proposed that HII had a mitochondrial localisation in Xenopus oocytes but due to the lack of activity in liquid assays this assumption was based mainly on activity gels. Since then we have found that another preparation of Xenopus mitochondria contained a low (∼4 U/mg protein) but detectable activity in solution. Gel filtration (Fig. 1) of the extract shows that the major part of the protein, detected by activity gel, elutes in the flowthrough in a form not detectable in liquid assays, thus confirming our previous observations (14), whereas a smaller part elutes in a peak corresponding to a globular protein of ∼38 kDa, therefore compatible with a monomeric form of the enzyme and this form is found active in a liquid assay. In this assay the activity was found to display biochemical properties of a class II RNase H as deduced from its preference for divalent cations (compare with Table 1), its optimum pH (8.5) and its extreme sensitivity to N-ethyl maleimide.
Figure 1.
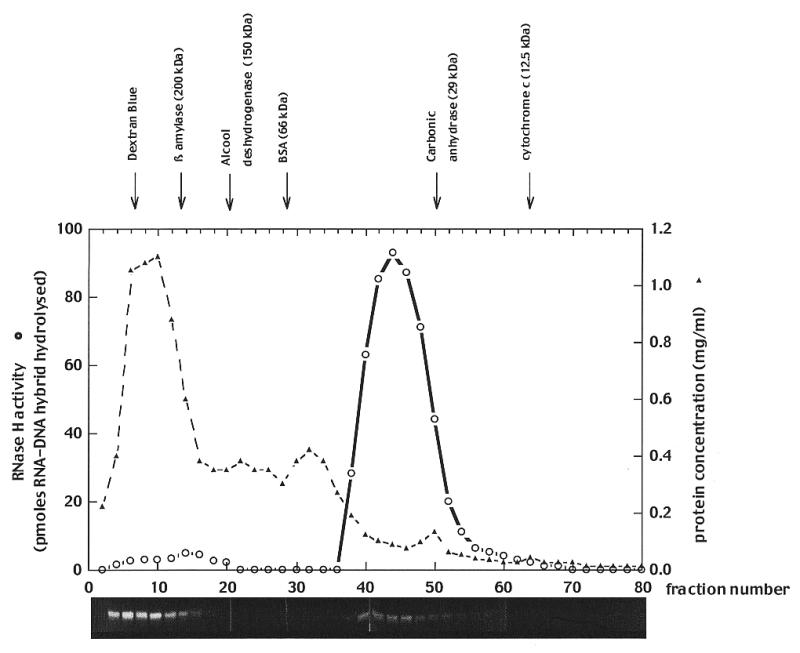
Gel filtration chromatography of a mitochondrial extract from Xenopus ovaries. An aliquot of 3 ml of mitochondrial extract (∼18 mg protein), prepared as described in Materials and Methods, was loaded on a column of Sephacryl S 200 HR (1.6 cm diameter × 90 cm height) operated at a constant flow rate of 18 ml h–1 of 20 mM sodium phosphate pH 7.5, 0.2 M NaCl and 10% glycerol. After 75 ml have been run out of the column, 1 ml fractions were collected, and analysed for RNase H activity with the liquid assay (open circles), or activity gels.
Table 1. Summary of biochemical parameters collected for the different fractions of HeLa cell extracts and the mitochondrial Xenopus RNase H activity.
| [KCl] for elution | Levels relative to the major peak | Optimum Mg | Optimum Mn | Mn/Mg activity ratio | Presence of a 32 kDa band in activity gels | |
|---|---|---|---|---|---|---|
| Cytosolic extract | ||||||
| Flow through | 16 mM | 0.16 mM | 0.27 | * | ||
| Minor peak 1 | 0.1 M | 8.7 | 2 mM | 0.10 mM | 0.88 | |
| Major peak | 0.2 M | 100.0 | 2 mM | 0.04 mM | 0.27 | |
| Minor peak 2 | 0.4 M | 10.4 | 30 mM | 0.04 mM | 0.17 | * |
| Nuclear extract | ||||||
| Flow-through | 20 mM | 0.16 mM | 0.29 | * | ||
| Minor peak 1 | 0.1 M | 8.9 | 2 mM | 0.10 mM | 0.80 | |
| Major peak | 0.2 M | 100.0 | 2 mM | 0.02 mM | 0.24 | |
| Minor peak 2 | 0.4 M | 70.0 | 30 mM | 0.10 mM | 0.17 | * |
| Minor peak 3 | 0.5 M | 49.0 | 30 mM | 0.10 mM | 0.18 | * |
| Mitochondrial extract | 20 mM | 0.20 mM | 0.18 | * | ||
| Mitochondrial RNase H Xenopus | 20 mM | 0.20 mM | 0.07 | * |
Mg/Mn is the ratio of activities determined for each divalent cation at its optimum concentration.
HeLa cells and beef heart mitochondrial RNase H
We have examined preparations of mitochondria from cultured human HeLa cells and from beef heart. This last one was chosen for being an abundant source of mitochondria that could provide a suitable starting material for purifying the mitochondrial RNase H.
In mitochondrial extracts from beef heart, the activity recovered was easily detected with both assays and was found to have divalent cation dependance of the class II (data not shown). For direct comparison with Xenopus mitochondria, the beef heart mitochondrial extract has been also fractionated on a Sephacryl S 200 HR in identical conditions. If, as for Xenopus, two peaks of activity could be recognised, there was a correlation between activity gels and liquid assays for both: the peak with the lower mobility should correspond to the monomeric form of the enzyme, whereas the peak of higher mobility (∼150 kDa from comparison with protein markers) could correspond to the association of the enzyme either with itself or with other proteins. Although the chromatographic behaviour was revealing heterogeneity, liquid assays and activity gels did not point out substantial differences for ionic requirements between these activities. In summary, studies with mitochondria from both Xenopus ovaries and from beef heart agree with the presence of a class II RNase H that appears to be the predominant if not unique RNase H in these organelles. To further investigate whether this scheme also applies to human cells we have, in addition, realised mitochondrial extracts from human HeLa cells. The limited amount available has prevented us performing fractionations. However, as for Xenopus and bovine mitochondria, the predominant activity could be assigned to a class II enzyme, as deduced from its requirements for divalent cations (Table 1) and its extreme sensitivity to inhibition with N-ethyl maleimide (complete inhibition at 1 mM NEM).
Cytosolic and nuclear RNases H from HeLa cells
We have fractionated both cytosolic and nuclear extracts from HeLa cells on phosphocellulose. The major part of the activity could bind to the column and be eluted from it with an increasing salt gradient, according to Eder and Walder (24). Several peaks of activity were eluted and the profiles obtained with both extracts were similar (Fig. 2 illustrates the nuclear fractionation): there is a major peak of activity preceded by a small peak (minor peak 1) and followed by one or two others eluting at higher salt concentrations (minor peaks 2 and 3). However, for the different individual peaks, the activity levels (deduced from the peak area) compared relatively to the level found for the major peak, and showed differences between the two extracts (Table 1). Each peak was checked both in activity gels (Fig. 2B), and in liquid assays for the determination of divalent cation optima (Table 1). From this study, it can be concluded that:
Figure 2.

Fractionation of the HeLa cell nuclear extract (A) on phosphocellulose columns, as described in Materials and Methods. RNase H activity measured by liquid assays and protein content measured with the Bradford assay have been normalised to volumes of 100 µl. Activities present in the various peaks have been pooled, concentrated and aliquots have been tested on activity gel (B).
The major peak of activity may correspond to the class I enzyme, with properties corresponding to those already mentioned by Eder and Walder (24). Notably, the Mn2+/Mg2+ ratio of activity is similar to the one determined for their purified enzyme.
The ‘minor 1’ peak has similar properties, but the Mn2+/Mg2+ ratio of activity is higher and closer to the one frequently observed with RNases H of class I.
Neither activity is detected in activity gels, contrasting with fractions belonging to the flow-through, ‘minor 2’ peak and ‘minor 3’ peak, or mitochondrial extracts which all display a renaturable band of 32 kDa (Fig. 2B). All these last fractions displayed an optimum for MgCl2 one order of magnitude higher than those determined for the ‘minor 1’ peak and for the major peak.
From these investigations, it appears that RNases H can be roughly classified in two categories. One corresponds to activities with an optimum for Mg2+ of 2 mM, and are not easily detected with activity gels. We hypothesise that this may correspond to isoforms of RNase HI. The other category corresponds to RNase H activities with an optimum of 20 mM MgCl2, and are easily detected as a 32 kDa band in activity gel. The different fractions resolved by this chromatography could correspond either to isoforms or to various associations of the RNase H monomer with other polypeptides. They would all belong to the same class II of RNase H activities.
RNase H hydrolysis profiles
We decided to test these different fractions for hydrolysis on RNA–DNA hybrid substrates of defined length and sequence to determine if the differences observed with biochemical parameters would be reflected at the catalytic level. Several RNA–DNA hybrids were designed and their complete list is given in Figure 3 (the DNA sequence complementary to the RNA strand is symbolised by a dotted line). They are 20 bp, long reflecting the length of most hybrids used in antisense experiments and ensuring Tms high enough to avoid partial dissociation of the hybrid in the conditions of the experiment. Sequences were designed to contain all possible dinucleotides and were synthesised both 5′→3′, and with the reverse polarity to test for possible end effects. One can recognise a GC rich region, an AU rich region and a more balanced region. In both orientations, the AU rich region remaining central, another sequence was designed to shift the AU rich block in a 3′ position, the balanced region becoming central. Hybrids were made either blunt or with RNA overhangs, mimicking an antisense situation, or with DNA overhangs, mimicking an Okazaki primer-like situation.
Figure 3.

(A) Hydrolysis profiles generated by the RNase H activity of the major peak of HeLa cell extracts on blunt RNA–DNA hybrids BD1, BD2 and BD3. (B) Summary of the initial cuts observed with hybrids that were either blunt (BD1, BD2), possessing DNA overhangs (DOD1, DOD2) or RNA overhangs (ROD1, ROD2).
The RNA strands were labelled at their 5′ end, and a time-course of the digestion of the hybrids was then performed as described in Materials and Methods. We were interested to see where the first cuts were taking place at earlier times. At later times the pattern becomes less interpretable as it results from the superimposition of primary and secondary cuts.
RNase HI and RNase HII hydrolysis signatures
To test our surmise that RNases HI and HII could display different hydrolysis profiles for the same hybrid, we have tested purified RNases HI and HII generously provided by Drs R. Crouch and P. Frank. For the two substrates tested, BD2 and BD3, it was striking that RNase HII generates major cuts on the 5′ part of the hybrid (relative to the RNA strand), whereas the RNase HI generates cuts on the 3′ side (compare with Table 2). This prompted us to test our fractionated RNase H activities to look for a correlation between the class of RNase H assigned on the ground of biochemical criteria and hydrolysis profiles generated by these activities on defined hybrids.
Table 2. Summary of the observed BD2 cleavage initial cuts patterns obtained with RNase H activities from various sources.
| Source of RNase H | Type of preparation | BD2 cleavage | Optimum Mg2+ | Type in literature |
|---|---|---|---|---|
| Calf thymus | purified | 3 nt from 3′ end | 2 mM | RNase HI |
| HeLa cells | nuclear extract major peak | 3 nt from 3′ end | 2 mM | RNase HIa |
| nuclear extract minor peak 1 | 3 nt from 3′ end | 2 mM | RNase HIa | |
| cytosolic extract major peak | 3 nt from 3′ end | 2 mM | RNase HIa | |
| cytosolic extract minor peak 1 | 3 nt from 3′ end | 2 mM | RNase HIa | |
| Rabbit reticulocyte | lysate for cell free translation | 3 nt from 3′ end | 5 mM | RNase HIa |
| Human RNase H | recombinant, purified | 6 and 8 nt from 5′ end | RNase HII | |
| HeLa cells | nuclear extract minor peak 2 | 6 and 8 nt from 5′ end | 20 mM | RNase HIIa |
| cytosolic extract minor peak 2 | 6 and 8 nt from 5′ end | 30 mM | RNase HIIa | |
| nuclear extract minor peak 3 | 6 and 8 nt from 5′ end | 30 mM | RNase HIIa | |
| HeLa cells mitochondria | mitochondrial extract | 6 and 8 nt from 5′ end | 20 mM | RNase HIIa |
| Beef heart mitochondria | partially purified | 6 and 8 nt from 5′ end | 20 mM | RNase HIIa |
aThe assignation of the RNase H to class I or the class II has been made in the present study.
It turned out that hydrolysis patterns obtained with RNase H activities present in peaks from the fractionation of the cytosolic extract were found to be identical to those generated by their counterpart in the fractionation of the nuclear extract. So, for instance, when we present results obtained with the major peak, they will refer to results obtained with the major peak of the cytosolic extract fractionation as well as the major peak of the nuclear extract fractionation. Looking first to hydrolysis profiles obtained with the major peak, it was found that primary cuts were generated essentially on the 3′ side of the hybrid, but with clear distinctions depending on the sequence of the hybrid used. Figure 3 present profiles generated on blunt-ended substrates. Whereas a single primary cut is observed at a distance of 3 nt from the 3′ end of the BD2 substrate, two simultaneous cuts are observed with the BD1 substrate (at 4 and 8 nt from the 3′ end) and three simultaneous cuts are observed with the BD3 substrate (at 2, 6 and 9 nt from the 3′ end). When greater amounts of activity were used, we observed a complete hydrolysis of the hybrid with short fragments (5–6 nt long) accumulating at later times (data not shown). This behaviour can be expected if hybrids with the RNA strand recessed after the initial cuts can be processed again by the enzyme at their 3′ end, until the remaining RNA part becomes too short to remain hybridised to the DNA strand under the temperature (37°C) and ionic conditions used for the assay.
That RNA–DNA hybrids with RNA recessed at the 3′ end can be processed by the enzyme is illustrated also by the hydrolysis profiles obtained with substrates possessing DNA overhangs, DOD1 and DOD2. Hydrolysis profiles identical to those observed with blunt-ended substrates are generated by the RNase H activity of the major peak. The same initial cuts are also observed with substrates ROD1 and ROD2 presenting the reverse situation, that is with an RNA overhang instead of a DNA overhang. In conclusion, the RNase H activity present in the major peak generates primary cuts on the 3′ part of the RNA–DNA hybrid, independently of the single-stranded sequences, either RNA or DNA flanking it (Fig. 3B).
Results obtained with ‘minor 1’ peak activity were essentially identical to those obtained with the major peak (data not shown). So, despite differences in the chromatographic behaviour and in the ratio of activities measured with Mn2+ and Mg2+, it is likely that these two peaks may correspond to two forms of the same enzyme, possibly reflecting differences in post-translational modifications.
Similar experiments were performed with the ‘minor 2’ peak fraction as a source of RNase H activity (Fig. 4). Resulting hydrolysis patterns contrast with those previously obtained with the major peak and with the ‘minor 1’ peak, in that now primary cuts are observed in the 5′ part of the hybrid. Again, the patterns obtained depend on the hybrid used: whereas two simultaneous cuts occur at 6 and 8 nt from the 5′ end of the RNA strand of the hybrid BD2, two primary cuts are observed at 3 and 12 nt from the 5′ end of the RNA strand of the BD1 hybrid. Also, whereas cuts are limited to nucleotides 5–8 from the RNA 5′ end for BD2, the pattern appears more extended for BD1, with cuts spreading all over the sequence from nucleotides 3–12 from the RNA 5′ end. General features observed with blunt-ended substrates are still observed with the overhang substrates but one can now notice some variations summarised in Figure 4B, indicating that the presence of overhangs can be inhibitory for the action of the enzyme near the 5′ end (RNA strand) of the hybrid.
Figure 4.

(A) Hydrolysis profiles generated by the minor peak 2 of HeLa cell extracts on blunt RNA–DNA hybrids. (B) Summary of the initial cuts observed with hybrids that were either blunt (BD1, BD2), possessing DNA overhangs (DOD1, DOD2) or RNA overhangs (ROD1, ROD2).
Signatures of RNase H from mitochondrial lysates
We have examined the RNase H activities present in mitochondrial lysates from HeLa cells. Results obtained with blunt-ended substrates show similarities to those obtained with minor peak 2. When examining cuts observed with substrates made with RNA overhangs we find that cuts occur primarily in the hybridised part of the RNA–DNA hybrid ROD1, but at later times cuts are also observed outside the hybridised part, reflecting the contribution of RNases other than RNase H in this crude mitochondrial extract, which are responsible for the accumulation of short oligonucleotides at later times. This interpretation is supported by the observation that partially purified RNase H from beef heart mitochondria generates the same digestion profile on ROD1 as those generated by HeLa cell mitochondrial lysates at earlier times, but no RNA oligonucleotides shorter than 12 nt are generated (Fig. 5). So, in crude mitochondrial extracts, RNA–DNA hybrids are degraded first by an RNase H activity and the resulting RNA fragments are degraded further by other RNases present in the extract.
Figure 5.

Hydrolysis profiles generated by the RNase H activity partially purified from beef heart mitochondria on blunt-ended substrates BD2 and BD3 and on the RNA overhang hybrid ROD1.
In an attempt to summarise the results obtained with the various sources of RNase H activity that we have checked, we have listed them in Table 2 according to their optimum for magnesium and the initial cuts observed for BD2. It is striking that there is an excellent correlation between the hydrolysis profile generated on BD2 with the class of enzyme assigned on the ground of biochemical criteria such as the optimum for magnesium.
DISCUSSION
The presence of a mitochondrial RNase H with properties of a class II enzyme has been confirmed for Xenopus ovaries, for beef heart and for cultured human HeLa cells. The activity belongs to a 32 kDa polypeptide which can easily be detected in activity gels. Chromatographic fractionations indicate that the protein is present in mitochondrial extracts both as a monomeric and a multimeric form, but whereas the monomeric form has constantly been found to be active in liquid assays, the multimeric form, representing the bulk of the RNase HII polypeptide was found to be inactive in the case of Xenopus mitochondria, confirming our previous results (14).
Fractionation of HeLa cells by phosphocellulose chromatography resolves two groups of activity:
(i) Those (‘minor 1’ peak and ‘major’ peak) eluting at low to moderate ionic strength, remaining undetected in activity gels and exhibiting the biochemical properties of class I RNases H.
(ii) Those (‘minor 2’ and ‘minor 3’ peaks) eluting at a higher ionic strength, detected as a 32 kDa polypeptide in activity gels, and exhibiting biochemical properties of class II RNases H.
These fractions were tested, together with mitochondrial extracts, for hydrolysis of RNA–DNA hybrid substrates of definite length and sequence. Results have shown a distinction between the two classes of enzymes, each class displaying a particular profile of digestion, which constitutes a sort of signature of each enzyme. As flanking sequences do not appear to critically influence the location of the primary cuts, at least for class I enzymes, it can be proposed to distinguish the two classes of enzymes by using simple blunt-ended substrates.
Contemplating results obtained using these substrates for three different sequences, it appears that: (i) class I RNases H essentially initiate a few strong cuts in the 3′ part of the hybrid apparently at some preferred dinucleotides (GpA and UpA); (ii) class II RNases H either initiate a few strong cuts on the 5′ part of the hybrid (e.g. BD2), or generate an array of cuts in the central part of the hybrid (e.g. BD1). However it can generate additional cuts on the 3′ part of the hybrid if the sequence is favourable, apparently for AU-rich sequences (e.g. BD3). Our observations agree with the recent report of Wu et al. (25) that cloned human RNase HII (named by these authors human RNase H1 because of its homology to the Escherichia coli RNase H1) cleaves preferentially near the 5′RNA–3′DNA terminus of the duplex, between 8 and 12 nt for the sequences examined, a behaviour previously noticed with RNase HII purified from human placenta (26).
So both classes of RNase H appear to have a general trend modulated by the particular sequence of the hybrid. This results in sequences that are more discriminatory than others. From our set of three hybrids tested, the BD2 hybrid is particularly remarkable: class I RNases H generate one specific strong cut near the 3′ end of the hybrid, whereas class II RNases H generate two simultaneous strong cuts on the 5′ end of the hybrid (Table 2). Consequently, this sequence is highly discriminatory for the predominant RNase H activity, even in the presence of other RNase activities, which may complicate hydrolysis profiles at greater times, as observed in crude mitochondrial extracts, for example. So, hydrolysis profiles obtained with oligonucleotides such as BD1, BD2 and BD3 can be used as an additional criterion for classifying RNase H activity. However the use of such defined hybrids is technically a little more complicated (as it necessitates running a sequencing gel) than the simple determination of divalent cation dependence of enzyme activity practised with liquid assays on DNA–RNA substrates of random sequences. It should then rather be used as a strong confirmatory test for the classification of a source to the class I or the class II of RNases H.
Profiles obtained with enzymes from different animal sources indicate that there is apparently no important variation between enzymes of the same class, belonging to different species: class I human, bovine and rabbit enzymes generated identical profiles with the blunt-ended substrates tested. Inclusion of the rabbit in this comparison comes from experiments using rabbit reticulocyte lysate as a source of enzyme (Table 2), which had been previously assigned to class I on the basis of biochemical criteria (17). Profiles obtained with BD1 and BD2 were identical to those obtained with purified ribonuclease HI from calf thymus (data not shown). This was similarly observed with class II human and bovine enzymes and also from Xenopus, as deduced from inspection of hydrolysis profiles obtained with Xenopus mitochondrial extracts containing an RNase H activity detectable in liquid assays (data not shown).
The exact reason for such differences might reflect different relative locations of the binding site with respect to the catalytic centre. An asymmetric positioning of the human RNase HII on its substrate has been previously proposed (14), and this proposal is supported further by the results obtained by Wu et al. (25). In contrary to what has been described for E.coli (13,27), we did not detect cuts generated outside the hybridised part of the RNA hybrid. In fact, none of the profiles we obtained fitted with those obtained with the E.coli enzyme or wheat germ extract (data not shown) which have been the favourite enzymes tested by antisense RNase H designers (11). This suggest that E.coli RNase H is not an appropriate enzyme for evaluating RNase H susceptibility of various RNA–DNA duplexes. This might eventually be misleading when chemically modified (chimeric) oligonucleotides are used.
In summary, preferred hydrolysis cuts generated by the two classes of enzymes which, although showing some variations with the sequence used, appear to be very different but complementary, one preferring attack on the 3′ part, the other on the 5′ part, and this could somehow lead to strategies aimed to design antisense oligonucleotides favouring either one or the other of the two classes of RNases H. For nuclear targets such as pre-mRNAs it could be of interest to favour RNase HI action which has been shown to be essentially nuclear, both by immunostaining of bovine cells (23) and by microdissection of Xenopus laevis oocytes (14). For mitochondrial RNA targets it would be essential to favour the RNase HII activity. For cytosolic targets such as mRNAs, a favourite target for antisense, it is less easy to predict which activity has to be favoured, as both activities are expected to be present at least in small amounts, first because both the nuclear RNase HI and the mitochondrial RNase HII have to be synthesised in the cytoplasm before being exported into their respective compartments. Subcellular fractionations cannot give a definitive answer concerning the relative abundance of both enzymes, as a large part of RNase HI is known to result from nuclear leakage during cell fractionation, being recovered in the cytosolic fraction (28). Similarly, part of the RNase HII recovered in the cytosolic fraction as peak minor 2 could result from mitochondrial contamination as presence of the marker enzyme citrate synthase, an enzyme of the mitochondrial matrix, was detected in the cytosolic fraction. Its specific activity was found to be one-tenth that of mitochondrial lysate. An indirect answer could be provided by comparing the antisense efficiency of chimeric oligonucleotides targeting the same sequence of a mRNA but designed to favour only one of the two RNases H, by using antisense DNA oligonucleotides in which residues on either the 5′ or 3′ part will be replaced by chemically modified versions of the nucleotides known to be unable to support RNase H activity (e.g., methylphosphonates, phosphoramidates, 2′O-methylribonucleotides, PNAs, etc.). The targeted RNA could be chosen to have a well defined cytoplasmic localisation (e.g., viral RNAs of cells infected with the Vesicular Stomatitis Virus; 29). Another way could be to conduct such studies of antisense efficiency in the presence of inhibitors specific for only one of the two RNases H. Such specific inhibitors are not known at present but could be obtained by selecting aptamers derived from in vitro selection-amplification (SELEX) (30,31) for binding to purified RNases H. The recent acquisition of cloned recombinant RNases H (8,9) should facilitate the search for such inhibitors. Finally, it should be reminded that early studies have shown that the relative abundance of RNase HII and HI could vary with both the cell type and the physiological status of the cell (32) so that the choice of design for the antisense molecule could also be influenced by the particular cell type being targeted.
Acknowledgments
ACKNOWLEDGEMENTS
We thank Dr Serge Moreau and Mrs Justine Michel, from our laboratory, for the chemical synthesis of oligonucleotides. We thank Drs Robert Crouch and Hiro Yamada (NICHD, NIH, Bethesda, MD) for the gift of recombinant human RNase HII and Dr Peter Frank (University of Vienna, Austria) for the gift of ribonuclease HI from calf thymus.
REFERENCES
- 1.Hausen P. and Stein,H. (1970) Eur. J. Biochem., 14, 278–283. [DOI] [PubMed] [Google Scholar]
- 2.Miller H.I., Riggs,A.D. and Gill,G.N. (1973) J. Biol. Chem., 248, 2621–2624. [PubMed] [Google Scholar]
- 3.Moelling K., Bolognesi,D.P., Bauer,H., Büsen,W., Plassman,H.W. and Hausen,P. (1971) Nature New Biol., 234, 240–243. [DOI] [PubMed] [Google Scholar]
- 4.Hughes S.H., Arnold,E. and Hostomsky,Z. (1998) In Crouch,R.J. and Toulmé,J.J. (eds), Ribonucleases H. John Libbey, Paris, pp. 195–224.
- 5.Kogoma T. and Foster,P.L. (1998) In Crouch,R.J. and Toulmé,J.J. (eds), Ribonucleases H. John Libbey, Paris, pp. 39–66.
- 6.Büsen W. and Hausen,P. (1975) Eur. J. Biochem., 52, 179–190. [DOI] [PubMed] [Google Scholar]
- 7.Büsen W. and Frank,P. (1998) In Crouch,R.J. and Toulmé,J.J. (eds), Ribonucleases H. John Libbey, Paris, pp. 113–146.
- 8.Frank P., Braunshofer-Reiter,C., Poltl,A. and Holzmann,K. (1998) Biol. Chem., 379, 1407–1412. [DOI] [PubMed] [Google Scholar]
- 9.Frank P., Braunshofer-Reiter,C., Wintersberger,U., Grimm,R. and Busen,W. (1998) Proc. Natl Acad. Sci. USA, 95, 12872–12877. [DOI] [PMC free article] [PubMed] [Google Scholar]
- 10.Cerritelli S.M. and Crouch,R.J. (1998) Genomics, 53, 300–307. [DOI] [PubMed] [Google Scholar]
- 11.Toulmé J.J. and Tidd,D. (1998) In Crouch,R.J. and Toulmé,J.J. (eds), Ribonucleases H. John Libbey, Paris, pp. 225–250.
- 12.Branch A.D. (1998) Trends Biochem. Sci., 23, 45–50. [DOI] [PubMed] [Google Scholar]
- 13.Larrouy B., Blonski,C., Boiziau,C., Stuer,M., Moreau,S., Shire,D. and Toulmé,J.J. (1992) Gene, 121, 189–194. [DOI] [PubMed] [Google Scholar]
- 14.Cazenave C., Frank,P., Toulmé,J.J. and Büsen,W. (1994) J. Biol. Chem., 269, 25185–25192. [PubMed] [Google Scholar]
- 15.Sambrook J., Fritsch,E.F. and Maniatis,T. (1989) Molecular Cloning: A Laboratory Manual, 2nd Edn. Cold Spring Harbor Laboratory Press, Cold Spring Harbor, New York, NY.
- 16.Puglisi J.D. and Tinoco,I.,Jr (1989) Methods Enzymol., 180, 304–325. [DOI] [PubMed] [Google Scholar]
- 17.Cazenave C., Frank,P. and Büsen,W. (1993) Biochimie, 75, 113–122. [DOI] [PubMed] [Google Scholar]
- 18.Brun G., Vannier,P., Scovassi,I. and Callen,J.C. (1981) Eur. J. Biochem., 118, 407–415. [DOI] [PubMed] [Google Scholar]
- 19.Lowry O.H., Rosebrough,N.J., Farr,A.L. and Randall,R.J. (1951) J. Biol. Chem., 193, 265–275. [PubMed] [Google Scholar]
- 20.Bradford M.M. (1976) Anal. Biochem., 72, 248–254. [DOI] [PubMed] [Google Scholar]
- 21.Rossmanith W., Tullo,A., Potuschak,T., Karwan,R. and Sbisa,E. (1995) J. Biol. Chem., 270, 12885–12891. [DOI] [PubMed] [Google Scholar]
- 22.Frank P., Cazenave,C., Albert,S. and Toulmé,J.J. (1993) Biochem. Biophys. Res. Commun., 196, 1552–1557. [DOI] [PubMed] [Google Scholar]
- 23.Büsen W. (1980) J. Biol. Chem., 255, 9434–9443. [PubMed] [Google Scholar]
- 24.Eder P.S. and Walder,J.A. (1991) J. Biol. Chem., 266, 6472–6479. [PubMed] [Google Scholar]
- 25.Wu H., Lima,W.F. and Crooke,S.T. (1999) J. Biol. Chem., 274, 28270–28278. [DOI] [PubMed] [Google Scholar]
- 26.Frank P., Albert,S., Cazenave,C. and Toulmé,J.J. (1994) Nucleic Acids Res., 22, 5247–5254. [DOI] [PMC free article] [PubMed] [Google Scholar]
- 27.Lima W.F. and Crooke,S.T. (1997) J. Biol. Chem., 272, 27513–27516. [DOI] [PubMed] [Google Scholar]
- 28.Sawai Y., Kitahara,N., Thuong,W.L., Yanokura,M. and Tsukada,K. (1981) J. Biochem. (Tokyo), 90, 11–16. [DOI] [PubMed] [Google Scholar]
- 29.Robbins I. and Lebleu,B. (2000) Methods Enzymol., 313, 189–203. [DOI] [PubMed] [Google Scholar]
- 30.Gold L., Polisky,B., Uhlenbeck,O. and Yarus,M. (1995) Annu. Rev. Biochem., 64, 763–797. [DOI] [PubMed] [Google Scholar]
- 31.Toulmé J.J. (2000) Curr. Opin. Mol. Therap., 2, 318–324. [PubMed] [Google Scholar]
- 32.Crouch R.J. and Dirksen,M.L. (1982) In Linn,S.M. and Roberts,R.J. (eds), Nucleases. Cold Spring Harbor Laboratory Press, Cold Spring Harbor, New York, NY, pp. 211–241.