Abstract
Background
Mood disorders have been associated with risk of clinical relapses in multiple sclerosis (MS), a demyelinating disease mediated by myelin-specific T cells.
Objectives
We aimed to investigate the impact of major depressive disorder (MDD) and cytokine profile of T-cells in relapsing remitting MS patients.
Methods
For our study, plasma and PBMC were obtained from 60 MS patients (30 with lifetime MDD) in remission phase. The PBMC cultures were stimulated with anti-CD3/anti-CD28 beads or myelin basic protein (MBP), and effector and regulatory T cell phenotypes were determined by flow cytometry. The cytokine levels, both in the plasma or in the supernatants collected from PBMC cultures, were quantified by Luminex. In some experiments, the effect of serotonin (5-HT) was investigated.
Results
Here, higher Th17-related cytokine levels in response to anti-CD3/anti-CD28 and MBP were quantified in the plasma and PBMC cultures of the MS/MDD group in comparison with MS patients. Further, elevated frequency of CD4+ and CD8+ T cells capable of producing IL-17, IL-22 and GM-CSF was observed in depressed patients. Interestingly, the percentage of myelin-specific IFN-γ+IL-17+ and IFN-γ+GM-CSF+ CD4+ T cells directly correlated with neurological disabilities. In contrast, the occurrence of MDD reduced the proportion of MBP-specific CD39+Tregs subsets. Notably, the severity of both neurological disorder and depressive symptoms inversely correlated with these Tregs. Finally, the addition of 5-HT downregulated the release of Th17-related cytokines in response to anti-CD3/anti-CD28 and myelin antigen.
Conclusions
In summary, our findings suggested that recurrent major depression, by favoring imbalances of effector Th17 and Treg cell subsets, contributes to MS severity.
Supplementary Information
The online version contains supplementary material available at 10.1007/s00018-022-04315-0.
Keywords: Major depressive disorder, Multiple sclerosis, Th17 cells, Treg, CD39, Serotonin
Introduction
Relapse-remitting multiple sclerosis (RRMS) is a chronic inflammatory demyelinating autoimmune disorder of the central nervous system (CNS) mediated by myelin-specific T cells that attack the myelin sheath of any area of the CNS, leading to sensory, autonomic, cognitive, and motor function deficits [1, 2]. Like other autoimmune conditions, the multiple sclerosis (MS) outcome may be influenced by environmental or mental health conditions, such as major depressive disorder (MDD).
Lifetime prevalence of depression is at least three times higher in RRMS patients than in general population [3, 4], and mood disorders have been associated with risk of clinical relapses [5]. Moreover, besides the disease is characterized by increased physical disability over time [6], some symptoms, such as fatigue and cognitive impairment, are also commonly associated with depression [7–9].
It is known that MDD is associated with elevated levels of circulating pro-inflammatory cytokines, such as IL-1β, IL-6 and tumor necrosis factor (TNF)-α [10], and lower availability of serotonin (5-HT) [11]. Apart from its role in regulating mood, cognition, sleep and appetite, this neurotransmitter plays immunomodulatory roles on T cells [12], the main lymphocytes that coordinate myelin sheath damage in MS.
Evidence has suggested a pivotal role of different myelin-specific Th17 cell subsets in RRMS pathogenesis, mainly those able to produce interleukin (IL)-17 along with interferon (IFN)-γ [13–18]. High levels of IL-17A (IL-17), associated with increased frequency of Th17 cells, have been observed in patients during clinical relapses [13–15]. The proportion of myelin-specific Th17 cells was also associated with radiological activity of the disease [16]. Furthermore, IFN-γ+ (CD8+ and CD4+) T-cells have been detected in both cerebrospinal cord fluid (CSF) and around the apoptotic oligodendrocyte [19, 20]. In addition to IL-17 and IFN-γ, some pathogenic Th1/Th17 cell subsets in RRMS have been associated with production of granulocyte–macrophage colony-stimulating factor (GM-CSF). Rasouli et al. demonstrated a higher production of GM-CSF by peripheral T cells from untreated RRMS and elevated frequency of GM-CSF-secreting (CD4+ and CD8+) T cells co-expressing IL-17 or IFN-γ in their brain lesions [21]. Finally, IL-22, released by activated Th17 or Th22 cells [15], has also been implicated in the disease. A study published by our group demonstrated a direct correlation between the number of active brain lesions and the proportion of IL-22+CD4+T cells in response to myelin basic protein (MBP) [16], one of the antigens believed to induce the T-cells implicated in the process of demyelination of nerves in the CNS [22]. A study by Rolla et al. demonstrated an increase of myelin-specific Th22 cells just prior to clinical relapses in RRMS patients [23]. It is believed that those myelin-specific T cell-derived cytokines, by activating local (microglia) and migrating (monocytes) innate immunity cells, should lead to oligodendrocyte apoptosis and break down of both the BBB and the myelin sheath through releasing of cytotoxic mediators, such as reactive oxygen intermediates and matrix metalloproteinases (MMPs) [24].
In addition to expanded effector pathogenic T cells, functional deficiencies of CD25high FoxP3+ regulatory CD4+T-cells (Tregs) and Tr1 cells (IL-10+FoxP3−) have also been described in RRMS patients during clinical relapses [25–28]. In addition to producing anti-inflammatory cytokines, such as IL-10, the high expression of CD25 by Tregs may reduce effector T cell action by taking up exogenous IL-2 [29]. Moreover, the expression of CD152 on Tregs, by blocking costimulatory molecules CD80 and CD86 expressed on immunogenic dendritic cells (DCs), may, indirectly contribute to controlling the inflammation by inhibiting effector pathogenic T cells [29]. More recently, lower frequency of CD39+Tregs was observed in non-depressed MS patients when compared with healthy subjects [28]. CD39 degrades the extracellular adenosine triphosphate (ATP)/adenosine diphosphate (ADP) into adenosine monophosphate (AMP) that is then hydrolyzed, by CD73, to adenosine (ADO), a metabolite which inhibits effector T cells via the adenosine receptor A2A (A2AR) [30–32]. Despite these findings, little is known about the impact of MDD and the effect of serotonin on the in vitro MS-derived T cell behavior in response to anti-CD3/anti-CD28 beads and myelin antigen, which was the objective of the present study.
Material and methods
Patients
For this study, 60 RRMS patients, diagnosed according to the McDonald criteria (2010), were recruited from January 2017 to June 2021 from Gafrée Guinle University Hospital/UNIRIO (Rio de Janeiro, Brazil) during remission phase. Half of the patients suffered from persistent major depression (MS/MDD). At the time of blood sampling, the severity of depressive symptoms was evaluated by Beck depression inventory (BDI) and neurological disabilities determined through the expanded disability status scale (EDSS) [33]. Demographic data, such as gender, disease duration, and treatment with disease modifying therapies (DMTs) were obtained from medical records (Table 1). To avoid confounding factors related to depression associated with neurodegeneration, no patients recruited presents EDSS ≥ 6. Patients that were treated with interferon were excluded, due to the association of this treatment with depression [4]. We also excluded MS patients with other autoimmune disorders. For some experiments, 30 non-MS, age and sex matched individuals, 15 without (Control, Ctlr) and 15 with MDD, were also recruited. Those undergoing treatment with antidepressants and anxiolytics, smokers and those with acute infectious diseases were excluded from both MS and non-MS groups. After a complete description of the study to participants, written informed consent was obtained from each individual. The study was approved by the Ethics Committee for Research on Human Subjects of the Federal University of the State of Rio de Janeiro (UNIRIO).
Table 1.
Demographic and clinical features of MS patients
| Patients | ||
|---|---|---|
| MSa | MS/MDDb | |
| N° of subjects (n) | 30 | 30 |
| Gender, female/male (n) | 18/12 | 20/10 |
| Age [(years), mean ± SD] | 36.3 ± 11.8 | 35.8 ± 10.7 |
| Disease duration [(years), mean ± SD) | 6.5 ± 5.9 | 7.1 ± 6.1 |
| BDI (mean ± SD) | 5.0 ± 2.8 | 22.7 ± 8.1 |
| EDSS [median (range)] | 1.5 (0–5.5) | 2.5 (0–5.5) |
| Treatment with DMT [n (%)] | 20 (67) | 23 (77) |
Data from relapsing–remitting multiple sclerosis (RRMS)
BDI beck depression inventory (BDI), EDSS, expanded disability status scale, DMT disease-modifying therapy
aWithout (MS) or
bWith (MS/MDD) major depressive disorder (MDD) in clinical remission phase. Age (years) refers to age when the blood samples and clinical information were collected. Disease duration refers to the number of years since disease onset
Cell cultures and stimuli
Peripheral blood was collected from participants in heparin-containing tubes, and both plasma and peripheral blood mononuclear cells (PBMC) were obtained by centrifugation on Ficoll–Hypaque density gradients (Fig. 1). After counting cells in trypan blue solution (10% v/v), viable PBMC (1 × 10⁶/mL) were suspended in RPMI-1640 medium supplemented with 2 μM of L-glutamine (GIBCO, Carlsbad, CA, USA), 10% fetal calf serum (FCS), 20 U/mL of penicillin, 20 μg/mL of streptomycin and 20 mM of HEPES buffer. To evaluate the antigen (Ag)-specific response, some cell cultures were stimulated with 10 µg/mL of myelin basic protein (MBP) (Sigma Chemicals, St Louis, MD) plus 20 U/mL of human recombinant IL-2 for 5 days [16]. As positive control, the cells were cultured in 24-well plates for 3 days in the absence of stimulus (medium alone) or in the presence of anti-CD3/anti-CD28 beads (25 μl/mL) (Dynalbeads, Gibco, Grand Island, NY) (Fig. 1). In some experiments, PBMC cultures were treated with 200 ng/mL of 5-HT (Fig. 1). The dose of serotonin used here was based on the study performed by Soga et al. and represents the physiological brain concentration of this neurotransmitter [34, 35]. The cell cultures were maintained at 37° in a humidified 5% CO2 incubator during incubation.
Fig. 1.
Experimental workflow of the in vivo (plasma) and in vitro (PBMC) assays. Plasma and PBMC from subjects were obtained by peripheral blood centrifugation on Ficoll–Hypaque density gradients. The plasmas were submitted to cytokine analysis through Luminex. The PBMC cultures were stimulated for 3 days or 5 days with anti-CD3/anti-CD28 (α-CD3/α-CD28) beads or MBP/hrIL-2, respectively. In some wells, the 5-HT was added. The content of cytokines in the supernatants from those PBMC cultures was determined by Luminex. The T cells phenotypes were determined by cytometry after activating PBMC cultures with PMA/Ionomycin for 3 h
Flow cytometry analysis
To determine the frequency of different effector and regulatory T cell subsets, mouse anti-human monoclonal antibodies (mAbs) directed against surface (CD3-SB436, CD4-SB600, CD8-SB702, CD25APC, CD39-FITC, and CD152-APC-eFluor780) and intracellular (IL-17-PE-eFluor 610, IFN-γ-APC-eFluor780, GM-CSF-PerCP-Cy5.5, IL-22-FITC, IL-10-PE-Cy7, FoxP3-PECy5.5 and CD152-APC-eFluor 780) markers, as well as isotype control antibodies, were purchased from eBioscence™ (Thermo Fischer Scientific). To optimize intracellular cytokine detection, at the end of the incubation period, cell cultures were restimulated for 3 h with phorbol 12-myristate 13-acetate (PMA, 20 ng/mL; Sigma-Aldrich) plus ionomycin (IO, 600 ng/mL; Sigma-Aldrich) in the presence of brefeldin A (10 μg/mL; Sigma-Aldrich) (Fig. 1). Briefly, the PBMC were incubated with different mAbs combinations for surface markers at room temperature in the dark, according to manufacturer’s instructions. After 30 min, the cells were washed with PBS + 2%FBS at room temperature before cell permeabilization, that was performed by incubating cells at 4 °C for 20 min with Cytofix/Cytoperm solution (BD Pharmigen, San Diego, CA). After washing, the different combinations of mAbs against intracellular makers were added and incubated for a further 30 min at 4 °C. The cells were acquired on Attune NxT flow cytometers (Thermo Fisher Corporation) and analyzed using FlowJo. Isotype control antibodies and single-stained samples were used to periodically check the settings and gates on the flow cytometer. After acquisition of 200,000–250,000 events, lymphocytes were gated based on forward and side scatter properties after the exclusion of dead cells, using propidium iodide [PI+ cells mean: 4.31% (range 1.3–8.7%)], and doublets.
In vivo and in vitro cytokine production quantification
The quantification of different cytokines in plasma and in supernatants from polyclonal and myelin-specific activated cells was determined applying the Luminex technique, and using the “Th1/Th2/Th9/Th17 Cytokine 18-plex human Panel” kit (InvitroGen, San Diego, CA, USA), following manufacturer’s instructions.
Statistical analysis
The statistical analysis was performed using Prism 8.0 software (GraphPad Software). All immunological evaluations were performed in triplicate for each individual and the intra-assay variability ranged from 9.2 to 13.1% (median value of 10.3%) as calculated by the software above. Comparisons between immune assays in the cell cultures from the three different groups were performed with ANOVA followed by Turkey test for data with Gaussian distribution and the Kruskal–Wallis followed by Dunn’s test for data without Gaussian distribution. Also, the results were corrected by Bonferroni. The nonparametric Mann–Whitney U test and the Student’s t test were applied to determine whether the two groups were statistically different for nonparametric and parametric variables, respectively. Correlations between parametric and nonparametric variables were investigated using Pearson’s and Spearman’s correlations, respectively. Significance in all experiments was p < 0.05.
Results
The occurrence of major depression favors the release of Th17-related cytokines implicated in MS activity and depression severity
For the present study, 60 RRMS patients, 30 with (MS/MDD) and 30 without (MS) major depressive disorder (MDD), were recruited. No difference in age or sex was observed between the two groups, and mean disease duration and EDSS score were similar (Table 1). Concerning the DMT scheme, some patients were under treatment with natalizumab (7 MS × 8 MS/MDD), glatiramer acetate (7 MS × 7 MS/MDD), dymetil fumarate (4 MS × 6 MS/MDD) and teriflunomide (2 MS × 2 MS/MDD). No statistical difference was observed with regard to immunological assays between patients under different DMT schemes (data not shown). The severity of depressive symptoms was classified into mild (n = 12, 40%), moderate (n = 8, 27%) and severe (n = 10, 33%) according to BDI.
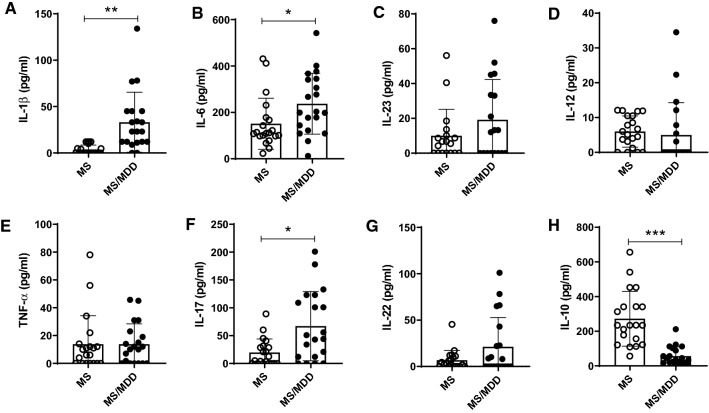
It is known that both MDD and MS involve imbalances in cytokine production [10, 19]. With regard to the in vivo cytokine profile, higher levels of IL-1β (Fig. 2A), IL-6 (Fig. 2B) and IL-17 (Fig. 2F), associated with a lower concentration of IL-10 (Fig. 2H), were observed in the plasma of MS/MDD patients when compared with the MS group. No difference between the two patient groups was observed for IL-23 (Fig. 2C), IL-12 (Fig. 2D), TNF-α (Fig. 2E) and IL-22 (Fig. 2G). Concerning neurological disorders, a positive correlation was observed between EDSS score and the circulating levels of IL-1β, IL-6, IL-23, IL-12, TNFα and IL-17 (Table 2). Also, the severity of depressive symptoms, evaluated using the BDI scale, directly correlated with plasma levels of IL-1β and IL-17 and inversely correlated to IL-10 concentrations (Table 2). As control for MDD, the cytokine profile of 30 age- and gender-matched non-MS subjects (15 healthy and 15 with MDD) was also evaluated. As demonstrated in figure S1A, the occurrence of depression indeed elevated plasma levels of IL-1β and TNF-α (Fig. S1A).
Fig. 2.
Impact of MDD on circulating levels of cytokines in patients with MS. The levels of (A) IL-1β, (B) IL-6, (C) IL-23, (D) IL-12, (E) TNF-α, (F) IL-17, (G) IL-22, and (H) IL-10 were quantified in the plasma of MS patients with (MS/MDD, n = 20) or without MDD (MS, n = 20) major depression by Luminex. Data are shown as mean ± SD of 2 independent experiments with 10 MS and 10 MS/MDD samples (plasma) per experiment. Significance was calculated by comparing MS versus MS/MDD and the p values (*p < 0.05, **p < 0.001, and ***p < 0.0001) are indicated in the figure
Table 2.
Correlation between the levels of plasma cytokines with neurological disabilities and severity of depressive symptoms
| Cytokines (pg/mL) | MS patients | |||
|---|---|---|---|---|
| EDSS | BDI | |||
| r | p | r | p | |
| IL-1β | 0.5192 | 0.0023 | 0.5604 | 0.0008 |
| IL-6 | 0.443 | 0.0111 | 0.377 | 0.334 |
| IL-23 | 0.4401 | 0.0117 | 0.2429 | 0.1804 |
| IL-12 | 0.7784 | < 0.0001 | 0.2121 | 0.3539 |
| TNF-α | 0.5115 | 0.0028 | 0.0105 | 0.9542 |
| IL-17 | 0.5874 | 0.0004 | 0.3929 | 0.0261 |
| IL-22 | 0.2918 | 0.1052 | 0.2486 | 0.1701 |
| IL-10 | − 0.2533 | 0.1619 | − 0.7089 | < 0.0001 |
Bold values are statistically significant (p < 0.05)
The levels of circulating cytokines were determined by Luminex
EDSS expanded disability status scale, BDI beck depression inventory (BDI)
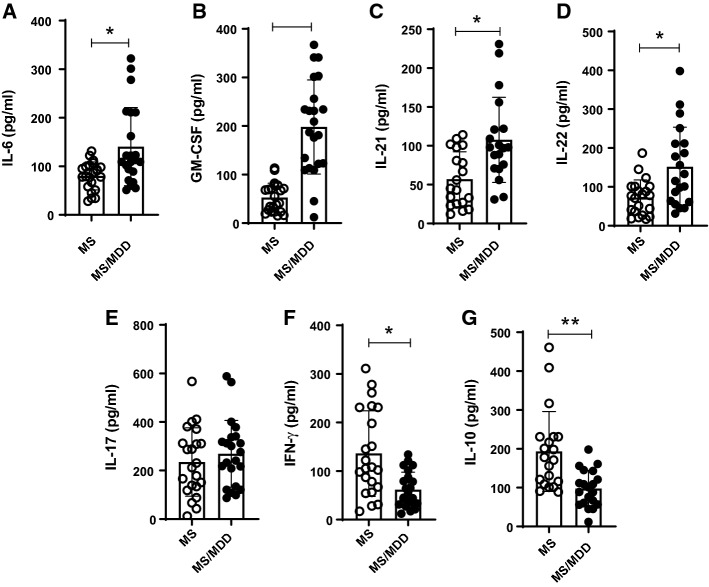
In order to evaluate the impact of depression on cytokine profile by MS-derived T-lymphocytes, PBMC cultures were stimulated with anti-CD3/anti-CD28 or major basic protein (MBP). As demonstrated in the (Fig. S2), higher levels of IL-6 and IL-17 (Fig. S2A, B) were quantified PBMC cultures containing polyclonally-activated T cells from depressed patients. In contrast, lower levels of IFN-γ and IL-10 (Fig. S2G, H) were detected in those MDD/MS cell cultures. In non-MS subjects, elevated levels of IL-6, TNF-α, GM-CSF and IL-17 and were also produced by MDD-derived PBMC cultures containing anti-CD3/anti-CD28-activated T cells as compared with healthy subjects (control, Ctrl) (Fig. S1). In addition, the occurrence of depression diminished IFN-γ production (Fig. S1). With regard to antigen-specific response, higher levels of IL-6, GM-CSF, IL-21 and IL-22 (Fig. 3A–D) were noted in the supernatants from MBP/IL-2-activated cell cultures of depressive patients. On the other hand, those MS/MDD cell cultures released lower amounts of IFN-γ and IL-10 (Fig. 3F, G). Of note, neither medium (none) nor IL-2 alone was able to induce detectable cytokines (data not shown).
Fig. 3.
The impact of major depression on cytokine production by MS-derived PBMC in response to myelin antigen. PBMC (1 × 10⁶/mL), from MS patients without (MS, n = 22) or with (MS/MDD, n = 22) were stimulated for 5 days with MBP/IL-2. In (A–G), the cytokine was evaluated by Luminex. Data are shown as mean ± SD of 8 independent experiments with 1–3 samples per experiment from each group of patients. Significance was calculated by comparing MS and MS/MDD and the p values (*p < 0.05, **p < 0.001, and ***p < 0.0001) are indicated in the figure
Concerning clinical parameters, IL-17 and GM-CSF levels in anti-CD3/anti-CD28-stimulated cell cultures were positively associated with neurological disabilities (Table 3). The same correlation was observed between IL-6, released by MBP/IL-2-activated cell cultures, and the EDSS score (Table 3). Also, a direct correlation was observed between the severity of depressive symptoms and IL-6 and IL-17, produced by anti-CD3/anti-CD28-activated cells, and IL-6, IL-17, IL-21, IL-22 and GM-CSF, released by Ag-specific cells (Table 3). In contrast, a higher BDI score inversely correlated with IL-10 and IFN-γ produced by anti-CD3/anti-CD28- and MBP-stimulated cell cultures (Table 3).
Table 3.
Correlation between in vitro cytokine production and clinical parameters in MS patients
| Cytokine (pg/mL) | MS patients | |||
|---|---|---|---|---|
| EDSS | BDI | |||
| r | p | r | p | |
| αCD3/CD28 | ||||
| IL-6 | 0.2146 | 0.2089 | 0.6105 | < 0.0001 |
| IL-10 | − 0.3109 | 0.0611 | − 0.5211 | 0.0009 |
| IL-17 | 0.5573 | 0.0003 | 0.3493 | 0.0341 |
| IL-21 | 0.2863 | 0.0858 | − 0.2323 | 0.1666 |
| IL-22 | 0.037 | 0.542 | − 0.0296 | 0.9131 |
| TNF-α | 0.2122 | 0.2074 | 0.1937 | 0.2507 |
| IFN-γ | -0.087 | 0.6086 | − 0.7147 | < 0.0001 |
| GM-CSF | 0.4448 | 0.0058 | 0.1564 | 0.3553 |
| MBP + IL-2 | ||||
| IL-6 | 0.3298 | 0.0568 | 0.5197 | 0.0016 |
| IL-10 | − 0.1744 | 0.3239 | − 0.5847 | 0.0003 |
| IL-17 | 0.1573 | 0.3821 | 0.3647 | 0.0369 |
| IL-21 | 0.1147 | 0.5183 | 0.5120 | 0.002 |
| IL-22 | 0.3027 | 0.0818 | 0.5458 | 0.0008 |
| GM-CSF | 0.3313 | 0.0556 | 0.7892 | < 0.0001 |
| IFN-γ | 0.1858 | 0.3257 | − 0.5038 | 0.0045 |
Bold values are statistically significant (p < 0.05)
The levels of cytokine released by anti-CD3/anti-CD28-activated and myelin antigen-stimulated PBMC cultures were determined by Luminex
EDSS expanded disability status scale, BDI beck depression inventory (BDI)
The impact of major depression on the frequency of cytokine-producing CD4+ and CD8+T cell subsets in MS patients
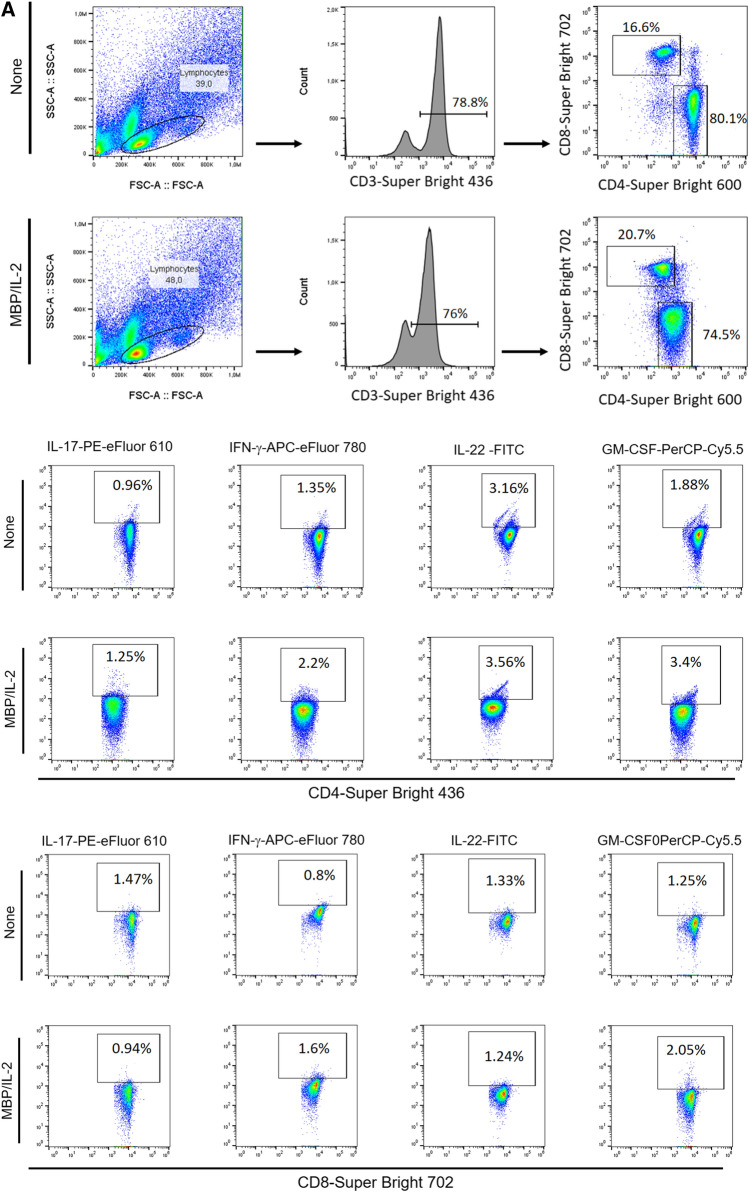
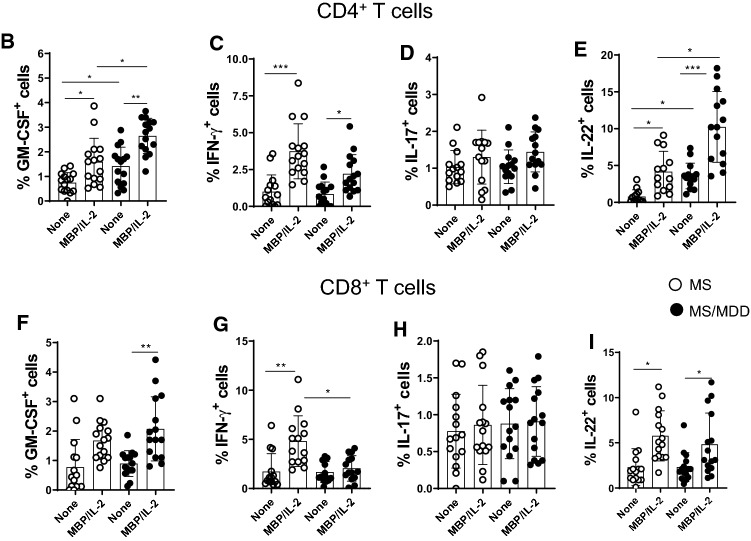
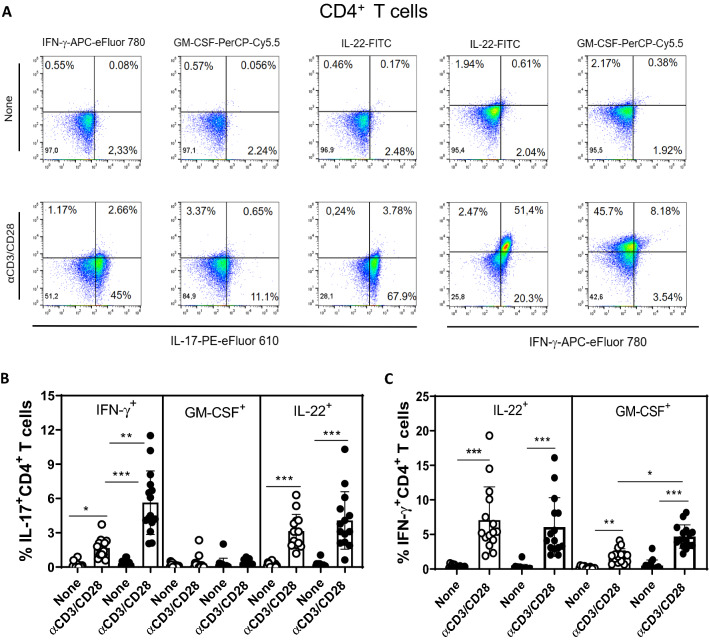
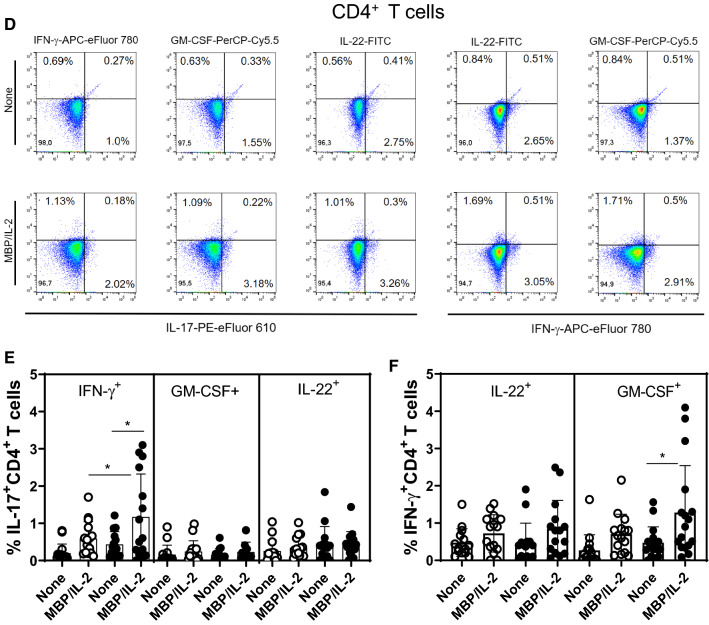
Evidence suggests that myelin-specific CD4+ and CD8+T cells that are able to produce IL-17, IFN-γ, IL-22 and GM-CSF play a pivotal role in MS pathogenesis [16, 17, 19, 20, 23, 36, 37]. In order to assess the impact of depression on the frequency of these cells by flow cytometry, PBMC cultures from MS patients were stimulated with MBP. As positive control, the same cytokines were evaluated after T cell activation with anti-CD3/CD28 beads. Following the gating strategy shown in Fig. 3SA. Among the cytokines-producing T cells in response to anti-CD3/anti-CD28 beads, the proportion of IL-17+CD4+ (Fig. 3SD) and IL-17+CD8+ (Fig. 3SH) T cells was significantly higher in the MDD group. With regard to Ag-specific response, and taking into account the gating strategy shown in Fig. 4A, the percentage of myelin-specific GM-CSF+ (Fig. 4B) and IL-22+ (Fig. 4E) CD4+T cells was significantly higher in MDD group. Interestingly, even in the absence of stimulus, the proportion of those CD4+T cell subsets after 5 days of culturing was significantly higher in MS/MDD patients (Fig. 4B, E). Among CD8+T-cells, the frequency of IFN-γ+ cells was significantly higher in cell cultures from no depressed patients (Fig. 4G). In contrast, the myelin antigen was capable of elevating the proportion of GM-CSF+CD8+T cells from MS/MDD, but not MS cell cultures (Fig. 4F). MBP/IL-2 stimulation did not alter the IL-17+T cells in both experimental groups (Fig. 4D, H). Interestingly, among all cell phenotypes evaluated here, only the frequency of myelin-specific CD8+T cells positives for IL-17 or IFN-γ directly correlated with EDSS score (Table 4).
Fig. 4.
Influence of major depression on the proportion of myelin-specific T cells in MS patients. Applying the gating strategy shown in figure A, the mean proportion of CD4+ and CD8+ T cells positive for (B) GM-CSF, (C) IFN-γ, (D) IL-17 and (E) IL-22 in PBMC (1 × 10⁶/mL) cultures from depressed (MS/MDD, n = 15) and non-depressed (MS, n = 15) patients after MBP/IL-2 addition (10 µg/mL). Data are shown as mean ± SD of 9 independent experiments with 1–3 samples per experiment from each group of patients. Significance was calculated by comparing MS and MS/MDD patients and the p values (*p < 0.05, **p < 0.001, and ***p < 0.0001) are indicated in the figure
Table 4.
The correlation between cytokine-producing CD4+ and CD8+ T cells with severity of neurological disabilities and depressive symptoms
| Cytokine expression (%) | αCD3/CD28 | MBP/IL-2 | ||||||
|---|---|---|---|---|---|---|---|---|
| EDSS | BDI | EDSS | BDI | |||||
| r | p | r | p | r | p | r | p | |
| CD4+ T cells | ||||||||
| IL-17+ | − 0.1832 | 0.4781 | − 0.027 | 0.9189 | 0.3415 | 0.2321 | − 0.207 | 0.4745 |
| IFN-γ+ | 0.1979 | 0.4588 | 0.2209 | 0.4081 | 0.1246 | 0.6424 | − 0.4321 | 0.0647 |
| GM-CSF+ | − 0.1457 | 0.6322 | − 0.0219 | 0.9493 | − 0.1862 | 0.5239 | 0.0285 | 0.9276 |
| IL-22+ | − 0.045 | 0.8734 | − 0.1737 | 0.5331 | − 0.3825 | 0.1297 | − 0.4295 | 0.1262 |
| CD8+ T cells | ||||||||
| IL-17+ | − 0.2119 | 0.4109 | 0.1314 | 0.6130 | 0.597 | 0.0211 | − 0.0088 | 0.9750 |
| IFN-γ+ | 0.0329 | 0.9042 | 0.0427 | 0.8757 | 0.4875 | 0.0293 | − 0.2474 | 0.3529 |
| GM-CSF+ | − 0.1075 | 0.7266 | − 0.2795 | 0.3551 | 0.2369 | 0.4112 | − 0.1385 | 0.6375 |
| IL-22+ | − 0.136 | 0.6290 | − 0.188 | 0.4994 | − 0.3337 | 0.2437 | − 0.3987 | 0.1580 |
Bold values are statistically significant (p < 0.05)
The frequency of CD4+ and CD8+ T cells positives for IL-17, IFN-γ, GM-CSF and IL-22 was determined by flow cytometry after PBMC cell cultures activation with anti-CD3/anti-CD28 beads (αCD3/CD28) or MBP/IL-2
EDSS expanded disability status scale, BDI beck depression inventory (BDI)
When the combination of different cytokines was analyzed (Fig. 5A), the frequency of IL-17+IFN-γ+ (Fig. 5B) and IFN-γ+GM-CSF+ (Fig. 5C) CD4+T cells in response to anti-CD3/anti-CD28 beads was higher in MS/MDD than MS cultures. In MBP/IL-2-stimulated cell cultures, the proportion of IL-17+IFN-γ+CD4+T cells (Fig. 5E) was significantly higher in depressed MS patients. Further, myelin antigen was capable to up regulate the proportion of IFN-γ+GM-CSF+CD4+T cells only in cell cultures from depressed patients (Fig. 5F)
Fig. 5.
The impact of major depression on the frequency of multi-cytokine-secreting CD4+ T cells from MS patients. PBMC (1 × 10⁶/mL), from depressed (MS/MDD, n = 15) and non-depressed (MS, n = 15) patients, were cultured for 3 days in the presence of anti-CD3/anti-CD28 beads (A–C) or for 5 days with MPB/IL-2 (D–F). After acquisition of 250,000 events, and following the gating strategy shown in figures A, D, the mean percentage of anti-CD3/anti-CD28- and MBP-stimulated CD4+ T cell subsets dual positive for IL-17+INF-γ+, IL-17+GM-CSF+ and IL-17+IL-22+ (B, E) or for IFN-γ+IL-22+ and IFN-γ+GM-CSF+ (C, F) was determined. Data are shown as mean ± SD of 9 independent experiments with 1 to 3 samples per experiment from each group of patients. Significance was calculated by comparing MS versus MS/MDD and the p values (*p < 0.05, **p < 0.001, and ***p < 0.0001) are indicated in the figure
Further, the frequency of MBP-specific IFN-γ+IL-17+ and IFN-γ+GM-CSF+CD4+T cells was directly correlated with neurological disabilities of patients (Table 5). Also, patients with a higher EDSS score tended to present a higher percentage of antigen-specific GM-CSF+ IL-17+CD4+T cells (p = 0.0522) (Table 5). Unfortunately, the very low frequency of CD8+T cells able to produce different combinations of cytokines after anti-CD3/anti-CD28 and antigen stimulation made any further analysis impossible.
Table 5.
The correlation between the frequency of multi-cytokine-producing CD4+ and CD8+ T cells with clinical parameters of MS patients
| Cytokine expression (%) | αCD3/CD28 | MBP/IL-2 | ||||||
|---|---|---|---|---|---|---|---|---|
| EDSS | BDI | EDSS | BDI | |||||
| r | p | r | p | r | p | r | p | |
| IL-17+CD4+ T cells | ||||||||
| IFN-γ+ | 0.0548 | 0.8462 | 0.0331 | 0.9001 | 0.4771 | 0.0301 | − 0.0523 | 0.8464 |
| GM-CSF+ | 0.3151 | 0.2377 | 0.1293 | 0.6724 | 0.4007 | 0.0522 | 0.0002 | 0.9999 |
| IL-22+ | 0.0568 | 0.8578 | − 0.3259 | 0.2344 | − 0.3001 | 0.3409 | − 0.2007 | 0.4876 |
| IFN-γ+CD4+ T cells | ||||||||
| IL-22+ | 0.3245 | 0.2773 | − 0.0224 | 0.9372 | − 0.1461 | 0.6527 | − 0.1982 | 0.4939 |
| GM-CSF+ | 0.4087 | 0.2110 | 0.1813 | 0.5537 | 0.7244 | 0.0121 | − 0.0442 | 0.8807 |
Bold values are statistically significant (p < 0.05)
The frequency of IL-17+CD4+ capable of producing IFN-γ, GM-CSF or IL-22, as well as IFN-γ+CD4+ T cells positives for GM-CSF or IL-22 was determined by flow cytometry after PBMC cell cultures activation with anti-CD3/anti-CD28 beads (αCD3/CD28) or MBP/IL-2
EDSS expanded disability status scale, BDI beck depression inventory (BDI)
Lower frequency of regulatory CD39+CD4+T-cell subsets was observed in depressed MS patients
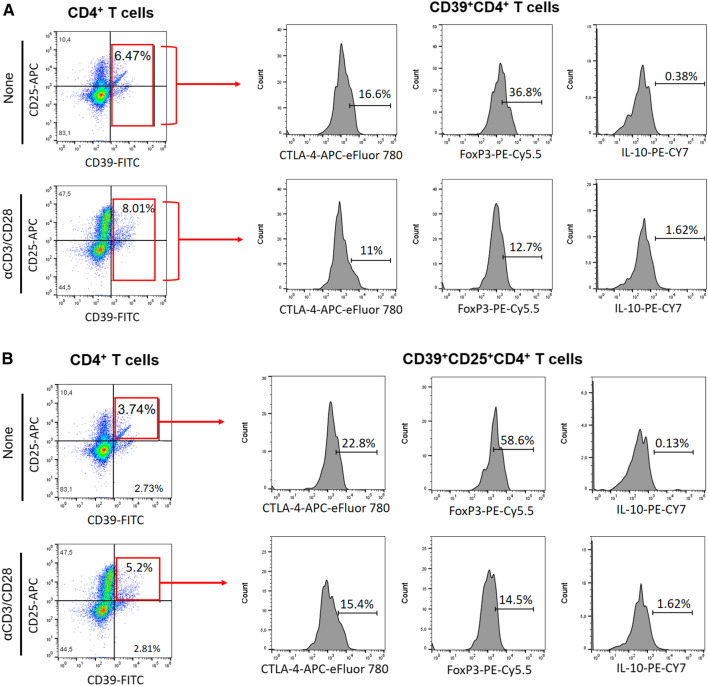
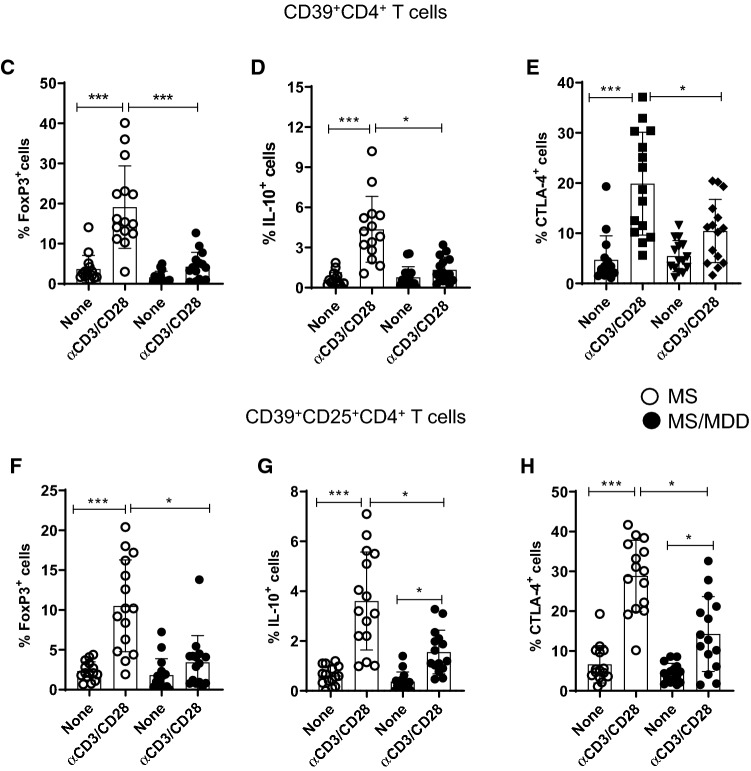
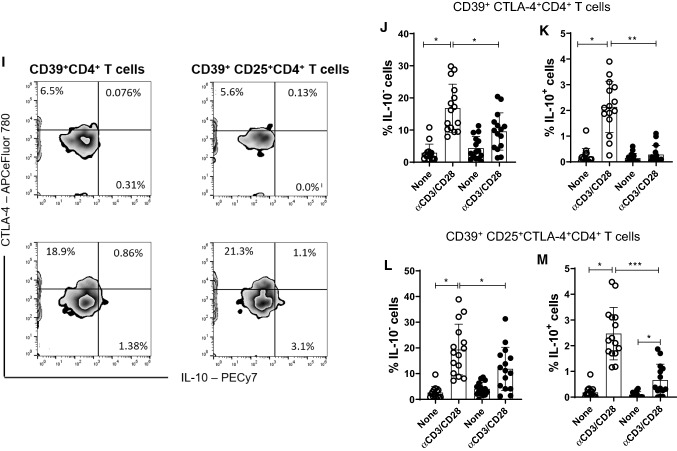
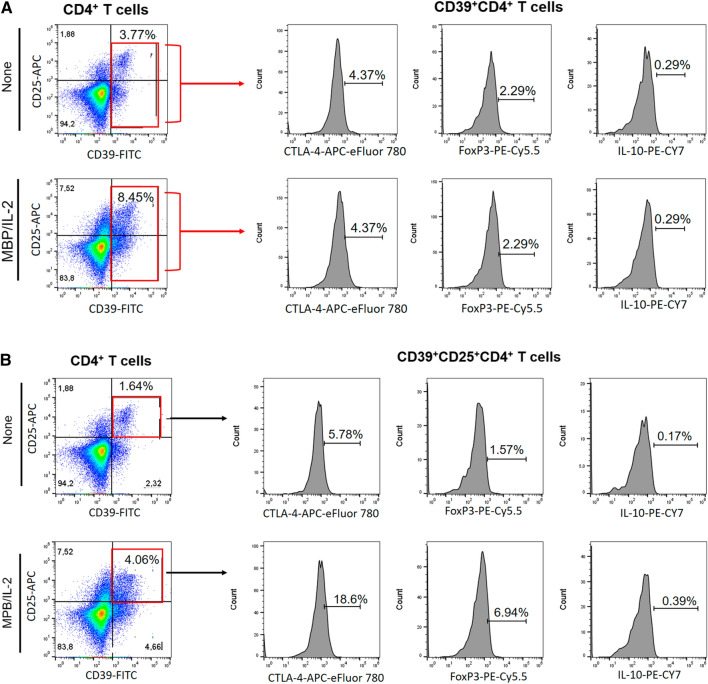
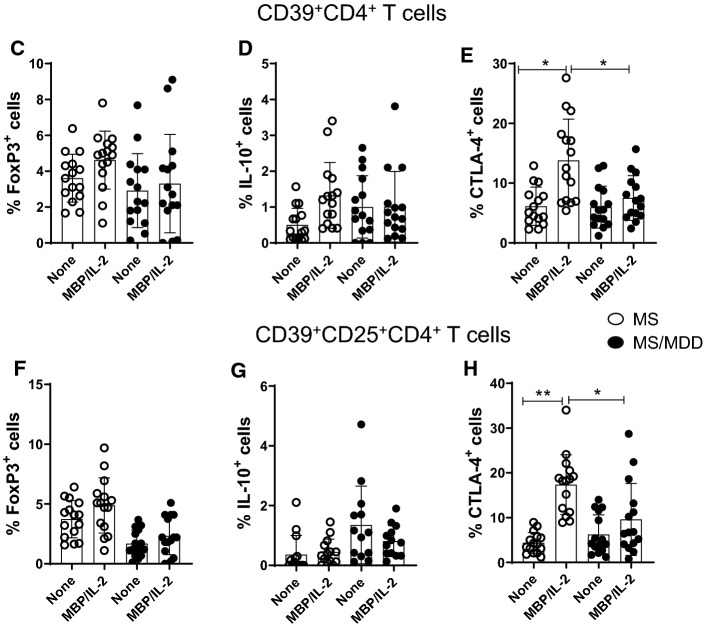
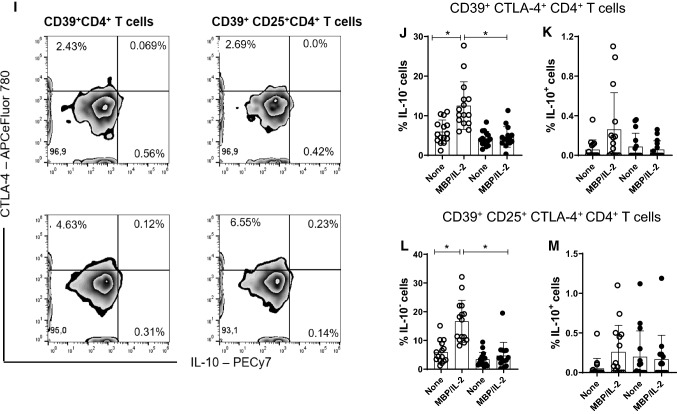
Reduced frequency of CD39+Treg cells has been associated with MS [28]. Here, taking into account the gating strategy shown in Fig. 6a, b, the polyclonal activation of CD4+T cells only increased the percentage of CD39+CD4+T cells capable of expressing FoxP3 and IL-10 in cell cultures from patients without depression (Fig. 6C, D). Similarly, the frequency of CD39+ CD25+CD4+T cells positive for FoxP3 (Fig. 6F) and IL-10 (Fig. 6G) were significantly higher in samples from patients without depression compared to the MDD group. Furthermore, the proportion of CD39+ (Fig. 6E) and CD39+CD25+ (Fig. 6H) cells positive for CTLA-4 among polyclonally-activated CD4+T cells was also significantly higher in the group without depression. Moreover, taking into account the gating strategy shown in Fig. 5I, the proportion of CTLA-4+CD39+ (Fig. 6J, K) and CTLA-4+CD39+CD25+ (Fig. 6L, M) CD4+T cells able to produce, or not, IL-10 was significantly lower in patients with MS/MDD than in patients with only MS. In cultures stimulated with MBP/IL-2, no difference was observed regarding the percentage of CD39+ and CD39+CD25+CD4+T-cells capable of expressing FoxP3 (Figs. 7C, 6F) or IL-10 (Fig. 7D, F) between the two groups of patients. However, the percentage of CTLA-4+IL-10- gated on CD39+ (Fig. 7E, H) or CD39+CD25+ (Fig 7J, L) CD4+T cell subsets after antigen stimulation was significantly higher in patients without depression. The frequency of MBP-specific CTLA-4+IL-10+ was very low with no difference between the groups of patients being observed (Fig. 7K, M). Interestingly, among different regulatory CD4+T cell phenotypes analyzed in the present study, the proportion of CTLA-4+IL-10-CD39+ and CTLA-4+IL-10-CD39+CD25+CD4+T cells, following anti-CD3/anti-CD28 activation or MBP/IL-2 stimulation, was negatively correlated with severity of depressive symptoms (Table 6). Also, the frequency of antigen-specific CD39+CD25+CD4+T cells was negatively correlated with EDSS scores (Table 6).
Fig. 6.
The in vitro frequency of different anti-CD3/anti-CD28-activated CD39+Treg cells in depressed MS patients. PBMC (1 × 10⁶/mL), from depressed (MS/MDD, n = 15) and non-depressed (M, n = 15) patients, were cultured for 3 days in the presence of anti-CD3/anti-CD28 beads. Different CD39+ Treg cell subsets capable of expression of CD25, FoxP3, CTLA-4 and IL-10 were determined by flow cytometry after acquisition of 250,000 events and following the gating strategies shown in figures A, B, I. The mean percentage of anti-CD3/anti-CD28-stimulated CD39+ CD4+ T cell subsets able to co-express (C) FoxP3, (D) IL-10 or (E) CTLA-4, as well as CD39+ CD25+ CD4+ T cells positive for (F) FoxP3, (G) IL-10 or (H) CTLA-4 in the two subgroups of patients, were compared, and the p values indicated in the figure. The mean percentage of CTLA-4+CD39+ and CTLA-4+CD39+CD25+ CD4+ T cells negative (J, L) or positive (J, M) for IL-10 was also determined in MS and MS/MDD patients and compared and the p values (*p < 0.05, **p < 0.001, and ***p < 0.0001) are indicated in the figure. Data are shown as mean ± SD of 9 independent experiments with 1–3 samples per experiment from each group of patients
Fig. 7.
The frequency of different myelin-specific CD39+Treg cells in depressed MS patients. PBMC (1 × 10⁶/mL), from depressed (MS/MDD, n = 15) and non-depressed (MS, n = 15) patients, were cultured for 5 days in the presence of MBP/IL-2. Different CD39+ Treg cell subsets capable of expression of CD25, FoxP3, CTLA-4 and IL-10 was determined by flow cytometry after the acquisition of 250,000 events and following the gating strategies shown in figures A, B, I. The mean percentage of anti-CD3/anti-CD28-stimulated CD39+ CD4+ T cell subsets able to co-express (C) FoxP3, (D) IL-10 or (E) CTLA-4, as well as CD39+ CD25+ CD4+ T cells positive for (F) FoxP3, (G) IL-10 or (H) CTLA-4 in the two patient subgroups were compared and the p values indicated in the figure. The mean percentage of CTLA-4+CD39+ and CTLA-4+CD39+CD25+ CD4+ T cells negative (J, L) or positive (J, M) for IL-10 was also determined in MS and MS/MDD patients and was compared and the p values (*p < 0.05, **p < 0.001, and ***p < 0.0001) are indicated in the figure. Data are shown as mean ± SD of 9 independent experiments with 1–3 samples per experiment from each group of patients
Table 6.
Correlation between different regulatory CD4+ T cell subsets and clinical parameters
| Expression (%) | αCD3/CD28 | MBP/IL-2 | ||||||
|---|---|---|---|---|---|---|---|---|
| EDSS | BDI | EDSS | BDI | |||||
| r | p | r | p | r | p | r | p | |
| CD39+CD4+ T cells | − 0.4187 | 0.0944 | 0.0953 | 0.7133 | − 0.3938 | 0.1628 | − 0.0804 | 0.7825 |
| CTLA-4+IL-10− | 0.0684 | 0.8086 | − 0.533 | 0.0187 | − 0.1605 | 0.5798 | − 0.5176 | 0.0603 |
| CTLA-4+IL-10+ | − 0.2696 | 0.3278 | − 0.2316 | 0.4034 | 0.1627 | 0.5176 | − 0.0374 | 0.8988 |
| CD39+CD25+CD4+ T cells | − 0.3974 | 0.1274 | 0.1939 | 0.4858 | − 0.6579 | 0.0129 | 0.033 | 0.9124 |
| CTLA-4+IL-10− | − 0.2013 | 0.4720 | − 0.5297 | 0.0238 | − 0.0361 | 0.9038 | − 0.5624 | 0.0151 |
| CTLA-4+IL-10+ | − 0.2095 | 0.4497 | − 0.1436 | 0.6074 | 0.0091 | 0.9765 | 0.0601 | 0.8369 |
Bold values are statistically significant (p < 0.05)
The percentage of different CD39+Treg cells was determined by flow cytometry after PBMC cell cultures activation with anti-CD3/anti-CD28 beads (αCD3/CD28) or MBP/IL-2
EDSS expanded disability status scale, BDI beck depression inventory (BDI)
The in vitro addition of serotonin modulates the release of cytokines by polyclonally activated and myelin-specific-stimulated cells
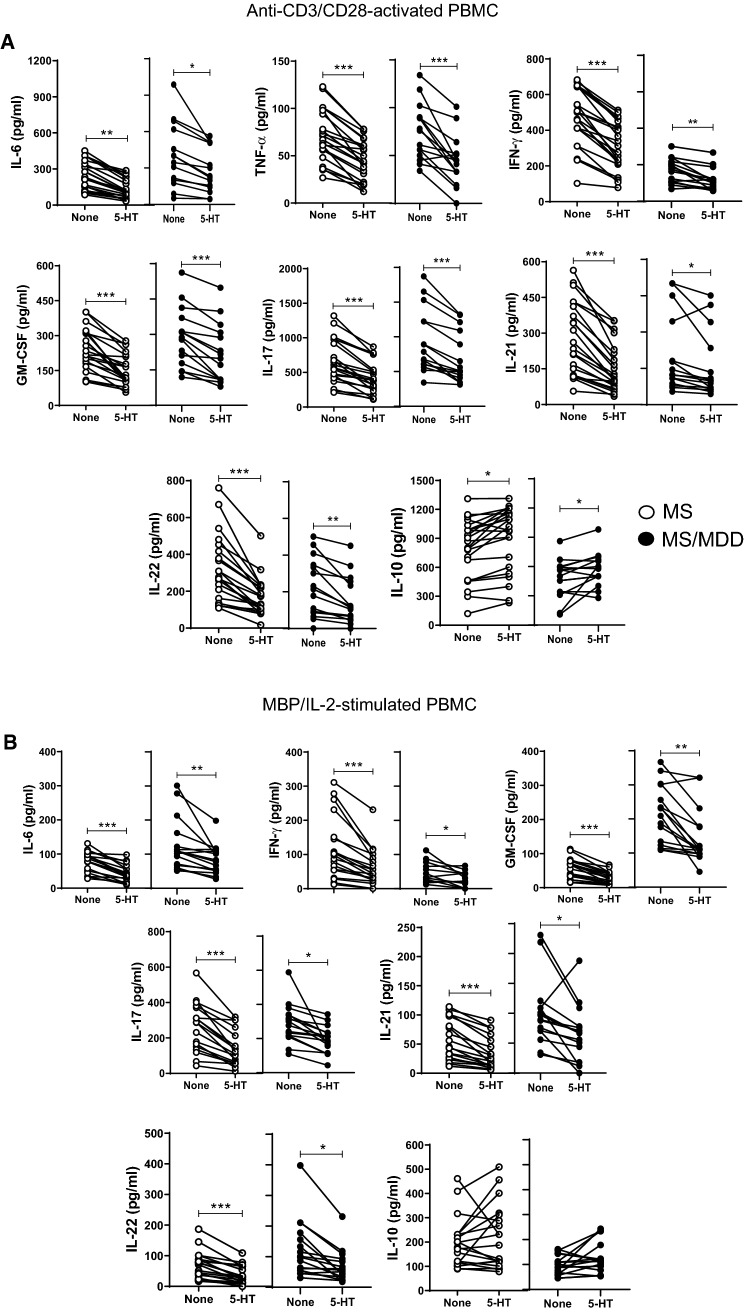
A previous study published by us revealed the ability 5-HT to reduce the release of pro-inflammatory cytokines and up-regulate regulatory CD4+T cells in polyclonally-activated T cells in MS patients without MDD [28]. Here, a physiological dose of 5-HT reduced the production of IL-6, TNF-α, INF-γ, IL-17, IL-21 and IL-22, and increased the release of IL-10 not only in anti-CD3/anti-CD28-activated PBMC cultures from non-depressive MS patients but also in MS/MDD patients (Fig. 8A). Additionally, the levels of IL-6, IFN-γ, GM-CSF, IL-17, IL-21 and IL-22 produced by MBP-stimulated cells were also decreased after 5-HT addition, but no change in the IL-10 secretion was observed in these cell cultures (Fig. 8B).
Fig. 8.
The modulatory effects of serotonin (5-HT) on cytokine production by PBMC of MS patients with or without MDD. The PBMC cultures (1 × 10⁶/mL) from MS patients with (MS/MDD, n = 22) or without (MS, n = 22) MDD were activated for 3 days with anti-CD3/anti-CD28 beads (A) or for 5 days with MPB/IL-2 (B). The effect of serotonin on cytokine production was determined after addition of 200 ng/mL of 5-HT. The different cytokine levels were assayed by Luminex. Data are shown as mean ± SD and significance was calculated by comparing MS and MS/MDD and the p values (*p < 0.05, **p < 0.001, and ***p < 0.0001) are indicated in the figure. Data are shown as mean ± SD of 8 independent experiments with 1–3 samples per experiment from each group of patients
Discussion
The lifetime prevalence of major depression in MS patients is at least three times higher than observed in general population [4], and mood disorders have been associated with increased risk of clinical relapses [5]. Despite a lack of studies investigating the molecular and cellular mechanisms behind this adverse relationship, it may involve cytokine production by encephalitogenic T cells [34, 35] associated with recurrent demyelination in any area of the CNS, leading to sensory, autonomic, cognitive, and motor function deficits [1, 2]. Although preliminary, the results presented here are original and reveal the impact of MDD in favoring the expansion of circulating pathogenic T-cells with enhanced reactivity to myelin antigen. This phenomenon should be associated with the known imbalance of cytokines observed in MDD subjects.
Higher levels of IL-1β, IL-6 and IL-17 were observed in the plasma from MS/MDD patients when compared to MS patients. Accordingly, the production of Th17-related cytokines (IL-6, IL-17, TNF-α, IL-21 and IL-22) in response to both anti-CD3/anti-CD28 and myelin antigen was higher in cell cultures from depressed patients. In these cell cultures, the occurrence of depression also elevated the frequency of myelin-specific GM-CSF+ and IL-22+ CD4+T cells. In line with other authors [10], elevated plasma levels of IL-1β and TNF-α, as well as higher release of IL-6, TNF-α, GM-CSF and IL-17 by anti-CD3/anti-CD28-activated T-cells, were observed by our group in samples from non-MS depressed subjects when compared with healthy individuals. These findings suggested that major depression should indeed favor the expansion of T cell phenotypes correlated with MS severity. In agreement, previous study published by us [38] demonstrated that occurrence of MDD elevated the production of Th2-related cytokines (IL-5 and IL-13) in patients suffering from allergic asthma but not non-allergic subjects. Classically, those cytokines have been associated with severity of atopic diseases [39].
In this context, the plasma levels of IL-1β, TNF-α, IL-17 and IL-6, as well as the in vitro production of IL-17, IL-6 and GM-CSF by anti-CD3/anti-CD28-activated T cells from MS patients directly correlated with neurological disability and the severity of depressive symptoms. This indicates that Th17-related cytokines production has been implicated in both myelin sheath damage and depression severity.
In agreement with these findings, elevated levels of IL-1β, IL-6 and TNF-α have been associated with severity of depressive symptoms in general population [40, 41]. Keaton et al. revealed that high IL-6 levels are linked to increased risk of suicide [42]. In rheumatoid arthritis patients, depression was associated with elevated IL-6 production and disease severity [43–45]. In the context of MS, higher production of IL-6 and IL-1β in depressed patients may contribute to disease severity by favoring, along with IL-23, the differentiation of highly pathogenic Th17 cell subsets (IFN-γ+ and GM-CSF+) [46, 47]. Here, the frequency of IL-17+IFN-γ+ and IFN-γ+GM-CSF+ CD4+T cells in response to myelin antigen was not only higher in depressed MS patients, but their proportion positively correlated with neurological disabilities. Concerning IL-21, this cytokine should also contribute to disease progression by providing a positive feedback loop for Th17 survival [48].
Although Th17 cells can release IL-22, abundant amounts of IL-6 and TNF-α observed in depressed patients can also induce Th22 cells [49]. MBP-specific Th22 cells have been associated with both clinical relapse rates [23] and the number of active brain lesions [16]. Interestingly, in our study, elevated levels of IL-6 and TNF-α were associated with higher expansion of IL-22+CD4+T-cells in cell cultures from MS/MDD. Notably, the frequency of MDD-derived CD4+T-cells positive for IL-22 and GM-CSF at baseline was significantly higher than in non-depressed MS patients, indicating the presence of pre-activated CD4+T-cells.
Beyond their involvement in MS activity, elevated levels of cytokines, like IL-6 and IL-21 might compromise the function of regulatory CD4+T (Treg) subsets in these patients [25–27]. In addition to producing anti-inflammatory cytokines, such as IL-10, the expression of CD25, CD39 and CD152 on Treg cells participates in their functionality [28–33]. A study by our group has found a lower frequency of CD39+IL-10+FoxP3+ CD4+T-cells in non-depressed RRMS patients when compared with healthy subjects [28]. In the present study, in comparison with non-depressed MS individuals, MDD patients had reduced IL-10 levels quantified in the plasma and in the supernatants collected from MBP-stimulated PBMC cultures. Further, the severity of depressive symptoms negatively correlated with IL-10 levels. A more detailed investigation of the impact of MDD on different regulatory CD39+T cell subsets demonstrated a higher frequency of CD39+ and CD39+CD25+CD4+T cells able to express FoxP3, IL-10 and CTLA-4 in non-depressed MS patients after anti-CD3/anti-CD28 activation. On the other hand, a lower percentage of CD39+ and CD39+CD25+CD4+T-cells capable of expressing CTLA-4 in response to MBP was observed in MS/MDD patients when compared to MS patients. With regard to disease activity, the proportion of myelin-specific CD39+CD25+CD4+T cells inversely correlated with neurological disability. Moreover, the BDI score negatively correlated with the percentage of MBP-specific CD39+CTLA-4+ and CD39+CD25+CTLA-4+CD4+T cells. Taken together, these findings reveal the negative impact of depression on auto-tolerance mechanisms in MS patients.
Finally, excessive cytokine production may also contribute to MS pathogenesis by depleting tryptophan, an essential amino acid for the synthesis of serotonin (5-HT) [50]. It is known that MDD is associated with a reduction in monoamine production, particularly 5-HT [11], and that serotoninergic neurotransmission is altered in the brain of MS patients [51]. Apart from its role as a CNS neurotransmitter, 5-HT, through its wide array of receptors (5-HT1–7) and in a dose-dependent manner, carries out different actions on immune cells [52]. For example, this neurotransmitter contributes to immune homeostasis by favoring the expansion regulatory immune cells [53–56]. Kim et al. demonstrated that individuals with severe depression have a lower frequency of circulating classical Treg cells, and when compared with healthy individuals, CD39+Treg cells expressed lower 5-HT1A receptor levels [57]. Although we did not investigate the involvement of 5-HT receptors, serotonin reduced the in vitro release of Th1/Th17-relared cytokines after anti-CD3/anti-CD28 or myelin antigen stimulation. Nonetheless, this neurotransmitter only elevated IL-10 production in polyclonally activated T cells.
Underdiagnosed by physicians and, therefore, undertreated, MDD in MS patients is the strongest determinant of impaired quality of life, sleep disturbance, fatigue and cognitive dysfunction [4]. Although our study has some limitations, such as the small sample size and the need for a prospective study, the findings presented here reveal the negative impact of depression on the imbalance of T cell-derived cytokines implicated in MS pathogenesis, with expansion of Th1/Th17 and Th22 cell subsets associated with decrease of CD39+Treg cell subsets, mainly those expressing CTLA-4 marker. Finally, the ability of serotonin to attenuate the production of cytokines by effector T cells suggests that lower availability of this neurotransmitter in patients with MDD may contribute to MS severity. In line with us, the depression treatment in MS patients with selective serotonin reuptake inhibitors (SSRIs) not only attenuated IFN-γ production by T cells in response to myelin antigen MOG (myelin oligodendrocyte glycoprotein) [58], but also appears to reduce the occurrence of new active brain lesions [59]. Therefore, the possibility that MDD treatment with SSRIs could play a role in the treatment of MS, by enhancing the mechanisms of self-tolerance, should be considered and requires clinical investigation.
Supplementary Information
Below is the link to the electronic supplementary material.
Author contributions
Patient monitoring and sample collection by CCV and RA. CAMB and AA designed wrote the paper. PMS, MS, TMK, CM, HAAO, ASOD, LL and CTC performed the experiments. CAMB, ADR and LMM analyzed the data. CAMB and AA contributed with vital reagents. All authors participated in critical revision of the manuscript, provided important intellectual input and approved the final version. All authors read and approved the final manuscript.
Funding
This work was supported by Fundação de Amparo à Pesquisa Carlos Chagas Filho (FAPERJ, grant number: E-26/202.940/2017) and Conselho Nacional de Desenvolvimento Científico e Tecnológico (CNPq, grant number: 301.780/2017-0).
Data availability
The data that support the findings of this study are available from the corresponding author, PMS, upon reasonable request.
Declarations
Conflict of interest
All authors declare that there are no conflicts of interest.
Ethical approval
The work was approved by the Ethics Committee for Research on Human Subjects of the Federal University of the State of Rio de Janeiro (UNIRIO) (04/29/2015/43009015.6.0000.5258).
Consent to participate
All individuals included in the study signed the free and informed consent form.
Consent to publication
All participants signed a term guaranteeing confidentiality and anonymity when publishing the results.
Footnotes
Publisher's Note
Springer Nature remains neutral with regard to jurisdictional claims in published maps and institutional affiliations.
Contributor Information
Priscila Mendonça do Sacramento, Email: pri.men.sac@gmail.com, Email: priscila.m.sacramento@hotmail.com.
Cleonice Alves de Melo Bento, Email: cbento@unirio.br.
References
- 1.Milo R, Miller A. Revised diagnostic criteria of multiple sclerosis. Autoimmun Rev. 2014;13:518–524. doi: 10.1016/j.autrev.2014.01.012. [DOI] [PubMed] [Google Scholar]
- 2.M.S.I.F. (2013) Atlas of MS 2013: mapping multiple sclerosis around the world. multiple sclerosis international federation. Available at: https://www.msif.org/wp-content/uploads/2014/09/Atlas-of-MS.pdf. Accessed 1 June 2020
- 3.Hind D, Kaklamanou D, Beever D, Webster R, Lee E, Barkham M, et al. The assessment of depression in people with multiple sclerosis: a systematic review of psychometric validation studies. BMC Psychiatry. 2016;16:278. doi: 10.1186/s12888-016-0931-5. [DOI] [PMC free article] [PubMed] [Google Scholar]
- 4.Palé LA, Caballero JL, Buxareu BS, Serrano PS, Solà VP. Systematic review of depression in patients with multiple sclerosis and its relationship to interferonβ treatment. Mult Scler Relat Dis. 2017;17:138–143. doi: 10.1016/j.msard.2017.07.008. [DOI] [PubMed] [Google Scholar]
- 5.Mohr DC, Hart SL, Julian L, Cox D, Pelletier D. Association between stressful life events and exacerbation in multiple sclerosis: a meta-analysis. BMJ. 2004;328:731–735. doi: 10.1136/bmj.38041.724421.55. [DOI] [PMC free article] [PubMed] [Google Scholar]
- 6.Rudick R, Cohen J, Weinstock-Guttman B, Kinkel R, Ransohoff R. Management of multiple sclerosis. N Engl J Med. 1997;337:1604–1611. doi: 10.1056/NEJM199711273372207. [DOI] [PubMed] [Google Scholar]
- 7.Benito-León J, Morales JM, Rivera-Navarro J, Mitchell A. A review about the impact of multiple sclerosis on health-related quality of life. Disabil Rehabil. 2003;25:1291–1303. doi: 10.1080/09638280310001608591. [DOI] [PubMed] [Google Scholar]
- 8.Compston A, Coles A. Multiple sclerosis. Lancet. 2008;372:1502–1517. doi: 10.1016/S0140-6736(08)61620-7. [DOI] [PubMed] [Google Scholar]
- 9.Siegert RJ, Abernethy DA. Depression in multiple sclerosis: a review. J Neurol Neurosurg Psychiatry. 2005;76:469–475. doi: 10.1136/jnnp.2004.054635. [DOI] [PMC free article] [PubMed] [Google Scholar]
- 10.Goldsmith DR, Rapaport MH, Miller BJ. A meta-analysis of blood cytokine network alterations in psychiatric patients: comparisons between schizophrenia, bipolar disorder and depression. Mol Psychiatry. 2016;21:1696–1709. doi: 10.1038/mp.2016.3. [DOI] [PMC free article] [PubMed] [Google Scholar]
- 11.Cowen PJ, Browning M. What has serotonin to do with depression? World Psychiatry. 2015;14:158–160. doi: 10.1002/wps.20229. [DOI] [PMC free article] [PubMed] [Google Scholar]
- 12.Arreola R, Becerril-Villanueva E, Cruz-Fuentes C, Velasco-Velázquez MA, Garcés-Alvarez ME, Hurtado-Alvarado G, et al. Immunomodulatory effects mediated by serotonin. J Immunol Res. 2015;2015:354957. doi: 10.1155/2015/354957. [DOI] [PMC free article] [PubMed] [Google Scholar]
- 13.Brucklacher-Waldert V, Stuerner K, Kolster M, Wolthausen J, Tolosa E. Phenotypical and functional characterization of T helper 17 cells in multiple sclerosis. Brain. 2009;132:3329–3341. doi: 10.1093/brain/awp289. [DOI] [PubMed] [Google Scholar]
- 14.Matusevicius D, Kivisäkk P, He B, Kostulas N, Özenci V, Fredrikson S, et al. Interleukin-17 mRNA expression in blood and CSF mononuclear cells is augmented in multiple sclerosis. Mult Scler. 1999;5:101–104. doi: 10.1177/135245859900500206. [DOI] [PubMed] [Google Scholar]
- 15.Tzartos JS, Friese MA, Craner MJ, Palace J, Newcombe J, Esiri MM, et al. Interleukin-17 production in central nervous system-infiltrating T cells and glial cells is associated with active disease in multiple sclerosis. Am J Pathol. 2008;172:146–155. doi: 10.2353/ajpath.2008.070690. [DOI] [PMC free article] [PubMed] [Google Scholar]
- 16.Wing AC, Hygino J, Ferreira TB, Kasahara M, Barros PO, Sacramento PM, et al. Interleukin-17- and interleukin-22-secreting myelin-specific CD4+ T cells resistant to corticoids are related with active brain lesions in multiple sclerosis patients. Immunology. 2016;147:212–220. doi: 10.1111/imm.12552. [DOI] [PMC free article] [PubMed] [Google Scholar]
- 17.Ferreira TB, Hygino J, Wing AC, Kasahara TM, Sacramento PM, Camargo S, et al. Different interleukin-17-secreting Toll-like receptor+ T-cell subsets are associated with disease activity in multiple sclerosis. Immunology. 2017;154:239–252. doi: 10.1111/imm.12872. [DOI] [PMC free article] [PubMed] [Google Scholar]
- 18.Kebir H, Ifergan I, Alvarez JI, Bernard M, Poirier J, Arbour N, et al. Preferential recruitment of interferon-γ-expressing TH17 cells in multiple sclerosis. Ann Neurol Ann Neurol. 2009;66:390–402. doi: 10.1002/ana.21748. [DOI] [PubMed] [Google Scholar]
- 19.Lovett-Racke AE, Yang Y, Racke MK. Th1 versus Th17: are T cell cytokines relevant in multiple sclerosis? Biochim Biophys Acta Mol Basis Dis. 2011;1812:246–251. doi: 10.1016/j.bbadis.2010.05.012. [DOI] [PMC free article] [PubMed] [Google Scholar]
- 20.Restorick SM, Durant L, Kalra S, Hassan-Smith G, Rathbone E, Douglas MR, et al. CCR6+ Th cells in the cerebrospinal fluid of persons with multiple sclerosis are dominated by pathogenic non-classic Th1 cells and GM-CSF-only-secreting Th cells. Brain Behav Immun. 2017;64:71–79. doi: 10.1016/j.bbi.2017.03.008. [DOI] [PMC free article] [PubMed] [Google Scholar]
- 21.Rasouli J, Ciric B, Imitola J, Gonnella P, Hwang D, Mahajan K, et al. Expression of GM-CSF in T-cells is increased in multiple sclerosis and suppressed by IFN-b therapy. J Immunol. 2015;194:5085–5093. doi: 10.4049/jimmunol.1403243. [DOI] [PMC free article] [PubMed] [Google Scholar]
- 22.Bruno R, Sabater L, Sospedra M, Ferrer-Francesch X, Escudero D, Martínez-Cáceres E, et al. Multiple sclerosis candidate autoantigens except myelin oligodendrocyte glycoprotein are transcribed in human thymus. Eur J Immunol. 2002;32:2737–2747. doi: 10.1002/1521-4141(2002010)32:10<2737::AID-IMMU2737>3.0.CO;2-0. [DOI] [PubMed] [Google Scholar]
- 23.Rolla S, Bardina V, De Mercanti S, Quaglino P, De Palma R, Gned D, et al. Th22 cells are expanded in multiple sclerosis and are resistant to IFN-β. J Leukoc Biol. 2014;96:1–10. doi: 10.1189/jlb.5A0813-463RR. [DOI] [PubMed] [Google Scholar]
- 24.Ortiz GG, Pacheco-Moisés FP, Bitzer-Quintero OK, Ramírez-Anguiano AC, Flores-Alvarado LJ, Ramírez-Ramírez V, et al. Immunology and oxidative stress in multiple sclerosis: clinical and basic approach. Clin Dev Immunol. 2013;2013:1–14. doi: 10.1155/2013/708659. [DOI] [PMC free article] [PubMed] [Google Scholar]
- 25.Astier AL, Meiffren G, Freeman S, Hafler DA. Alterations in CD46- mediated Tr1 regulatory T cells in patients with multiple sclerosis. J Clin Invest. 2016;116:3252–3257. doi: 10.1172/JCI29251. [DOI] [PMC free article] [PubMed] [Google Scholar]
- 26.Haas J, Schwarz A, Korporal-Kunke M, Jarius S, Wiendl H, Kieseier BC, et al. Fingolimod does not impair T-cell release from the thymus and beneficially affects Treg function in patients with multiple sclerosis. Mult Scler. 2015;21:1521–1532. doi: 10.1177/1352458514564589. [DOI] [PubMed] [Google Scholar]
- 27.Viglietta V, Baecher-Allan C, Weiner HL, Hafler DA. Loss of functional suppression by CD4+CD25+ regulatory T cells in patients with multiple sclerosis. J Exp Med. 2014;199:971–979. doi: 10.1084/jem.20031579. [DOI] [PMC free article] [PubMed] [Google Scholar]
- 28.Sacramento PM, Monteiro C, Dias ASO, Kasahara TM, Ferreira TB, Hygino J, et al. Serotonin decreases the production of Th1/Th17 cytokines and elevates the frequency of regulatory CD4+ T-cell subsets in multiple sclerosis patients. Eur J Immunol. 2018;48:1376–1388. doi: 10.1002/eji.201847525. [DOI] [PubMed] [Google Scholar]
- 29.Arce-Sillas A, Álvarez-Luquín DD, Tamaya-Domínguez B, Gomez-Fuentes S, Trejo-García A, Melo-Salas M, et al. Regulatory T cells: molecular actions on effector cells in immune regulation. J Immunol Res. 2016;2016:1720827. doi: 10.1155/2016/1720827. [DOI] [PMC free article] [PubMed] [Google Scholar]
- 30.Antonioli L, Pacher P, Vizi ES, Haskó G. CD39 and CD73 in immunity and inflammation. Trends Mol Med. 2013;19(6):355–367. doi: 10.1016/j.molmed.2013.03.005. [DOI] [PMC free article] [PubMed] [Google Scholar]
- 31.Antonioli L, Blandizzi C, Pacher P, Haskó G. Immunity, inflammation and cancer: a leading role for adenosine. Nat Rev Cancer. 2013;13(12):842–857. doi: 10.1038/nrc3613. [DOI] [PubMed] [Google Scholar]
- 32.Haskó G, Linden J, Cronstein B, Pacher P. Adenosine receptors: therapeutic aspects for inflammatory and immune diseases. Nat Rev Drug Discov. 2008;7(9):759–770. doi: 10.1038/nrd2638. [DOI] [PMC free article] [PubMed] [Google Scholar]
- 33.Kurtzke JF. Rating neurologic impairment in multiple sclerosis: an expanded disability status scale (EDSS) Neurology. 1983;33:1444–1452. doi: 10.1212/WNL.33.11.1444. [DOI] [PubMed] [Google Scholar]
- 34.Soga F, Katoh N, Inoue T, Kishimoto S. Serotonin activates human monocytes and prevents apoptosis. J Invest Dermatol. 2007;127:1947–1955. doi: 10.1038/sj.jid.5700824. [DOI] [PubMed] [Google Scholar]
- 35.Fernstrom JD, Wurtman RJ. Control of brain 5-HT content by dietary carbohydrates. In: Barchas J, Usdin E, editors. Serotonin and behavior. Philadelphia, USA: Elsevier Inc.; 1973. pp. 121–128. [Google Scholar]
- 36.Lécuyer MA, Kebir H, Prat A. Glial influences on BBB functions and molecular players in immune cell trafficking. Biochim Biophys Acta Mol Basis Dis. 2016;1862:472–482. doi: 10.1016/j.bbadis.2015.10.004. [DOI] [PubMed] [Google Scholar]
- 37.Ponomarev ED, Shriver LP, Maresz K, Pedras-Vasconcelos J, Verthelyi D, Dittel BN. GM-CSF production by autoreactive T cells is required for the activation of microglial cells and the onset of experimental autoimmune encephalomyelitis. J Immunol. 2007;178:39–48. doi: 10.4049/jimmunol.178.1.39. [DOI] [PubMed] [Google Scholar]
- 38.Oyamada HAA, Cafasso MOSD, Vollmer CM, Alvim F, Lopes LM, Castro C, et al. Major depressive disorder enhances Th2 and Th17 cytokines in patients suffering from allergic rhinitis and asthma. Int Arch Allergy Immunol. 2021;182(12):1155–1168. doi: 10.1159/000517478. [DOI] [PubMed] [Google Scholar]
- 39.Agache I, Strasser DS, Klenk A, Agache C, Farine H, Ciobanu C, et al. Serum IL-5 and IL-13 consistently serve as the best predictors for the blood eosinophilia phenotype in adult asthmatics. Allergy. 2016;71(8):1192–1202. doi: 10.1111/all.12906. [DOI] [PubMed] [Google Scholar]
- 40.Ting EY-C, Yang AC, Tsai S-J. Role of Interleukin-6 in depressive disorder Int. J Mol Sci. 2020;21:2194. doi: 10.3390/ijms21062194. [DOI] [PMC free article] [PubMed] [Google Scholar]
- 41.Zou W, Feng R, Yang Y. Changes in the serum levels of inflammatory cytokines in antidepressant drug-naïve patients with major depression. Hashimoto K, editor. PLoS One. 2018;13:e0197267. doi: 10.1371/journal.pone.0197267. [DOI] [PMC free article] [PubMed] [Google Scholar]
- 42.Keaton SA, Madaj ZB, Heilman P, Smart L, Grit J, Gibbons R, et al. An inflammatory profile linked to increased suicide risk. J Affect Disord. 2019;247:57–65. doi: 10.1016/j.jad.2018.12.100. [DOI] [PMC free article] [PubMed] [Google Scholar]
- 43.Li Y-C, Chou Y-C, Chen H-C, Lu C-C, Chang D-M. Interleukin-6 and interleukin-17 are related to depression in patients with rheumatoid arthritis. Int J Rheum Dis. 2019;22:980–985. doi: 10.1111/1756-185X.13529. [DOI] [PubMed] [Google Scholar]
- 44.Sambamoorthi U, Shah D, Zhao X. Healthcare burden of depression in adults with arthritis. Expert Rev Pharmacoecon Outcomes Res. 2017;17:53–65. doi: 10.1080/14737167.2017.1281744. [DOI] [PMC free article] [PubMed] [Google Scholar]
- 45.Vos T, Abajobir AA, Abate KH, Abbafati C, Abbas KM, Abd-Allah F, et al. Global, regional, and national incidence, prevalence, and years lived with disability for 328 diseases and injuries for 195 countries, 1990–2016: a systematic analysis for the global burden of disease study 2016. Lancet. 2017;390:1211–1259. doi: 10.1016/S0140-6736(17)32154-2. [DOI] [PMC free article] [PubMed] [Google Scholar]
- 46.Angelou CC, Wells AC, Vijayaraghavan J, Dougan CE, Lawlor R, Iverson E, et al. Differentiation of pathogenic Th17 Cells is negatively regulated by Let-7 MicroRNAs in a mouse model of multiple sclerosis. Front Immunol. 2020;10:3125. doi: 10.3389/fimmu.2019.03125. [DOI] [PMC free article] [PubMed] [Google Scholar]
- 47.Hiltensperger M, Korn T. The interleukin (IL)-23/T helper (Th)17 axis in experimental autoimmune encephalomyelitis and multiple sclerosis. Cold Spring Harb Perspect Med. 2018;8:a029637. doi: 10.1101/cshperspect.a029637. [DOI] [PMC free article] [PubMed] [Google Scholar]
- 48.Shi Y, Chen Z, Zhao Z, Yu Y, Fan H, Xu X, et al. IL-21 induces an imbalance of Th17/Treg cells in Moderate-to-severe plaque psoriasis patients. Front Immunol. 2019;10:1865. doi: 10.3389/fimmu.2019.01865. [DOI] [PMC free article] [PubMed] [Google Scholar]
- 49.Duhen T, Geiger R, Jarrossay D, Lanzavecchia A, Sallusto F. Production of interleukin 22 but not interleukin 17 by a subset of human skin-homing memory T cells. Nat Immunol. 2009;10:857–863. doi: 10.1038/ni.1767. [DOI] [PubMed] [Google Scholar]
- 50.Badawy AA. Tryptophan: the key to boosting brain serotonin synthesis in depressive illness. J Psychopharmacol. 2013;27:878–893. doi: 10.1177/0269881113499209. [DOI] [PubMed] [Google Scholar]
- 51.Hesse S, Moeller F, Petroff D, Lobsien D, Luthardt J, Regenthal R, et al. Altered serotonin transporter availability in patients with multiple sclerosis. Eur J Nucl Med Mol Imaging. 2014;41:827–835. doi: 10.1007/s00259-013-2636-z. [DOI] [PubMed] [Google Scholar]
- 52.Shajib MS, Khan WI. role of serotonin and its receptors in activation of immune responses and inflammation. Acta Physiol (Oxf) 2014;213:561–574. doi: 10.1111/apha.12430. [DOI] [PubMed] [Google Scholar]
- 53.Szabo A, Gogolak P, Koncz G, Foldvari Z, Pazmandi K, Miltner N, et al. Immunomodulatory capacity of the serotonin receptor 5-HT2B in a subset of human dendritic cells. Sci Rep. 2018;8:1765. doi: 10.1038/s41598-018-20173-y. [DOI] [PMC free article] [PubMed] [Google Scholar]
- 54.Müller T, Dürk T, Blumenthal B, Grimm M, Cicko S, Panther E, et al. 5-hydroxytryptamine Modulates migration, cytokine and chemokine release and T cell priming capacity of dendritic cells in vitro and in vivo. PLoS One. 2009;4:e6453. doi: 10.1371/journal.pone.0006453. [DOI] [PMC free article] [PubMed] [Google Scholar]
- 55.Snir O, Hesselberg E, Amoudruz P, Klareskog L, Zarea-Ganji I, Catrina AL, et al. Genetic variation in the serotonin receptor gene affects immune responses in rheumatoid arthritis. Genes Immun. 2013;14:83–89. doi: 10.1038/gene.2012.56. [DOI] [PMC free article] [PubMed] [Google Scholar]
- 56.Chabbi-Achengli Y, Coman T, Collet C, Callebert J, Corcelli M, Lin H, et al. Serotonin is involved in autoimmune arthritis through Th17 immunity and bone resorption. Am J Pathol. 2016;186:927–937. doi: 10.1016/j.ajpath.2015.11.018. [DOI] [PubMed] [Google Scholar]
- 57.Kim S, Lee H, Lee G, Oh S, Shin M, Shim I, et al. CD4+CD25+ regulatory T cell depletion modulates anxiety and depression-like behaviors in mice. PLoS One. 2012;7:e42054. doi: 10.1371/journal.pone.0042054. [DOI] [PMC free article] [PubMed] [Google Scholar]
- 58.Mohr DC, Goodkin DE, Islar J, Hauser SL, Genain CP. Treatment of depression is associated with suppression of nonspecific and antigen-specific T(H)1 responses in multiple sclerosis. Arch Neurol. 2001;58(7):1081–1086. doi: 10.1001/archneur.58.7.1081. [DOI] [PubMed] [Google Scholar]
- 59.Mostert JP, Admiraal-Behloul F, Hoogduin JM, Luyendijk J, Heersema DJ, van Buchem MA, et al. Effects of fluoxetine on disease activity in relapsing multiple sclerosis: a double-blind, placebo-controlled, exploratory study. J Neurol Neurosurg Psychiatry. 2008;79(9):1027–1031. doi: 10.1136/jnnp.2007.139345. [DOI] [PubMed] [Google Scholar]
Associated Data
This section collects any data citations, data availability statements, or supplementary materials included in this article.
Supplementary Materials
Data Availability Statement
The data that support the findings of this study are available from the corresponding author, PMS, upon reasonable request.


