



ABSTRACT
Background
Detection of IgG subclasses (IgGSc) is vital for the diagnosis and management of disease, especially IgG4‐related diseases (IgG4‐RD). This study aimed to evaluate the performances of the chemiluminescent immunoassay (CLIA) for detecting IgGSc and diagnosing IgG4‐RD by IgGSc.
Methods
A total of 40 individuals with IgG4‐RD, 40 with primary Sjogren's syndrome (pSS), and 40 healthy controls (HCs) were enrolled. Serum samples were collected for the simultaneous detection of IgG1, IgG2, IgG3, and IgG4 by the Siemens immunonephelometric assay and the CLIA. The correlation analysis was performed, and diagnostic value was analyzed by the receiver operating characteristic (ROC) curve.
Results
Patients with IgG4‐RD had higher IgG4 (p < 0.001) and lower IgG1 (p < 0.001) than those with pSS, and HC. The results by the Siemens immunonephelometric assay and the CLIA showed a strong correlation in detecting IgG1, IgG2, IgG3, and IgG4 (r = 0.937, r = 0.847, r = 0.871, r = 0.990, all p < 0.001, respectively). The sum of IgG1, IgG2, IgG3, and IgG4 using two assays strongly correlated with total IgG by the IMMAGE 800 (r = 0.866, r = 0.811, both p < 0.001, respectively). For discriminating IgG4‐RD from pSS and HC, no significant differences were observed in CLIA IgG4 and Siemens immunonephelometric assay IgG4 (z = 0.138, p = 0.891), which provided the area under the curves (AUCs) of 0.951 (p < 0.001) and 0.950 (p < 0.001), respectively. The AUCs of CLIA IgG1 and Siemens immunonephelometric assay IgG1 in distinguishing pSS from IgG4‐RD and HC were 0.761 (p < 0.001) and 0.765 (p < 0.001), respectively, with no significant differences (z = 0.228, p = 0.820).
Conclusions
The CLIA and the Siemens immunonephelometric assay appeared to have good consistency with comparable diagnostic value in detecting IgGSc, especially IgG4, and IgG1 that can accurately identify IgG4‐RD or pSS in clinical practice.
Keywords: chemiluminescent immunoassay, IgG subclasses, IgG4‐related diseases, immunonephelometric assay, primary Sjogren's syndrome
A total of 40 individuals with IgG4‐RD, 40 with primary Sjogren's syndrome (pSS), and 40 healthy controls (HCs) were recruited. Immunoglobulin G (IgG) subclasses (IgG1, IgG2, IgG3, and IgG4) were parallelly detected by the Siemens immunonephelometric assay and the chemiluminescent immunoassay (CLIA). The levels of the total serum IgG were measured using the Beckman Coulter IMMAGE 800. The correlation analysis of two methods were carried out, and the diagnostic value was analyzed by the receiver operating characteristic (ROC) curve. Quantitative results from the CLIA correlated well with the Siemens immunonephelometric assay. The CLIA and the Siemens assay performed well in detecting IgG subclasses, especially IgG4 and IgG1 that can accurately identify patients with IgG4‐RD or pSS in clinical practice.

1. Introduction
Immunoglobulin G (IgG) is the main molecule of human immunity, accounting for around 75% of the total immunoglobulin in the total serum of a healthy individual. In a study analyzing IgG myeloma samples, Terry et al. proposed that IgG can be divided into different subclasses [1]. At the same period, another study described human IgG can be divided into four subclasses: IgG1, IgG2, IgG3, and IgG4, based on the immunogenicity of distinct heavy chain subgroups [2]. The physiological characteristics and functions of the four subclasses are different, and their functions in immune response are also variant. In recent years, numerous studies have found that abnormal levels of IgG subclasses (IgGSc) are associated with autoimmune diseases, infections, and tumors, especially in the occurrence and development of IgG4‐related diseases (IgG4‐RD), suggesting that dynamic detection of IgGSc has important clinical application value for the diagnosis, pathogenesis, and prognosis of these diseases [3, 4].
IgG4‐RD is an autoimmune disease with chronic and progressive inflammation and fibrosis, characterized by multiple‐organ involvement, predominating the salivary or lacrimal glands, retroperitoneal space, lymph node, pancreas, biliary tract, and thyroid [5]. The diagnosis of IgG4‐RD requires a combination of clinical, serological, radiological, and pathological data. Elevated IgG4 level is the major serological feature, and serum IgG4 >1350 mg/L is considered as a diagnosis criterion for IgG4‐RD [6]. The IgG4‐RD response index (RI) was a disease activity tool modeled by Stone et al., which also included serum IgG4 concentration [7]. Some studies show that serum IgG4 concentrations can provide important clues for diagnosis and some guidance in the longitudinal assessment of disease activity [8, 9].
At present, analytical methods for IgGSc mainly include the binding site (TBS) IgGSc assay and immunoturbidimetric assay, and the Siemens is becoming the most commonly used established assay [10, 11]. In recent years, the chemiluminescent immunoassay (CLIA) has been widely used in clinical diagnosis and research due to its advantages of sensitivity, rapidity, and wide linear range [12]. In this study, we report the clinical performance of the CLIA for the measurement of serum IgGSc based on a comparison with the immunoturbidimetric assay and have evaluated its application.
2. Materials and Methods
2.1. Patients
A total of 40 patients with IgG4‐RD (23 females, 17 males, mean age 59.18 ± 9.30 years) who met the 2019 American College of Rheumatology/European League Against Rheumatism classification criteria and 40 patients with primary Sjogren's syndrome (pSS) (29 females, 11 males, mean age 57.83 ± 10.18) who met 2016 American College of Rheumatology/European League Against Rheumatism classification criteria were enrolled from the Second Hospital of Shanxi Medical University between January 2020 and November 2021 [13, 14]. Peripheral venous blood samples from patients were collected immediately after admission. Forty age‐ and gender‐matched healthy individuals (24 females, 16 males, mean age 57.00 ± 7.37) were recruited as healthy controls (HCs). This study was approved by the ethics committee of the Second Hospital of Shanxi Medical University (2016KY007). Informed consent was obtained from all individuals.
2.2. Clinical and Laboratory Indexes
The clinical parameters of all patients were retrospectively collected from clinical records with a predesigned form, including age, gender, and clinical manifestations of multisystem involvement. In addition, data on the levels of erythrocyte sedimentation rate (ESR), C‐reactive protein (CRP), IgG, IgM, and IgA were also collected. The levels of IgM, IgA, and IgG were measured using the Beckman Coulter IMMAGE 800.
2.3. Immunonephelometric IgGSc Assay
The IgG1, IgG2, IgG3, and IgG4 assay kits (immunonephelometric assay; Siemens Healthcare Diagnostics Products GmbH) and automatic protein analyzer (Siemens BN ProSpec System) were used for IgGSc assay according to the manufacturer's instructions. The protein in the sample forms an immune complex with the specific antibody, and the resultant immune complex scatters the light that passes through the specimen, the intensity of which is proportional to the concentration of the relevant protein in the specimen. The Siemens immunonephelometric assay provides the qualitative determination of IgG1, IgG2, IgG3, and IgG4. The reference intervals of IgG1, IgG2, IgG3, and IgG4 proposed by the manufacturer were 4.05–10.11, 1.69–7.86, 0.11–0.85, and 0.03–2.01 g/L.
2.4. CLIA IgGSc Assay
CLIA IgGSc assay was performed by the chemiluminescence immunoanalyzer (YHLO iFlash 3000) and IgG1, IgG2, IgG3, and IgG4 assay kits (chemiluminescent immunoassay; YHLO Biotechnology Co., Ltd). IgG1, IgG2, IgG3, and IgG4 were detected by sandwich immunoassay using direct chemiluminescence technology. IgG antibody‐coated paramagnetic particles bind to IgG in the sample to form IgG–antibody complex. Under the action of magnetic field, magnetic particles adsorbed to the wall of the reaction tube, and the unbonded substance was washed away by the cleaning solution. Subsequently, the anti‐human IgG antibody acridol marker was added and reacted with the formed IgG–antibody complex to form the sandwich complex, which was then measured by optical system. The concentration of IgG subclass in the sample was positively correlated with the relative luminescence intensity. All manufacturer‐proposed reference intervals of IgG1, IgG2, IgG3, and IgG4 were 3941–10,444, 1661–8064, 101–895, and 36–2090 μg/mL, respectively.
2.5. Statistical Analysis
All data were analyzed using SPSS 22.0 and GraphPad Prism 7. Data were described as median (Q25, Q75), mean ± SD for continuous variables. Data from three groups were compared by one‐way analysis of variance (ANOVA) or the independent‐samples Kruskal–Wallis test. The Mann–Whitney U test was used to compare the differences between two groups. The chi‐squared test was used to compare the difference in categorical variables, which were expressed as numbers with percentages. Spearman's rank correlation was used to calculate the correlation coefficients between the CLIA and the Siemens immunonephelometric assay. Receiver operating characteristic (ROC) curves were plotted, and the differences among the areas under the ROC curves (AUC) were calculated by the MedCalc 15.2.0 software. p values < 0.05 were considered to be statistically significant.
3. Results
3.1. Demographic and Clinical Characteristics of IgG4‐RD and pSS Patients
The demographic and laboratory features of the study participants are summarized in Table 1. There were no significant differences in age (p = 0.555) and gender (p = 0.329) among IgG4‐RD, pSS, and HC. The patients with IgG4‐RD exhibited a lower IgA (p < 0.001) and IgM (p = 0.023) than those with pSS, but no significant difference in ESR, CRP, TP, ALB, GLO, and IgG (p = 0.928, p = 0.433, p = 0.551, p = 0.941, p = 0.448, p = 0.377, respectively). The clinical manifestations such as dry mouth, lung involvement, and thyroid involvement were similar in the two groups (all p > 0.05).
TABLE 1.
Detailed demographic and laboratory features of the enrolled individuals.
| IgG4‐RD (n = 40) | pSS (n = 40) | HC (n = 40) | p | |
|---|---|---|---|---|
| Age, years | 59.18 ± 9.30 | 57.83 ± 10.18 | 57.00 ± 7.37 | 0.555 |
| Female/male | 23/17 | 29/11 | 24/16 | 0.329 |
| Asians | 40 | 40 | 40 | 1.000 |
| Serology, median (IQR) | ||||
| ESR (mm/h) | 27.00 (13.00, 46.00) | 23.00 (13.25, 51.50) | — | 0.928 |
| CRP (mg/L) | 3.14 (3.13, 6.20) | 3.14 (3.13, 13.65) | — | 0.433 |
| TP (g/L) | 69.70 (63.40, 74.80) | 70.30 (65.60, 75.30) | — | 0.551 |
| ALB (g/L) | 37.70 (34.20, 41.10) | 38.20 (33.23, 41.20) | — | 0.941 |
| GLO (g/L) | 32.40 (26.90, 35.50) | 31.70 (28.10, 38.20) | — | 0.448 |
| IgG (g/L) | 15.60 (12.25, 19.00) | 14.00 (11.65, 18.88) | — | 0.377 |
| IgA (g/L) | 1.90 (1.30, 2.44) | 2.91 (2.05, 4.14) | — | < 0.001 |
| IgM (g/L) | 0.92 (0.55, 1.23) | 1.05 (0.73, 1.62) | — | 0.023 |
| Organ involvement, n (%) | ||||
| Dry mouth | 27 (67.50) | 33 (82.50) | — | 0.196 |
| Dry eye | 17 (42.50) | 27 (67.50) | — | 0.042 |
| Pancreas | 6 (15.00) | 0 | — | NA |
| Bile duct | 2 (5.00) | 0 | — | NA |
| Lung | 11 (27.50) | 5 (12.50) | — | 0.099 |
| Kidney | 6 (15.00) | 0 | — | NA |
| Retroperitoneum | 4 (10.00) | 0 | — | NA |
| Paranasal sinus | 4 (10.00) | 0 | — | NA |
| Lymph node | 10 (25.00) | 1 (2.50) | — | 0.007 |
| Thyroid | 5 (15.00) | 4 (10.00) | — | 0.348 |
Note: All data were described as median (interquartile range) or numbers (percentage) except age, which were compared using the Kruskal–Wallis one‐way ANOVA test or the Mann–Whitney U test. Difference in categorical variables was compared by the chi‐squared test. Age was compared using the independent sample t‐test. Bold values indicate statistically significant (p < 0.05).
Abbreviations: ALB, albumin; CLIA, chemiluminescent immunoassay; CRP, C‐reactive protein; ESR, erythrocyte sedimentation rate; GLO, globulin; HC, healthy control; IgG, immunoglobulin; IgG4‐RD, IgG4‐related diseases; NA, not available; pSS, primary Sjogren's syndrome; TP, total protein.
3.2. The Levels of IgG1, IgG2, IgG3, and IgG4 in IgG4‐RD and pSS Patients
As shown in Figure 1, for both Siemens immunonephelometric assay and CLIA results, the IgG4 levels were significantly higher in patients with IgG4‐RD than those with the pSS, and HC (p < 0.001). For CLIA results, the levels of IgG1 (10086.50 [8587.75, 12216.75] U/mL vs. 7555.50 [6612.75, 9808.50] U/mL, p = 0.007), IgG3 (502.00 [146.25, 797.75] U/mL vs. 228.50 [108.00, 360.75] U/mL, p = 0.002), and IgG4 (4567.50 [2564.25, 10087.75] U/mL vs. 368.50 [174.50, 666.50] U/mL, p < 0.001) were significantly higher in individuals with IgG4‐RD than in HC. This may suggest that IgG1, IgG3, and IgG4 contribute to the diagnosis of IgG4‐RD. Compared to patients with pSS, patients with IgG4‐RD had significantly reduced IgG1 (10086.50 [8587.75, 12216.75] U/mL vs. 13810.00 [9927.00, 19343.25] U/mL, p = 0.0038) and increased IgG4 (4567.50 [2564.25, 10087.75] U/mL vs. 351.00 [125.75, 594.00] U/mL, p < 0.001), which indicated that IgG1 and IgG4 are helpful in differentiating IgG4‐RD from pSS (Table S1). The Siemens immunonephelometric assay showed the same trend (Table S2).
FIGURE 1.

Serum levels of IgG subclass in patients with IgG4‐RD and pSS measured by the Siemens assay and CLIA. IgG subclasses measured using the (a) CLIA (b) and the Siemens BN P. Data were presented as median (Q25, Q75) and were analyzed by the Kruskal–Wallis test. *p < 0.05, **p < 0.01, ***p < 0.001.
3.3. Correlations Between the Levels of IgGSc Determined by the YHLO CLIA and Siemens Immunonephelometric Assays
We next analyzed the correlation between the Siemens immunonephelometric assay and the YHLO CLIA (Figure 2). The correlation coefficients of IgG1, IgG2, IgG3, and IgG4 detected by the CLIA and the Siemens immunonephelometric assay were 0.937, 0.847, 0.871, and 0.990 (all p < 0.001), respectively, which indicated that the levels of IgGSc determined by the two assays exhibited good correlations. The correlation coefficient of sum of IgG1, IgG2, IgG3, and IgG4 detected by the CLIA and the Siemens immunonephelometric assay was 0.945 (p < 0.001).
FIGURE 2.

Correlation of serum IgG subclasses levels detected by the Siemens BN P to those by the CLIA. Correlation of serum IgG1 (a), IgG2 (b), IgG3 (c), IgG4 (d), and the sum of IgG1, IgG2, IgG3, and IgG4 (e) detected by the Siemens BN P to those by the CLIA. Data were analyzed by Spearman's rank correlation.
We also evaluated the proportion of patients with IgG4‐RD, pSS, and HC whose serum IgG1, IgG2, IgG3, and IgG4 levels exceeded the upper limit determined by the two assays. As shown in Figure 3 and Table S3, there were no significant differences in the detection rates of IgG1, IgG2, IgG3, and IgG4 in patients with IG4‐RD and pSS, and in HC between the two assays (all p > 0.05).
FIGURE 3.

Comparison of the positive rate of IgG subclasses measured by the Siemens BN P and the CLIA in different cohorts. The positive rate of IgG subclasses in patients with (a) IgG4‐RD and (b) pSS. The positive rate of IgG subclasses (c) in the HC group and (d) in all individuals. Data were analyzed by the chi‐squared test. NS: p > 0.05.
3.4. Relationships Between the Sum of IgGSc and the Total Serum IgG Measured Using the Beckman Coulter IMMAGE 800
We further investigated the correlation between the sum of IgGSc and the total serum IgG measured using the Beckman Coulter IMMAGE 800 in patients with IgG4‐RD and pSS (Figure 4). The strong positive correlations were found between the sum of IgG1, IgG2, IgG3, and IgG4 detected by the CLIA and the Siemens immunonephelometric assay and the total serum IgG (r = 0.811, p < 0.001; r = 0.866, p < 0.001, respectively). The good correlation between the sum of the IgG1, IgG2, IgG3, and IgG4 and the measured value of total IgG supported the accuracy of the two assays.
FIGURE 4.

Relationships between the sum of IgG1, IgG2, IgG3, and IgG4 and the total serum IgG measured by the Beckman Coulter IMMAGE 800 in patients with IgG4‐RD and pSS. Relationship between the serum total IgG and the sum of IgG subclasses measured using the (a) CLIA and (b) Siemens BN P.
3.5. Cutoff Values for the YHLO CLIA and the Siemens Immunonephelometric Assay
Although a good correlation between the results with two methods were found, the measured values were different. Therefore, the cutoff values also varied depending on the reagent used. We next calculated the IgG4‐RD cutoff values for the two IgG4 methods. ROC analysis was performed between patients with IgG4‐RD, pSS and in HC. The cutoff value and AUC, sensitivity, and specificity for each assay are shown in Tables 2 and 3. The cutoff values of CLIA IgG4 and Siemens immunonephelometric assay IgG4 in discriminating IgG4‐RD from pSS were 1804 μg/mL and 1490, respectively, and the cutoff values for distinguishing IgG4‐RD from HC were 1126 μg/mL and 1100, respectively. The cutoff values of CLIA IgG1 and Siemens immunonephelometric assay IgG1 in discriminating pSS from HC were 11,269 and 7880 μg/mL, respectively. The cutoff value of CLIA IgG3 in discriminating pSS from HC was 408 μg/mL, which was close to the cutoff value of 472 μg/mL of the Siemens immunonephelometric assay.
TABLE 2.
Diagnostic accuracy of IgG subclass to distinguish patients with IgG4‐RD from those with pSS and HCs.
| AUC (95% CI) | p | Cutoff (μg/mL) | Sen (95% CI) | Spe (95% CI) | +LR (95% CI) | −LR (95% CI) | z | p′ | |
|---|---|---|---|---|---|---|---|---|---|
| IgG4‐RD versus pSS+HC | |||||||||
| CLIA‐IgG4 | 0.951 (0.895, 0.982) | < 0.001 | > 1804 | 87.50 (73.20, 95.80) | 96.25 (89.40, 99.20) | 23.33 (7.60,71.3) | 0.13 (0.06, 0.30) | 0.138 | 0.891 |
| Siemens‐IgG4 | 0.950 (0.894, 0.981) | < 0.001 | > 1490 | 87.50 (73.20, 95.80) | 95.00 (87.70, 98.60) | 17.50 (6.70, 45.80) | 0.13 (0.06, 0.30) | ||
| IgG4‐RD versus pSS | |||||||||
| CLIA‐IgG4 | 0.953 (0.881, 0.988) | < 0.001 | > 1804 | 87.50 (73.20, 95.80) | 97.50 (86.80, 99.90) | 35.00 (5.00, 243.3) | 0.13 (0.06, 0.30) | 0.144 | 0.885 |
| Siemens‐IgG4 | 0.952 (0.879, 987) | < 0.001 | > 1490 | 87.50 (73.20, 95.80) | 95.00 (83.10, 99.40) | 17.50 (4.50, 67.90) | 0.13 (0.06, 0.30) | ||
| IgG4‐RD versus HC | |||||||||
| CLIA‐IgG1 | 0.721 (0.609, 0.815) | < 0.001 | > 7656 | 80.00 (64.40, 90.90) | 55.00 (38.50, 70.70) | 1.78 (1.20, 2.60) | 0.36 (0.20, 0.70) | 2.791 | 0.005 |
| Siemens‐IgG1 | 0.812 (0.709, 0.891) | < 0.001 | > 8120 | 77.50 (61.50, 89.20) | 80.00 (64.40, 90.90) | 3.88 (2.00, 7.40) | 0.28 (0.20,0.50) | ||
| CLIA‐IgG3 | 0.712 (0.600, 0.808) | < 0.001 | > 408 | 65.00 (48.30, 79.40) | 85.00 (70.20, 94.30) | 4.33 (2.00, 9.40) | 0.41 (0.30, 0.60) | 0.561 | 0.575 |
| Siemens‐IgG3 | 0.735 (0.624, 0.827) | < 0.001 | > 361.6 | 67.50 (50.90, 81.40) | 70.00 (53.50, 83.40) | 2.25 (1.30, 3.80) | 0.46 (0.30, 0.80) | ||
| CLIA‐IgG4 | 0.949 (0.875, 0.986) | < 0.001 | > 1126 | 87.50 (73.20, 95.80) | 95.00 (83.10, 99.40) | 17.50 (4.50, 67.90) | 0.13 (0.06, 0.30) | 0.103 | 0.918 |
| Siemens‐IgG4 | 0.948 (0.874, 0.985) | < 0.001 | > 1100 | 87.50 (73.20, 95.80) | 95.00 (83.10, 99.40) | 17.50 (4.50, 67.90) | 0.13 (0.06, 0.30) | ||
Abbreviations: AUC, area under roc curve; CI, confidence interval; LR, likelihood ratio; Sen, sensitivity; Spe, specificity.
TABLE 3.
Diagnostic accuracy of IgG subclass to distinguish patients with pSS from those with IgG4‐RD and HCs.
| AUC (95% CI) | p | Cutoff (μg/mL) | Sen (95% CI) | Spe (95% CI) | +LR (95% CI) | −LR (95% CI) | z | p′ | |
|---|---|---|---|---|---|---|---|---|---|
| pSS versus IgG4‐RD+HC | |||||||||
| CLIA‐IgG1 | 0.761 (0.675, 0.834) | < 0.001 | > 12,303 | 62.50 (45.80, 77.30) | 90.00 (81.20, 95.60) | 6.25 (3.10, 12.60) | 0.42 (0.30, 0.60) | 0.228 | 0.820 |
| Siemens‐IgG1 | 0.765 (0.679, 0.838) | < 0.001 | > 10,280 | 62.50 (45.80, 77.30) | 83.75 (73.80, 91.10) | 3.85 (2.20, 6.70) | 0.45 (0.30, 0.70) | ||
| CLIA‐IgG4 | 0.745 (0.658, 0.821) | < 0.001 | ≤ 1804 | 97.50 (86.80, 99.90) | 46.25 (35.00, 57.80) | 1.81 (1.50, 2.20) | 0.05 (0.01, 0.40) | 0.056 | 0.956 |
| Siemens‐IgG4 | 0.746 (0.658, 0.821) | < 0.001 | ≤ 1820 | 97.50 (86.80, 99.90) | 45.00 (33.80, 56.50) | 1.77 (1.40, 2.20) | 0.06 (0.01, 0.40) | ||
| pSS versus HC | |||||||||
| CLIA‐IgG1 | 0.838 (0.738, 0.911) | < 0.001 | > 11,269 | 70.00 (53.50, 83.40) | 92.50 (79.60, 98.40) | 9.33 (3.10, 28.20) | 0.32 (0.20, 0.50) | 1.625 | 0.104 |
| Siemens‐IgG1 | 0.870 (0.776, 0.935) | < 0.001 | > 7880 | 85.00 (70.20, 94.30) | 77.50 (61.50, 89.20) | 3.78 (2.10, 6.80) | 0.19 (0.09, 0.40) | ||
| CLIA‐IgG3 | 0.723 (0.611, 0.817) | < 0.001 | > 408 | 55.00 (38.50, 70.70) | 85.00 (70.20, 94.30) | 3.67 (1.70, 8.10) | 0.53 (0.40, 0.80) | 0.465 | 0.642 |
| Siemens‐IgG3 | 0.738 (0.628, 0.830) | < 0.001 | > 472 | 55.00 (38.50, 70.70) | 90.00 (76.30, 97.20) | 5.50 (2.10, 14.50) | 0.50 (0.30, 0.70) | ||
3.6. Clinical Values of IgGSc Determined by the Siemens Immunonephelometric Assay and the YHLO CLIA in Diagnosing IgG4‐RD and pSS
Based on Figure 1, the diagnostic performance of IgGSc determined by the CLIA and the Siemens immunonephelometric assay was further evaluated, and the results are summarized in Tables 2 and 3. Although the cutoff values differed between the two methods, no significant differences in AUC, sensitivity, and specificity were observed. We drew ROC curves to compare the difference between two assays in distinguishing specific patients and controls (Figures 5 and 6). The AUCs of CLIA IgG4 and Siemens immunonephelometric assay IgG4 were 0.951 (95% confidence interval [CI]: 0.895–0.982) and 0.950 (95% CI: 0.894–0.981) in discriminating IgG4‐RD from pSS and HC, and the AUC for distinguishing IgG4‐RD from pSS were 0.953 (95% CI: 0.881–0.988) and 0.952 (95% CI: 0.879–0.987), and the AUCs for distinguishing IgG4‐RD from HC were 0.949 (95% CI: 0.875–0.986) and 0.948 (95% CI: 0.874–0.985), with no significant difference (z = 0.138, p = 0.891; z = 0.144, p = 0.885; z = 0.138, p = 0.891; z = 0.103, p = 0.918, respectively). In addition, CLIA IgG1, Siemens immunonephelometric assay IgG1, CLIA IgG3, and Siemens immunonephelometric assay IgG3 can be used to distinguish IgG4‐RD from HC, with AUCs of 0.721 (95% CI: 0.609–0.815), 0.812 (95% CI: 0.709–0.891), 0.712 (95% CI: 0.600–0.808), and 0.735 (95% CI: 0.624–0.827), respectively. For IgG1, a significantly higher AUC was found with the Siemens immunonephelometric assay than with the CLIA (z = 2.791, p = 0.005), and there was no significant difference in the AUCs between CLIA IgG3 and Siemens immunonephelometric assay IgG3 (z = 0.561, p = 0.5755) (Figure 5).
FIGURE 5.
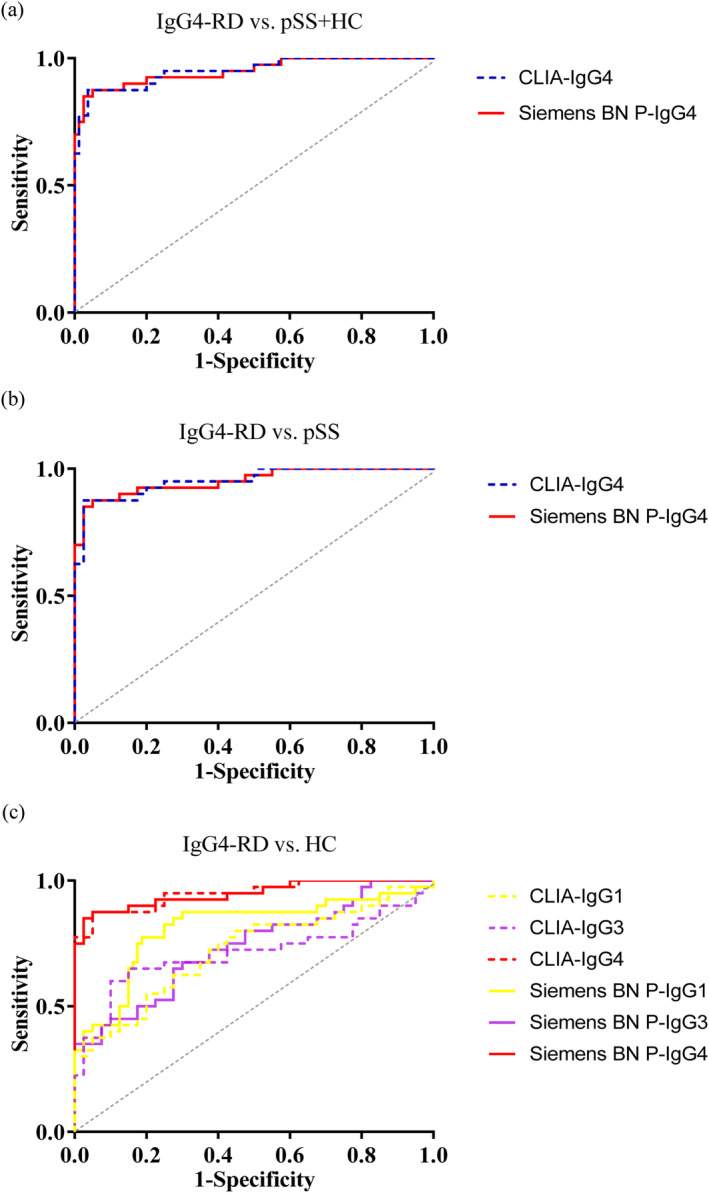
Receiver operating characteristic curve (ROC) analysis of the serum levels of IgG subclasses. (a) ROC of IgG4 levels to distinguish patients with IgG4‐RD from those with (a) pSS and HCs, (b) pSS. (c) ROCs of IgG1, IgG3, and IgG4 to distinguish patients with IgG4‐RD patients from those with HCs.
FIGURE 6.

ROC analysis of the serum levels of IgG subclasses. (a) ROCs of IgG1 and IgG4 to distinguish patients with pSS from those with IgG4‐RD and HCs. (b) ROCs of IgG1 and IgG3 to distinguish patients with pSS from those with HC.
The AUCs of CLIA IgG1 and Siemens immunonephelometric assay IgG1 were 0.761 (95% CI: 0.675–0.834) and 0.765 (95% CI: 0.679–0.838) for discriminating pSS from IgG4‐RD and HC, and the AUCs of CLIA IgG4 and Siemens immunonephelometric assay IgG4 were 0.745 (95% CI: 0.658–0.821) and 0.746 (95% CI: 0.658–0.821), without a significant difference (z = 0.228, p = 0.820; z = 0.056, p = 0.956, respectively). In discriminating pSS from and HC, there were no significant differences in the AUCs between CLIA IgG1 and Siemens immunonephelometric assay IgG1 or CLIA IgG3 and Siemens immunonephelometric assay IgG3 (z = 1.625, p = 0.104; z = 0.465, p = 0.642, respectively). In conclusion, these results indicate that the CLIA has a similar diagnostic value to the Siemens immunonephelometric assay (Figure 6).
4. Discussion
Polyclonal hypergammaglobulinemia (PHGG) is a physiological reaction to liver disease, hematological disorders, infection, inflammation, and so on and is characterized by the overproduction of immunoglobulins by plasma cells and high levels of IgGSc [15, 16]. Autoimmune diseases such as pSS, rheumatoid arthritis, and eosinophilic granulomatosis with polyangiitis can also cause PHGG [17]. In addition to lymphadenopathy and eosinophilia, PHGG also is the hematological manifestations of IgG4‐RD [18]. Moreover, PDHH can provide important clues for IgG4‐RD with variable clinical manifestations and difficult diagnosis; in particular, serum IgG4 concentration can be used as a screening index for IgG4‐RD [19]. Serum protein electrophoresis, quantitative immune nephelometry, and IgGSc assay are important for immunoglobulin detection of PDHH. Sometimes, serum protein electrophoresis is performed in conjunction with IgGSc detection to determine whether elevated immunoglobulins are polyclonal [20].
In addition, the measurement of IgGSc is widely performed as part of the laboratory evaluation of immunologic deficiencies, autoimmune diseases, infections, and tumors [21]. Especially for IgG4‐RD, circulating IgGSc is strongly associated with their occurrence and development, prognosis, or treatment [22]. In clinical laboratories, quantitative detection of IgGSc profile (IgG1, IgG2, IgG3, and IgG4) is generally performed by the Siemens immunonephelometric assay [23]. In recent years, liquid chromatography‐mass spectrometry (LC–MS) has rapidly gained attention as a method for the identification and monitoring of serum immunoglobulin and has also become a method for the detection of IgGSc. Van der Gugten et al., for the performance of LC–MS for the detection of IgGSc, demonstrated that LC–MS could compensate for the inconsistency of the Siemens immunonephelometric assay in the detection of IgG2 [24]. In addition, the CLIA also is a convenient and commonly used method for quantitative analysis of protein targets in laboratories. However, comprehensive validation and performance of the CLIA for IgGSc has not been done. Since reliable experimental performance is important for the clinical application of diagnostic markers, it is necessary to perform reliable performance verification for the newly developed commercial analytical assays.
In this study, we used the automated CLIA to measure IgGSc values in patients with IgG4‐RD and pSS versus healthy adults, compared with the Siemens immunonephelometric assay. Our results overall showed a good correlation to the CLIA and the Siemens immunonephelometric assay. We analyzed the diagnostic value of the CLIA for the detection of IgGSc and calculated the cutoff value for each reagent. The AUCs between the two methods were compared between patients with IgG4‐RD and those with pSS, which need to be distinguished from IgG4‐RD. The applicability of the CLIA for IgGSc was investigated using serum of patients with IgG4‐RD, patients with pSS, and HC. The results revealed significantly higher levels of IgG1, IgG3, and IgG4 among patients with IgG4‐RD and pSS than those of in HC. In daily clinical practice, serum IgG4 level is considered an important marker for the diagnosis of IgG4‐RD. It is worth noting that IgG and IgG subclass levels vary by race. Some studies have demonstrated that the concentrations of IgG and IgG4 are higher in Asian people than in White people with the IgG4‐RD, which has the potential to affect the interpretation of these diagnostic tests in the clinical setting and in research [25, 26]. In this study, all the individuals included were Chinese, and there was no racial difference.
In addition, there were good correlation in IgG1, IgG2, IgG3, and IgG4 between the results with two methods (r = 0.937, r = 0.847, r = 0.871, r = 0.990, respectively); which manifests that the quantitative levels of IgGSc measured using the CLIA were consistent with the levels measured using the Siemens immunonephelometric assay. The good correlation between the sum of IgG1, IgG2, IgG3, and IgG4 using the Siemens immunonephelometric assay and the CLIA and the total IgG by IMMAGE 800 were found (r = 0.866, r = 0.811, respectively), which supports the accuracy of the determinations. However, the measured values were different. This disparity may be explained by some reasons. The first reason may be the variation in IgGSc levels is associated with different reagents used for detection. The measurements have not been unified, and each reference material of each IgGSc values was determined by different manufacturer, which means that two assays have established the different traceability. Importantly, IgG1, IgG2, IgG3, and IgG4 are not monoclonal, and serum IgGSc in patients is polyclonal with reactivity to multiple antigens [27]. Also, there is currently no consensus on calibration materials that can be used to detect IgGSc [28]. Another reason is that we recruited 120 individuals, the small number of sample size. These factors may have led to the difference between our results and other reports. Differences in IgGSc values between the Siemens immunonephelometric assay and other methods, such as TBS, N‐assay LA Nittobo (Nittobo), and BS‐NIA have been previously reported [29].
In clinical practice, it is necessary for each laboratory to develop its own reference limits. Our study clearly confirms that the cutoff values of serum IgGSc are not constant for the diagnosis of IgG4‐RD, and the cutoff value level is dependent on the population to be identified. As pSS were found to be associated with elevated IgG4 concentrations [30], we determined the optimal cutoff values of CLIA IgG4 (1804 μg/mL) and Siemens IgG4 (1490 μg/mL) by ROC curve for Chinese population in differentiating the IgG4‐RD group from pSS and HCs, which will improve our understanding of the laboratory indicators and improve clinical diagnosis. Under the set cutoff value, the sensitivity of CLIA IgG4 and Siemens immunonephelometric assay IgG4 were 87.50% and 87.50%, respectively, and specificity were 96.25% and 95.00%, respectively. While the stark difference in cutoff levels of the diagnostic serum IgGSc between the two assays is evident, no significant differences in AUC, sensitivity, and specificity were observed.
To the best of our knowledge, this study is the first to evaluate the Siemens immunonephelometric assay versus the YHLO CLIA for quantitative determination of IgGSc profile (IgG1, IgG2, IgG3, and IgG4). We showed that the CLIA is a quantitative assay with a working performance comparable to the Siemens immunonephelometric assay. Quantitative results from the CLIA correlated good with the Siemens immunonephelometric assay. In addition, the sum of IgGSc by the CLIA is comparable to that by the Siemens immunonephelometric assay. Although the good correlation coefficient for all data was also observed between the CLIA and the Siemens immunonephelometric assay, it does not mean the CLIA can replace the Siemens immunonephelometric assay. Clinicians should further evaluate and choose appropriate methods and proper cutoff values to avoid misclassification of patients. Furthermore, clinicians should be circumspect in detecting IgGSc levels using different reagents to avoid miscalculation of the results and misclassification of patients. This study can provide a basis for the CLIA to detect IgGSc to a certain extent and supplement more choices for the clinical detection of IgGSc. However, multi‐center prospective clinical studies with large sample sizes are necessary to more clearly establish cutoff values of serum IgGSc for the diagnosis of patients with IgG4‐RD or pSS, which is where the shortcomings of our current study lie and where future research should be directed.
5. Conclusion
In summary, we conclude that IgGSc assays by the CLIA is feasible, which will facilitate the diagnosis of IgG4‐RD and pSS, and be of high value in applications for monitoring disease.
Author Contributions
Yan Qin analyzed the data, and developed and wrote the manuscript. Yuhan Jia participated in the sample collection and data extraction. Congcong Liang and Rui Fu performed the experimental procedures of IgG subclasses. Zhaojun Liang and Yanlin Wang contributed to the analysis and interpretation of data. Min Feng participated in the statistical analysis. Chong Gao provided significant revisions to the manuscript. Jing Luo generated themes, and guided and supervised throughout the study. All authors were involved in drafting the article or revising it critically for important intellectual content and approved the final version to be published.
Conflicts of Interest
The authors declare no conflicts of interest.
Supporting information
Table S1.
Table S2.
Table S3.
Table S4.
Funding: This research was supported by the Nature Fund Projects of Shanxi Science and Technology Department (201901D111377), the Scientific Research Project of Health commission of Shanxi Province (2019044), the Research Project Supported by Shanxi Scholarship Council of China (2020‐191), the Science and Technology Innovation Project of Shanxi Province (2020SYS08), and the Central Government Guides Local Science and Technology Development Fund (YDZJSX2022C031).
Data Availability Statement
All data generated or analyzed during this study are available from the corresponding author.
References
- 1. Terry W. D. and Fahey J. L., “Subclasses of Human Gamma‐2‐Globulin Based on Differences in the Heavy Polypeptide Chains,” Science 146 (1964): 400–401, 10.1126/science.146.3642.400. [DOI] [PubMed] [Google Scholar]
- 2. Grey H. M. and Kunkel H. G., “H Chain Subgroups of Myeloma Proteins and Normal 7S Gamma‐Globulin,” The Journal of Experimental Medicine 120, no. 2 (1964): 253–266, 10.1084/jem.120.2.253. [DOI] [PMC free article] [PubMed] [Google Scholar]
- 3. Wei B., Guo Y., Ou X., et al., “Clinical Significance of Serum IgG4 in the Diagnosis and Treatment Response of IgG4‐Related Disease in Adults of Southwest China: A Retrospective Study,” Annals of Laboratory Medicine 43 (2023): 461–469, 10.3343/alm.2023.43.5.461. [DOI] [PMC free article] [PubMed] [Google Scholar]
- 4. Deng Y., Wang J., Zou G., Liu Z., and Xu J., “The Characteristics and Clinical Significance of Elevated Serum IgG4/IgG Levels in Patients With Graves' Disease,” Endocrine 75 (2022): 829–836, 10.1007/s12020-021-02935-3. [DOI] [PubMed] [Google Scholar]
- 5. Matsumoto H., Fujita Y., Matsuoka N., et al., “Serum Checkpoint Molecules in Patients with IgG4‐Related Disease (IgG4‐RD),” Arthritis Research & Therapy 23 (2021): 148, 10.1186/s13075-021-02527-6. [DOI] [PMC free article] [PubMed] [Google Scholar]
- 6. Umehara H., Okazaki K., Masaki Y., et al., “Comprehensive Diagnostic Criteria for IgG4‐Related Disease (IgG4‐RD), 2011,” Modern Rheumatology 22 (2012): 21–30, 10.1007/s10165-011-0571-z. [DOI] [PubMed] [Google Scholar]
- 7. Stone J. H., Hoffman G. S., Merkel P. A., et al., “A Disease‐Specific Activity Index for Wegener's Granulomatosis: Modification of the Birmingham Vasculitis Activity Score. International Network for the Study of the Systemic Vasculitides (INSSYS),” Arthritis and Rheumatism 44 (2001): 912–920, 10.1002/1529-0131(200104)44:4<912::AID-ANR148>3.0.CO;2-5. [DOI] [PubMed] [Google Scholar]
- 8. Kwon O. C., Park M. C., and Kim Y. G., “Correlation Between Serologic Parameters and Disease Activity of IgG4‐Related Disease: Differences Between Patients with Normal and Elevated Serum IgG4 Concentrations,” Frontiers in Immunology 13 (2022): 1020459, 10.3389/fimmu.2022.1020459. [DOI] [PMC free article] [PubMed] [Google Scholar]
- 9. Mizushima I., Konishi M., Sanada H., et al., “Serum IgG4 Levels at Diagnosis Can Predict Unfavorable Outcomes of Untreated Patients With IgG4‐Related Disease,” Scientific Reports 11 (2021): 13341, 10.1038/s41598-021-92814-8. [DOI] [PMC free article] [PubMed] [Google Scholar]
- 10. Schauer U., Stemberg F., Rieger C. H., et al., “IgG Subclass Concentrations in Certified Reference Material 470 and Reference Values for Children and Adults Determined With the Binding Site Reagents,” Clinical Chemistry 49 (2003): 1924–1929, 10.1373/clinchem.2003.022350. [DOI] [PubMed] [Google Scholar]
- 11. Sarnago A., Pascual R. M., Moreno M. J., Laíz B., and Fuster O., “IgG Subclasses Quantitation: Analytical Performance of the Binding Site SPA(PLUS)(R) Human Assay and Comparison With Siemens BNII(R) Assay,” Clinical Biochemistry 51 (2018): 85–89, 10.1016/j.clinbiochem.2017.09.004. [DOI] [PubMed] [Google Scholar]
- 12. Li J., Li S., Huang L., et al., “A Light‐Initiated Chemiluminescent Assay for Rapid Quantitation of Allergen‐Specific IgG(4) in Clinical Samples,” Clinica Chimica Acta 489 (2019): 83–88, 10.1016/j.cca.2018.11.036. [DOI] [PubMed] [Google Scholar]
- 13. Wallace Z. S., Naden R. P., Chari S., et al., “The 2019 American College of Rheumatology/European League against Rheumatism Classification Criteria for IgG4‐Related Disease,” Annals of the Rheumatic Diseases 79 (2020): 77–87, 10.1136/annrheumdis-2019-216561. [DOI] [PubMed] [Google Scholar]
- 14. Shiboski C. H., Shiboski S. C., Seror R., et al., “2016 American College of Rheumatology/European League against Rheumatism Classification Criteria for Primary Sjogren's Syndrome: A Consensus and Data‐Driven Methodology Involving Three International Patient Cohorts,” Annals of the Rheumatic Diseases 76 (2017): 9–16, 10.1136/annrheumdis-2016-210571. [DOI] [PubMed] [Google Scholar]
- 15. Chen L. Y. C., Mattman A., Seidman M. A., and Carruthers M. N., “IgG4‐Related Disease: What a Hematologist Needs to Know,” Haematologica 104 (2019): 1–13, 10.3324/haematol.2018.205526. [DOI] [PMC free article] [PubMed] [Google Scholar]
- 16. Zhao E. J., Carruthers M. N., Li C. H., Mattman A., and Chen L. Y. C., “Conditions Associated With Polyclonal Hypergammaglobulinemia in the IgG4‐Related Disease Era: A Retrospective Study from a Hematology Tertiary Care Center,” Haematologica 105 (2020): e121–e123, 10.3324/haematol.2019.219725. [DOI] [PMC free article] [PubMed] [Google Scholar]
- 17. Zhao E. J., Cheng C. V., Mattman A., and Chen L. Y. C., “Polyclonal Hypergammaglobulinaemia: Assessment, Clinical Interpretation, and Management,” The Lancet Haematology 8 (2021): e365–e375, 10.1016/S2352-3026(21)00056-9. [DOI] [PubMed] [Google Scholar]
- 18. Moller D., Tan J., Gauiran D. T. V., et al., “Causes of Hypereosinophilia in 100 Consecutive Patients,” European Journal of Haematology 105 (2020): 292–301, 10.1111/ejh.13437. [DOI] [PubMed] [Google Scholar]
- 19. Carruthers M. N., Khosroshahi A., Augustin T., Deshpande V., and Stone J. H., “The Diagnostic Utility of Serum IgG4 Concentrations in IgG4‐Related Disease,” Annals of the Rheumatic Diseases 74 (2015): 14–18, 10.1136/annrheumdis-2013-204907. [DOI] [PubMed] [Google Scholar]
- 20. Finn W. G., Gulbranson R., Fisher S., et al., “Detection of Polyclonal Increases in Immunoglobulin G4 Subclass by Distinct Patterns on Capillary Serum Protein Electrophoresis: Diagnostic Pitfalls and Clinical Observations in a Study of 303 Cases,” American Journal of Clinical Pathology 146 (2016): 303–311. [DOI] [PubMed] [Google Scholar]
- 21. Ludwig‐Kraus B. and Kraus F. B., “Similar but Not Consistent: Revisiting the Pitfalls of Measuring IgG Subclasses With Different Assays,” Journal of Clinical Laboratory Analysis 31 (2017): e22146, 10.1002/jcla.22146. [DOI] [PMC free article] [PubMed] [Google Scholar]
- 22. Varghese J. L., Fung A. W. S., Mattman A., et al., “Clinical Utility of Serum IgG4 Measurement,” Clinica Chimica Acta 506 (2020): 228–235, 10.1016/j.cca.2020.04.001. [DOI] [PubMed] [Google Scholar]
- 23. Li P., Liu Z., Wu Z., et al., “Adult Reference Intervals for IgG Subclasses with Siemens Immunonephelometric Assays in Chinese Population,” Allergy, Asthma and Clinical Immunology 13 (2017): 44, 10.1186/s13223-017-0216-7. [DOI] [PMC free article] [PubMed] [Google Scholar]
- 24. van der Gugten G., DeMarco M. L., Chen L. Y. C., et al., “Resolution of Spurious Immunonephelometric IgG Subclass Measurement Discrepancies by LC‐MS/MS,” Clinical Chemistry 64 (2018): 735–742, 10.1373/clinchem.2017.282319. [DOI] [PubMed] [Google Scholar]
- 25. Harkness T., Fu X., Zhang Y., et al., “Immunoglobulin G and Immunoglobulin G Subclass Concentrations Differ According to Sex and Race,” Annals of Allergy, Asthma & Immunology 125 (2020): 190–195.e2, 10.1016/j.anai.2020.03.018. [DOI] [PMC free article] [PubMed] [Google Scholar]
- 26. Qi R., Chen L. Y. C., Park S., et al., “Utility of Serum IgG4 Levels in a Multiethnic Population,” The American Journal of the Medical Sciences 355 (2018): 61–66, 10.1016/j.amjms.2017.08.014. [DOI] [PubMed] [Google Scholar]
- 27. Culver E. L., Vermeulen E., Makuch M., et al., “Increased IgG4 Responses to Multiple Food and Animal Antigens Indicate a Polyclonal Expansion and Differentiation of Pre‐Existing B Cells in IgG4‐Related Disease,” Annals of the Rheumatic Diseases 74 (2015): 944–947, 10.1136/annrheumdis-2014-206405. [DOI] [PMC free article] [PubMed] [Google Scholar]
- 28. Bernasconi L., Mundwiler E., Regenass S., Aubert V., Hammerer‐Lercher A., and Heijnen I., “Variable and Inaccurate Serum IgG4 levels Resulting from Lack of Standardization in IgG Subclass Assay Calibration,” Clinical Chemistry and Laboratory Medicine 57 (2019): 1777–1783, 10.1515/cclm-2019-0261. [DOI] [PubMed] [Google Scholar]
- 29. Usami Y., Sugano M., Uehara T., et al., “Cut‐off Values of Serum IgG4 among Three Reagents, Including a Novel IgG4 Reagent: A Multicenter Study,” Scientific Reports 11 (2021): 7280, 10.1038/s41598-021-86024-5. [DOI] [PMC free article] [PubMed] [Google Scholar]
- 30. Mavragani C. P., Fragoulis G. E., Rontogianni D., Kanariou M., and Moutsopoulos H. M., “Elevated IgG4 Serum Levels among Primary Sjogren's Syndrome Patients: Do they Unmask Underlying IgG4‐Related Disease?” Arthritis Care & Research (Hoboken) 66 (2014): 773–777, 10.1002/acr.22216. [DOI] [PubMed] [Google Scholar]
Associated Data
This section collects any data citations, data availability statements, or supplementary materials included in this article.
Supplementary Materials
Table S1.
Table S2.
Table S3.
Table S4.
Data Availability Statement
All data generated or analyzed during this study are available from the corresponding author.