

Abstract
The budding yeast Saccharomyces cerevisiae is a proven model organism for elucidating conserved eukaryotic biology, but to date its extracellular vesicle (EV) biology is understudied. Here, we show yeast transmit information through the extracellular medium that increases survival when confronted with heat stress and demonstrate the EV‐enriched samples mediate this thermotolerance transfer. These samples contain vesicle‐like particles that are exosome‐sized and disrupting exosome biogenesis by targeting endosomal sorting complexes required for transport (ESCRT) machinery inhibits thermotolerance transfer. We find that Bro1, the yeast ortholog of the human exosome biomarker ALIX, is present in EV samples, and use Bro1 tagged with green fluorescent protein (GFP) to track EV release and uptake by endocytosis. Proteomics analysis reveals that heat shock protein 70 (HSP70) family proteins are enriched in EV samples that provide thermotolerance. We confirm the presence of the HSP70 ortholog stress‐seventy subunit A2 (Ssa2) in EV samples and find that mutant yeast cells lacking SSA2 produce EVs but they fail to transfer thermotolerance. We conclude that Ssa2 within exosomes shared between yeast cells contributes to thermotolerance. Through this work, we advance Saccharomyces cerevisiae as an emerging model organism for elucidating molecular details of eukaryotic EV biology and establish a role for exosomes in heat stress and proteostasis that seems to be evolutionarily conserved.
Keywords: ALIX, Bro1, exosome, extracellular vesicle, heat shock protein, heat stress, Saccharomyces cerevisiae, Ssa2, thermotolerance
Extracellular vesicles (EVs) are thought to mediate intercellular communication for diverse physiology in all organisms. However, EVs are understudied in S. cerevisiae (baker's yeast), a model organism extensively used to resolve the molecular basis of fundamental eukaryotic biology. Here, Logan et al. show that EVs contribute to thermotolerance in yeast and begin to uncover the mechanisms responsible, setting the stage for future studies focused on dissecting EV biology with molecular precision.
1. INTRODUCTION
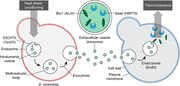
Extracellular vesicles (EVs) are membrane‐encapsulated nanocarriers of ribonucleic acids (RNAs) and proteins shared between cells for intercellular communication underlying diverse physiology (Mathieu et al., 2019; van Niel et al., 2018). Donor cells generate, store, and release them into their surrounding environment in response to stimuli and stressors, for example, heat stress, hypoxia, oxidative stress (Bister et al., 2020; Qi et al., 2021). Secreted EVs are recognised and taken up by specific recipient cells. EV membranes then fuse with the plasma membrane or endosome membranes to release their bioactive contents into the cytoplasm, where they trigger specific responses (van Niel et al., 2018). For example, they are thought to coordinate stem cell proliferation and differentiation as well as tissue development and immune responses (Bahram Sangani et al., 2021; Buzas, 2022; Hur et al., 2021; Kalluri & LeBleu, 2020). Their activities are also linked to many pathologies, including cancers for cell survival in tumour environments (Lucotti et al., 2022; Xu et al., 2018) and neurodegenerative diseases for spreading toxic protein aggregates between neural cells leading to their demise (Asai et al., 2015; Thompson et al., 2016). Despite their importance, most aspects of EV biology are not understood in molecular detail.
Although most research focuses on mammalian EVs, they represent an ancient form of cell–cell communication used by all organisms including unicellular bacteria and yeasts (Brown et al., 2015; Gill et al., 2019; Liebana‐Jordan et al., 2021; Théry et al., 2018). For example, pathogenic fungi such as Candida albicans, Cryptococcus neoformans, and Sporothrix brasiliensis share EVs themselves or with host cells for virulence and immune escape (Freitas et al., 2019; Honorato et al., 2022; Ikeda & Ferreira, 2021; Miura & Ueda, 2018). One non‐pathogenic yeast species in particular, Saccharomyces cerevisiae (budding yeast), is commonly used as a powerful model to uncover the molecular machinery responsible for fundamental processes underlying diverse eukaryotic biology, for example, cell cycle, autophagy, membrane trafficking, the ubiquitin–proteasome system, and so forth. (Finley et al., 2012; Feyder et al., 2015; Zimmerman et al., 2016; Vanderwaeren et al., 2022). Notably, budding yeast was used to discover ESCRTs (endosomal sorting complexes required for transport) and ALIX responsible for biogenesis of a subclass of EVs called exosomes (Baietti et al., 2012; Gurung et al., 2021; Hurley, 2010; Juan & Fürthauer, 2018) and to uncover the molecular network responsible for preventing proteotoxicity induced by heat stress (i.e., the heat shock response; Lindquist & Craig, 1988). However, only a few published studies demonstrate that S. cerevisiae produce and release EVs, whereby most simply catalogue their contents (Kabani & Melki, 2015; Mencher et al., 2020; Oliveira et al., 2010; Peres da Silva et al., 2015; Rodrigues et al., 2014; Vallejo et al., 2012) or use them as negative controls to study the roles EVs play in virulence and immunogenicity of fungal pathogens (e.g., Honorato et al., 2022; Higuchi et al., 2022). In S. cerevisiae, EV function is, thus far, only implicated in cell wall remodelling (Zhao et al., 2019) and prion propagation (Liu et al., 2016). Otherwise, EV biology is relatively understudied in this impactful model organism.
EVs from all organisms studied, including S. cerevisiae, have been subjected to proteomics analysis providing a detailed catalogue of protein contents (Mathivanan & Simpson, 2009; Parreira et al., 2021). From this dataset, we find that heat shock proteins (HSPs) are packaged within EVs across phyla. Heat shock (or stress) drives protein misfolding, which in turn activates HSPs which represent central components in a network of molecular chaperones and folding catalysts tasked with refolding or disposing of these misfolded and/or aggregated proteins to prevent cytotoxicity (Lindquist & Craig, 1988). Critical for proteostasis, HSPs also assist in a wide range of protein folding processes including assembly of newly synthesised proteins, translocation of organellar and secretory proteins, and control of regulatory proteins within the network that engage other cell survival mechanisms (Verghese et al., 2012). Although the basis of their inclusion within EVs remains largely enigmatic, scientists' reason that HSP‐containing EVs may help mediate cell or tissue survival under stress or natural conditions where toxic misfolded protein aggregates may form. This occurs during aging and contributes to pathogenesis of cancers and neurodegenerative disorders (Calderwood et al., 2009; Estévez‐Souto et al., 2022; Jolly & Morimoto, 2000; Takeuchi et al., 2015; Thompson et al., 2016). However, in nearly all cases, the precise roles of HSP‐containing EVs in physiology or pathogenesis are not understood in molecular detail.
Thus, herein we sought to better characterise fundamental EV biology using S. cerevisiae by studying its potential role in the heat shock response (thermotolerance), as it seems most relevant to human physiology and disease and is likely conserved given the presence of HSPs in EVs from all organisms studied.
2. METHODS
2.1. Yeast strains and reagents
S. cerevisiae strains used are listed in Table 1. Mat‐A yeast knock‐out or GFP knock‐in clones are from complete genome‐wide strain collections purchased from Invitrogen Corp. (Cat# 95401.H2 and Cat# 95702, respectively; Carlsbad, USA; see Huh et al., 2003). Biochemical and yeast growth reagents were purchased from Sigma‐Aldrich (Oakville, Canada), BioShop Canada Inc. (Burlington, Canada), or Thermo‐Fisher Scientific (Burlington, Canada).
TABLE 1.
S. cerevisiae strains used in this study.
| Strain | Genotype | Source |
|---|---|---|
| BY4741 (wild type) | MATa his3‐∆1 leu2‐∆0 met15‐∆0 ura3‐∆0 | Huh et al. (2003) |
| Bro1‐GFP | BY4741, BRO1‐GFP::His3MX | Huh et al. (2003) |
| Ssa2‐GFP | BY4741, SSA2‐GFP::His3MX | Huh et al. (2003) |
| vps27∆ | BY4741, vps27∆::KanMX | Invitrogen Corp. |
| vps23∆ | BY4741, vps23∆::KanMX | Invitrogen Corp. |
| vps36∆ | BY4741, vps36∆::KanMX | Invitrogen Corp. |
| snf7∆ | BY4741, snf7∆::KanMX | Invitrogen Corp. |
| bro1∆ | BY4741, bro1∆::KanMX | Invitrogen Corp. |
| end3∆ | BY4741, end3∆::KanMX | Invitrogen Corp. |
| chs1∆ | BY4741, chs1∆::KanMX | Invitrogen Corp. |
| ssa2∆ | BY4741, ssa2∆::KanMX | Invitrogen Corp. |
2.2. Thermotolerance assessment
As shown in Figure 1a, yeast cultures were grown in 5 mL SC (synthetic complete) medium at 30˚C for 17 h in an orbital shaking incubator (Infors AG CH‐4103, Bottmingen, Switzerland) at 200 rpm. Cells were harvested by centrifugation (Sorvall ST 40, ThermoFisher Scientific) at 3000 × g for 1 min, washed, and resuspended in 3 mL of SC medium to a concentration of 20 OD600nm/mL or 2.16 × 10⁹ total yeast cells assuming 3.6 × 10⁷ cells/OD600nm unit. For heat conditioning, cultures were incubated in a water bath with recirculating temperature control (Haake D1 Fisons, Berlin, Germany, or MGW Lauda MT, Königshofen, Germany) at 42˚C for 30 min. Cells were then set to rest at 30˚C for 30 min in an orbital shaking incubator prior to subjecting them to heat stress by incubation in a water bath at 50˚C for 30 min.
FIGURE 1.
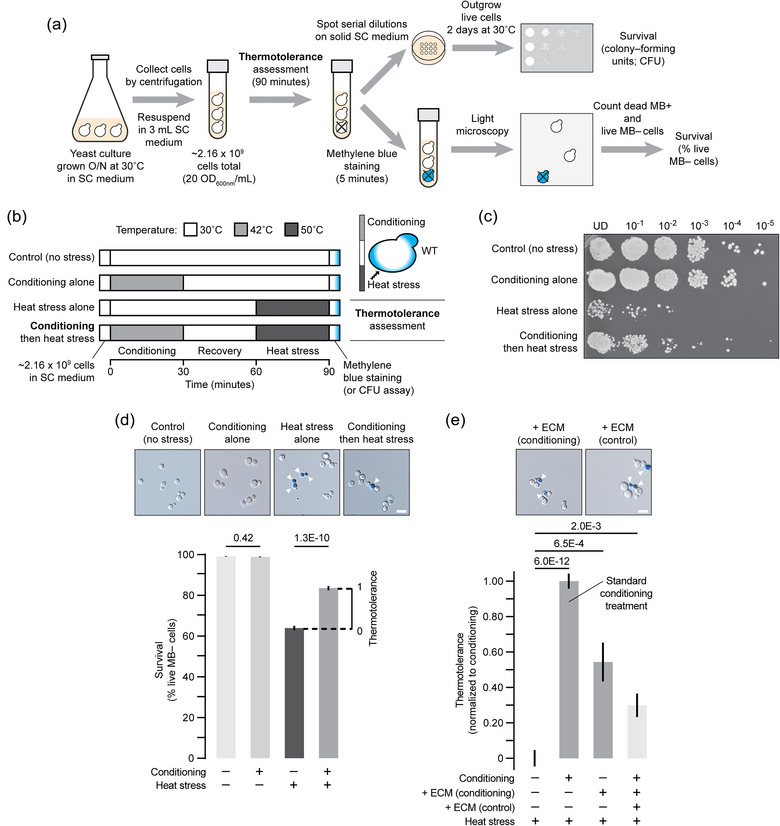
Heat conditioning provides thermotolerance to S. cerevisiae cells. (a) Illustration of experimental paradigm to measure survival after incubating cells at different temperatures to assess thermotolerance. (b) Illustration of treatments used to assess thermotolerance. Inset shows experiment used to test conditioning‐mediated thermotolerance. (c) Image of a plate after conducting the colony‐forming unit assay to assess thermotolerance of wild type yeast cells. Culture dilutions are shown. This is an example of three biological replicates and six technical replicates. (d) Micrographs (top) of wild type yeast cultures stained with methylene blue to detect dead cells after thermotolerance assessment. Cells were counted and proportion of live methylene blue‐negative cells are shown for each condition (bottom). Thermotolerance gained by conditioning was calculated by subtracting % cell survival from heat stress alone from % cell survival observed when cells were conditioned and then subjected to heat stress. n = 2182 (control), 2092 (conditioning alone), 1904 (heat stress alone), or 2062 (conditioning then heat stress). (e) Thermotolerance was assessed using the survival assay shown a. In place of heat conditioning (control; n = 1409), the extracellular medium (ECM) from separate yeast cultures subjected to conditioning alone (42˚C for 30 min; n = 1324) or not (30˚C for 30 min; n = 2393) was added to naïve cells prior to heat stress. Cells subjected to heat stress alone is shown as a negative control (n = 1790). Values are normalised to % survival gained by conditioning. This is used as a standard throughout this study to compare thermotolerance provided by other conditions. Arrowheads indicate methylene blue‐positive cells. Scale bars, 5 μm. Mean ± SEM are shown from ≥ 3 biological and ≥ 5 technical replicates. n‐Values indicate number of cells counted. CFU, colony‐forming unit; MB, methylene blue; SEM, standard error of mean; UD, undiluted; WT, wild type.
For each thermotolerance experiment, we also included three important controls: A separate culture that was not subjected to conditioning or heat stress (30˚C in an orbital shaking incubator for 90 min), that was treated with heat conditioning alone (42˚C for 30 min in a water bath followed by 30˚C for 60 min in an orbital shaking incubator), or that was treated with heat stress alone (30˚C in an orbital shaking incubator for 60 min followed by 50˚C for 30 min in a water bath; see Figure 1b).
To measure cell viability, we assessed colony forming units (CFU) or stained cells with methylene blue immediately after thermotolerance assessment. For methylene blue staining, 100 μL of sample was mixed with 100 μL 0.1% methylene blue and incubated for 5 min at room temperature. Cells were then imaged using a Nikon Eclipse TiE inverted epifluorescence microscope outfitted with a 40×/0.95NA air objective lens and DsRi2 color CMOS digital camera (Nikon Instruments Inc., Melville, NY, USA). Methylene blue positive dead cells and remaining live cells (methylene blue negative) were counted using resulting micrographs and ImageJ software (Cell Counter plugin), and cell survival (% live cells in the total population) was calculated. Unless otherwise stated, at least three different yeast cultures (biological replicates) were studied for each condition, and ≥ 800 cells were counted using ≥ 5 micrographs of each sample. For the CFU assay, 100 μL of cultures were added to a sterile 96‐well plate and 10 μL was transferred in series to five adjacent wells, each containing 90 μL SC medium to conduct five 1:10 serial dilutions (from undiluted to a 1:100,000 dilution). Using a sterile 96‐pin stamp, cultures were then transferred to solid SC medium on a rectangular dish and incubated at 30˚C for 48 h prior to imaging. Two technical replicates were conducted for each experiment.
To determine the number of conditioning events required for maximum thermotolerance, we subjected cells to multiple rounds of conditioning (up to five), whereby each round consisted of incubating cells at 42˚C for 30 min followed by rest at 30˚C for 30 min prior to applying heat stress at 50˚C for 30 min.
To test effects of EVs on thermotolerance, EV fractions are collected from separate cultures of donor yeast cells using the EV isolation methods described in detail below. Concentrated EVs in phosphate‐buffered saline (PBS) were then added to 3 mL cultures containing naive, unstressed of recipient yeast cells in SC medium to a final concentration of 0.33 μg/mL unless otherwise indicated (see Figure 2b,c). Cultures containing EV samples were then incubated at 30˚C for 30 min in an orbital shaking incubator in place of conditioning. To disrupt EV membranes, EV preparations were subjected sonication (10 rounds of pulsing 1 min on, 1 min off for 5 min at 20% amplitude using a Fisher Scientific Model 500 Sonic Dismembrator) prior to adding them to naive recipient cells. To denature EV proteins and disrupt their membranes, EV samples were subjected to high heat (90˚C for 1 h). When testing EV samples collected from different conditions or mutants, amounts added were equated to 0.33 μg/mL. To compare effects of conditions or mutations on thermotolerance, we calculated differences between % cell survival observed with conditioning (or EV treatment) prior to heat stress and % cell survival observed with heat stress alone (see Figure S1). Resulting % differences were then normalised to the value obtained under standard conditions, that is, thermotolerance gained after heat conditioning wild type (WT) cells (Figures 1e; Figure 2d,e; Figure 4i; Figure 5d,e; Figure 7j,k) or after adding WT EVs (Figure 4j).
FIGURE 2.
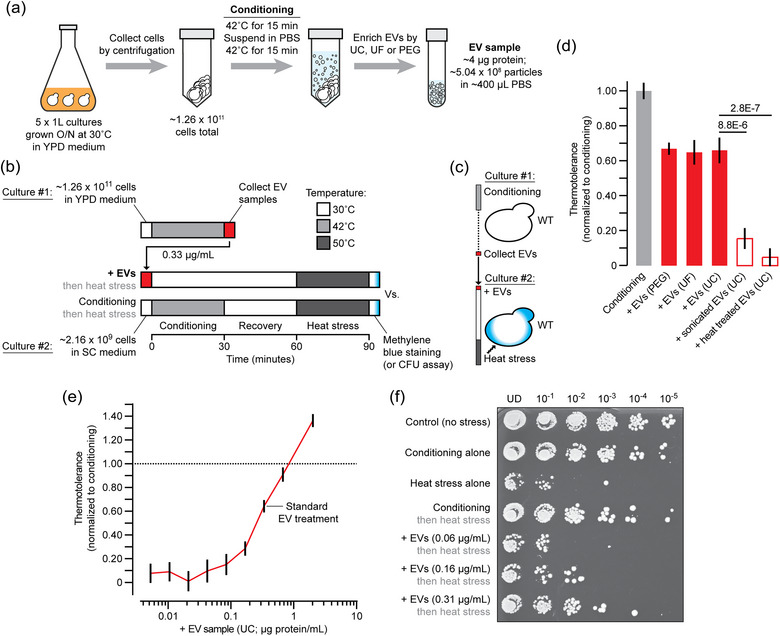
EV enriched samples provide thermotolerance. (a) Illustration of method used to collect EV enriched samples by ultracentrifugation (UC), ultrafiltration (UF), or polyethyleneglycol (PEG) addition after subjecting yeast cells to conditioning. (b) Illustration of protocol used to compare EV treatment to conditioning for thermotolerance assessment. (c) Illustration of experiment used to test EV‐mediated thermotolerance. (d) Thermotolerance was assessed using methylene blue staining when wild type cells were either conditioned (n = 1517) or treated instead with EV samples collected by PEG (1462), UF (1009) or UC (1213) from separate wild type yeast cultures subjected to conditioning alone. To disrupt their membranes, EV samples were subjected to sonication (n = 2771) or heat (90˚C, 30 min; 1838) before adding them to naïve wild type cells. (e) Prior to heat stress, wild type cells were treated with increasing concentrations of EVs isolated by ultracentrifugation and thermotolerance was assessed by methylene blue staining. n = 1273 (0.005), 987 (0.010), 1120 (0.021), 1371 (0.042), 1598 (0.083), 1253 (0.167), 1177 (0.33), 2042 (0.66) or 2201 (2.0 μg/mL). Mean ± SEM are shown from ≥ 3 biological and ≥ 5 technical replicates. n‐Values indicate number of cells counted. (f) Image of a plate after conducting the colony‐forming unit assay to assess thermotolerance of wild type yeast cells by conditioning or addition of EV samples collected by ultrafiltration. Culture dilutions are indicated. This is an example of three biological replicates and six technical replicates. CFU, colony‐forming unit; EV, extracellular vesicle; PBS, Phosphate buffered saline; YPD, yeast extract peptone dextrose; UD, undiluted.
FIGURE 4.
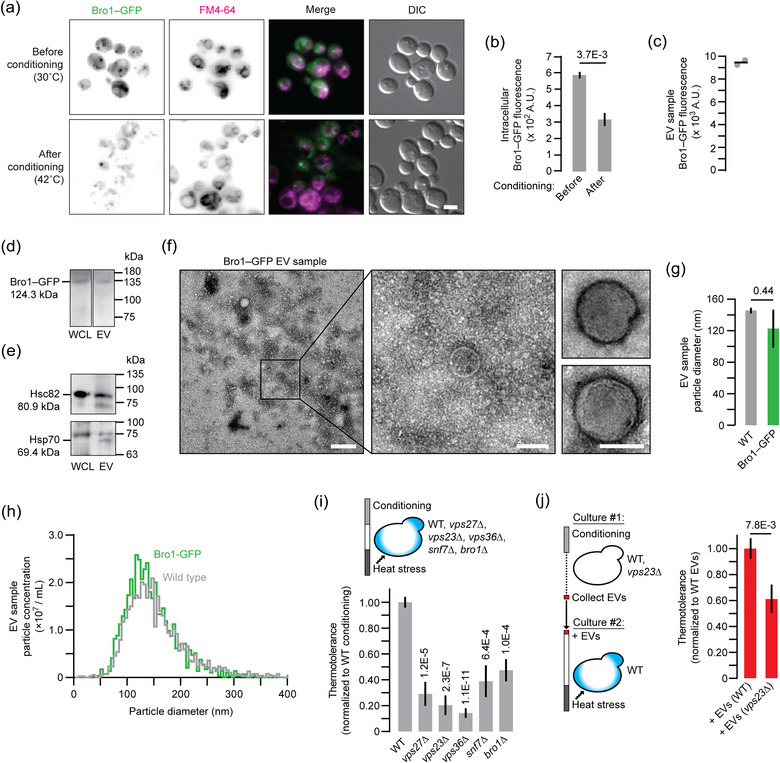
EVs released during conditioning contain Bro1 and require VPS23 for bioactivity. (a) Fluorescence micrographs of live yeast cells expressing Bro1‐GFP stained with FM4‐46 to label endosome and vacuole membranes. Cells were imaged before (control) or after heat conditioning. Scale bar, 1 μm. (b) Intracellular GFP fluorescence was quantified using micrographs shown in A. More than 120 cells were analysed for each condition. (c) Florescence intensity of EV samples collected from Bro1‐GFP cells after conditioning. Bar indicates mean. (d, e) Western blot analysis of whole cell lysates or EV samples collected from Bro1‐GFP cells after conditioning. Blots were probed with antibodies raised against GFP (d) or human orthologs of Hsc82 or Hsp70s (e). Predicted protein sizes and molecular weight marker locations are indicated. Images shown in d are from the same blot (same exposure time). (f) Transmission electron micrographs of EV samples collected from Bro1‐GFP cells after conditioning. Centre image shows a magnified view of the wide‐field image (left). Right images show additional examples of structures observed. Scale bars, 200 nm (left) and 100 nm (centre, right). (g, h) Median particle size (g) and distribution of particle concentrations based on size (h) are shown for nanoparticle tracking analysis (NTA) of EV samples collected by ultrafiltration from Bro1‐GFP cells after conditioning. (i) Using methylene blue staining, thermotolerance conferred by conditioning was measured for wild type (n = 1528), vps27∆ (1014), vps23∆ (1233), vps36∆ (1747), snf7∆ (1541) or bro1∆ (1335) cells. Data shown are normalised to wild type. (j) EV samples collected by ultrafiltration from conditioned wild type (n = 1465) or vps23∆ (1597) cells were added to naïve wild type cells prior to heat stress. Using methylene blue staining, thermotolerance was calculated for each condition. Data shown are normalised to wild type. Mean ± SEM are shown in b, i and j. Representative images or plots are shown in a, f and h. Data shown are from ≥ 3 biological and ≥ 5 technical replicates. EV, extracellular vesicle; WT, wild type.
FIGURE 5.
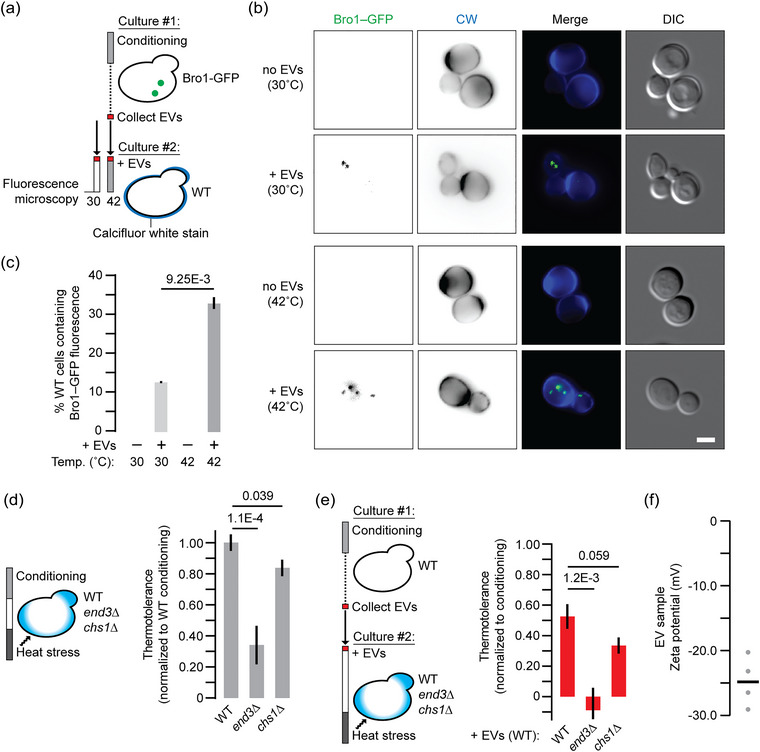
Endocytosis of EVs mediates thermotolerance. (a) Illustration of protocol used to assess EV uptake by yeast cells. (b) Fluorescence micrographs of live wild type yeast cells (that do not express GFP) with or without addition of EV samples collected from conditioned Bro1‐GFP cells. Wild type cells were stained with calcofluor white (CW) to label their cell walls and were examined after 30 min at 30˚C (control) or 42˚C (conditioning). Scale bar, 1 μm. (c) Fraction of cells containing intracellular GFP fluorescence was quantified (right) under each condition tested. (d) Using methylene blue staining, thermotolerance by conditioning was measured for wild type (n = 1147), end3∆ (1183) or chs1∆ (1732) cells. Data shown are normalised to wild type. (e) EV samples collected by ultracentrifugation from conditioned wild type cells were added to naïve wild type (n = 1356), end3∆ (1251) or chs1∆ (1273) cells prior to heat stress. Using methylene blue staining, thermotolerance was calculated for each condition. Data shown are normalised to wild type thermotolerance observed after conditioning. (f) Zeta potential values for EV samples collected from conditioned wild type cells. Bar indicates mean. Mean ± SEM are shown in c–e. Representative images are shown in b. Data shown are from ≥ 3 biological replicates and ≥ 5 technical replicates. CW, calcofluor white; EV, extracellular vesicle; SEM, standard error of mean.
FIGURE 7.
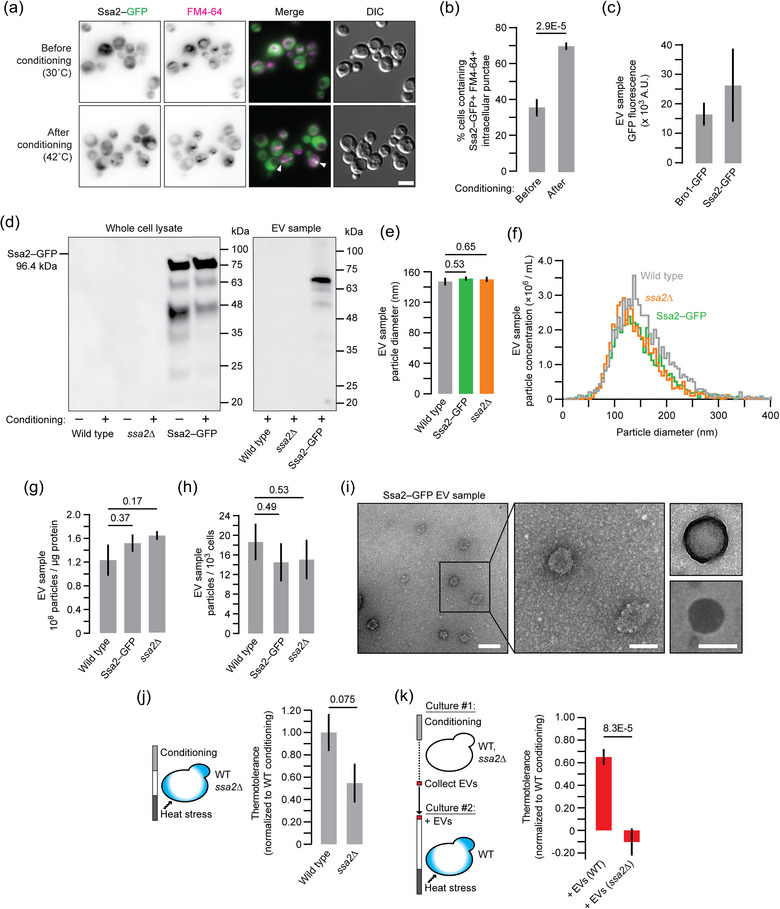
(previous page). Ssa2 contributes to EV‐mediated thermotolerance. (a) Fluorescence micrographs of live yeast cells expressing Ssa2‐GFP stained with FM4‐64 to label endosomes and vacuoles. Cells were imaged before and after conditioning. Arrowheads demark Ssa2‐GFP‐ and FM4‐64‐positive punctae. Scale bar, 5 μm. (b) Proportion of cells containing intracellular GFP‐ and FM4‐64‐positive puncta was quantified for each condition using micrographic data shown in a. (c) Florescence intensity of EV samples collected from conditioned Ssa2‐GFP or Bro1‐GFP expressing yeast cells. (d) Western blot analysis of whole cell lysates or EV samples collected by ultracentrifugation from wild type, ssa2∆ or Ssa2‐GFP cells with or without heat conditioning. Anti‐GFP antibody was used to detect Ssa2‐GFP. (e) Median size of EV particles collected by ultrafiltration from conditioned WT, Ssa2‐GFP or ssa2∆ yeast cells measured using nanoparticle tracking analysis (NTA). (f) Distribution of particle concentrations based on size from NTA of EV samples collected from conditioned WT, Ssa2‐GFP or ssa2∆ yeast cells. (g, h) Results from NTA analysis in f were used to calculate the number of particles per μg protein (g) or number of particles collected from every thousand cells (h) for each EV sample. (i) Transmission electron micrographs of EV samples from conditioned Ssa2‐GFP cells. Centre image shows a magnified view of the wide‐field image (left). Right images show additional examples of structures observed. Scale bars, 200 nm (left) and 100 nm (centre, right). (j) Wild type (n = 1649) or ssa2∆ (1305) yeast cells were conditioned and then subjected to heat stress. Cells were stained with methylene blue, imaged and counted to assess viability and thermotolerance was calculated for each strain. Data shown are normalised to wild type. (k) 0.33 μg/mL of EV samples collected by ultrafiltration from conditioned wild type (n = 1009) or ssa2∆ (1248) cells were added to separate, naïve wild type cell cultures prior to heat stress. Using methylene blue staining, thermotolerance was calculated for each condition. Data shown are normalised to wild type thermotolerance observed after conditioning (n = 818). Data obtained from treating cells with WT EV samples is also shown in Figure 2d. Mean ± SEM are indicated in b, c, g, h, j and k. Representative images or plots are shown in a, d, f and i. Data shown are from ≥ 2 biological and ≥ 5 technical replicates. EV, extracellular vesicle; SEM, standard error of mean; WT, wild type.
2.3. EV isolation
EVs were primarily isolated using differential ultracentrifugation (UC) using minimal information for studies of extracellular vesicles (MISEV) guidelines (Théry et al., 2018). Liquid seed cultures were prepared by inoculating colonies from streaked yeast plates into 15 mL of yeast extract peptone dextrose (YPD) medium in 125 mL Erlenmeyer flasks and grown at 30˚C for 8–10 h in an orbital shaking incubator at 200 rpm. These seed cultures were used to inoculate five experimental cultures grown in 1 L of YPD medium in 2 L flasks overnight at 30˚C in an orbital shaking incubator at 200 rpm. When cultures reached densities of 6–8 OD600nm/mL, they were transferred to 500 mL PPCO centrifuge bottles (Nalgene, ThermoFisher Scientific, Cat# 21020–050). Cells were harvested by centrifugation (Avanti J26XPI or Avanti J30I centrifuge, JA‐10 rotor, Beckman Coulter) at 3000 × g, max acceleration and deceleration, for 10 min at room temperature. Supernatants containing EVs indiscriminately released during growth were discarded, and cell pellets were recovered and washed twice with PBS. Washed cell pellets were then exposed to heat conditioning at 42˚C for 15 min in a water bath and then immediately resuspended in 30 mL of 0.22 μm filtered PBS and incubated for an additional 15 min at 42˚C. Concentrated yeast samples in PBS were transferred to 50 mL polycarbonate centrifuge bottles (Beckman Coulter, Cat# 357002) that were pre‐chilled on ice. All subsequent steps were carried out on ice or at 4˚C.
Yeast samples were next centrifuged (Avanti J26XPI or Avanti J30I centrifuge, JA‐25‐50 rotor, Beckman Coulter) at 5000 × g, max acceleration and deceleration, for 15 min. Supernatants were recovered and transferred to fresh, pre‐chilled 50 mL centrifuge bottles, and centrifuged again in the same centrifuge and rotor at 15,000 × g, max acceleration and deceleration, for 15 min. The resulting supernatant was recovered, filtered using pre‐chilled 0.22 μm filters to remove cell debris, and transferred to ultracentrifuge tubes (Ultra‐Clear, 14 × 89 mm, Beckman Coulter, Cat# 344059) on ice. EVs were pelleted by ultracentrifugation (Sorvall wX+ Ultra Series centrifuge, TH‐641 rotor, Thermo Scientific) at 100,000 × g, max acceleration and deceleration, for 1 h at 4˚C. Supernatants were aspirated and EV pellets were resuspended in 100 μL of ice‐cold, 0.22 μm filtered PBS. Resuspended EV pellets were kept on ice or at 4˚C prior to analysis or transferred to −20˚C for storage.
For EV isolation with polyethylene glycol (PEG), a similar protocol was used except after centrifugation at 15,000 × g, filtered supernatants in 50 mL conical centrifuge tubes on ice were treated with PEG 4000 to a final concentration of 10% (see Rider et al., 2016). Tubes were then inverted for 10 min using a nutator (Reliable Scientific) and incubated overnight, stationary, in a refrigerator at 4˚C. Samples were subjected to centrifugation (Sorvall ST 40, Thermo Scientific) at 3200 × g for 60 min at 4˚C, and supernatants were removed by inverting tubes for 5 min with occasional tapping to expel all liquid. EV pellets were resuspended in 100 μL of ice‐cold, 0.22 μm filtered PBS and kept on ice or at 4˚C prior to analysis or transferred to −20˚C for storage. In place of ultracentrifugation, EVs samples were prepared by ultrafiltration (UF): filtered supernatants were transferred to pre‐chilled, 15 mL 100 kDa Amicon centrifugal filtration units, subjected to centrifugation (3200 × g at 4˚C) for 15 min or until EV sample volume was approximately 400 μL, and then transferred to sterile 1.5 mL mircocentrifuge tubes on ice prior to analysis.
2.4. Bradford assay
To estimate EV concentrations prior to analysis, we conducted Bradford assays to measure protein content of samples. Two hundred microlitre of Coomassie reagent (Coomassie Plus Blue G‐250, ThermoScientific, Cat# 23236) was added to wells of a 96‐well plate, standard curves were generated using purified BSA (bovine serum albumin) and 20 μL of EV samples were added to test wells. Absorbance at 595 nm was measured using a BioTek Synergy H1 multimode plate reader (Agilent Technologies, Winooski, VT, USA), and EV sample protein content was determined by comparing absorbance values to the standard curve.
2.5. Fluorometry
EV samples isolated from conditioned yeast cells expressing GFP‐tagged Bro1 or Ssa2 were analysed by fluorometry: 100 μL of EV samples were added to a black conical‐bottom 96‐well plate and fluorescence intensity at 470 nm excitation and 510 nm emission was measured using a BioTek Synergy H1 multimode plate reader. Reported values are background corrected from values obtained from EV samples collected from conditioned wild type (no GFP) cells.
2.6. Transmission electron microscopy
EV samples were fixed by diluting them 1:1 with 2.5% glutaraldehyde in 0.1 M sodium cacodylate. Fixed EVs (5 μL) were then dropcast onto glow discharged carbon‐coated grids and allowed to adsorb for 5 min at room temperature. EV‐bound grids were washed twice with glycine and then rinsed four times with ultrapure pure water. Mounted EVs were then negative stained with 1% phosphotungstic acid (1 min, room temperature), blotted with filter paper and airdried (1 h, room temperature). Grids were then imaged at 80−120 kV using a Talos L120C transmission electron microscope (Thermo Fisher Scientific, Toronto, Canada). Each sample was imaged ≥ 3 times (technical replicates) and samples were prepared from ≥ 3 different yeast cultures (biological replicates).
2.7. Atomic force microscopy
EV samples (collected from yeast cells expressing Bro1‐GFP subjected to heat conditioning) were diluted 1:5 in PBS to a final volume of 100 μL, added to a freshly cleaved mica sheet (Ted Pella Inc., Redding, CA, USA) and airdried overnight at room temperature. Samples were then imaged using a multimode atomic force microscope and Nanoscope IIIa scanning probe controller (Veeco Metrology Instruments, Plainview, NY, USA) configured with a 10× objective lens (Nikon Instruments Inc., Melville, NY, USA) and proprietary Nanoscope v5.30 acquisition software. Samples were scanned in air by tapping mode using a silicon probe (Tap200AI‐G; Budget Sensors, Sofia, Bulgaria) with a resonant frequency of 300 kHz and force constant of 40 N/m. Scanning rate was fixed at 1.00 Hz and amplitude set‐point was adjusted to 75% of the pop‐off voltage. Micrographs were prepared using NanoScope v1.5 analysis software. Each sample was imaged ≥ 3 times (technical replicates) and samples were prepared from ≥ 3 different yeast cultures (biological replicates).
2.8. Particle size, concentration and zeta potential measurements
To measure particle size and concentrations, we conducted nanoparticle tracking analysis (NTA) using a ZetaView nanoparticle tracking analysis instrument (Particle Metrix, Ammersee, Germany) with software version 8.0.5.14 SP7. EV samples were either undiluted or diluted between 1:10 to 1:5000 in sterile, tissue culture grade PBS. One millilitre of diluted or undiluted EV samples were manually loaded with a 1 mL syringe and samples were slowly injected until conditions appeared optimal for acquisition. ZetaView instrument settings were as follows: Temperature (25˚C), laser λ (488 nm), filter λ (scatter) sens (85), shutter (100), FR (30), and trace length (15). Unless otherwise reported, EV samples from ≥ 3 different yeast cultures (biological replicates) were examined using each method. Prior to measuring particle surface charge, the same NTA instrument was flushed with 5 mL 0.22 μm filtered, purified water. EV samples were diluted 1:100 in water and zeta potential was measured using default instrument settings.
2.9. Live‐cell fluorescence microscopy
To assess EV release and the intracellular location of Bro1 or Ssa2, live yeast cells expressing GFP‐tagged Bro1 or Ssa2 were stained with FM4‐64 to label membranes of endocytic compartments including endosomes, multivesicular bodies and vacuoles. Cultures were grown overnight in 5 mL YPD medium at 30˚C in an orbital shaking incubator at 200 rpm. Cells were centrifuged (Sorvall ST 40, Thermo Scientific) at 3500 × g for 1 min and resuspended in YPD medium containing 3 μM FM4‐64 and incubated at 30˚C for 1 h. Cells were then centrifuged again, pellets were washed and resuspended in PBS, and then incubated at 30˚C for 30 min or subjected to heat conditioning (42˚C, 30 min) immediately prior to imaging.
To assess EV uptake, live yeast (devoid of GFP) were stained with calcofluor white to label their cell walls and identify cell perimeters (see Zhao et al., 2019). Cultures were grown overnight in 5 mL SC medium at 30˚C in an orbital shaking incubator at 200 rpm. Cells were centrifuged (Sorvall ST 40, Thermo Scientific) at 3500 × g for 1 min, resuspended in 100 mM Tris, pH 9.5 containing 1 mg/mL calcofluor white (Sigma–Aldrich, Oakville, Canada), and incubated at room temperature for 20 min. Cells were then washed and resuspended in 80 μL SC medium prior to addition of 1 μg EVs collected from a separate culture of yeast expressing Bro1‐GFP after heat conditioning. Samples were then incubated at 30˚C or 42 ˚C for 30 min immediately prior to imaging.
Samples were visualised using a Nikon Eclipse TiE inverted microscope equipped with 100× CFI Apo TIRF (total internal reflection fluorescence) 1.49 NA objective lens, Photometrics Evolve 512 EMCCD camera, 488 nm and 561 nm 50 mW solid state lasers, TIRF illumination unit, 520/75 and 630/75 nm bandpass emission filters and proprietary NIS Elements acquisition software (Nikon Instruments Inc., Melville, NY, USA). Cross sectional micrographs were recorded 1 μm into samples. More than three separate yeast cultures were imaged (biological replicates) and ≥ 300 cells were analysed using ≥ 10 micrographs for each condition.
2.10. Western blot analysis
Whole cell lysates were prepared by collecting 1 OD600nm unit of yeast cells grown in liquid SC medium to mid‐log phase by centrifugation (Sorvall ST 40, Thermo Scientific) at 3500 × g for 5 min at room temperature. Pellets were resuspended in 10% TCA (trichloroacetic acid), transferred to 1.5 mL centrifuge tubes, and incubated at room temperature for 1 h. Samples were then centrifuged (Eppendorf 5424 or Eppendorf 5147) at 12,000 × g for 5 min, pellets were washed with 0.1% TCA, centrifuged again, and resuspended in boiling buffer (1.5 M Tris pH 8.5, 0.5 M EDTA, 10% SDS). Samples were then subjected to 5 min in a cell disruptor (Disruptor Genie, Scientific Industries). Samples were then incubated at 65˚C for 30 min, urea buffer (150 mM Tris pH 6.8, 6 M Urea, 6% SDS, 40% Glycerol, 100 mM DTT, 0.01% Bromophenol blue) was added, samples were disrupted again and incubated at 65˚C for 30 min prior to analysis by SDS‐PAGE.
To analyse EV fractions, samples were mixed 1:1 with RIPA buffer (25 mM Tris‐HCl pH 7.6, 150 mM NaCl, 1% NP‐40, 1% sodium deoxycholate, 0.1% SDS) supplemented with protease inhibitors (1 mM PMSF, 0.1 mM pefablock, 0.08 mM leupeptin, 0.4 mM pepstatin) and incubated at 4˚C for 15 min then 80˚C for 15 min. Ten percent TCA was added, and the sample was incubated at 4˚C for 1 h. The pellet was then washed with 0.1% TCA, resuspended in 1× urea buffer (1.5 M Tris, 6 M urea, 6% SDS, 40% glycerol, 0.01% bromophenol blue) and incubated at 65˚C for 15 min prior to analysis by SDS‐PAGE.
Protein samples (10–50 μg) were separated by 10% SDS‐PAGE, transferred to PVDF membranes, and incubated with 5% skim milk in 1× PBST on a nutator (Reliable Scientific) for 1 h at room temperature. Membranes were then transferred to 1% milk in 1× PBST containing primary antibody (1:1000) and incubated on a nutator at 4˚C for 24 h. Membranes were washed 5 times with 1× PBST, incubated for 45 min on a nutator at room temperature with 1% milk 1 × PBST containing affinity purified goat anti‐rabbit antibody (1:10,000) conjugated to horseradish peroxidase, and then washed an additional 5 times. Chemiluminescence of stained membranes was detected using a GE Amersham Imager 600 instrument (GE HealthCare, Piscataway, USA) and Amersham ECL Select Detection Reagent (Cytiva). Blots shown are best representatives of ≥ 3 samples prepared from separate yeast cultures (biological replicates), each analysed ≥ 2 times (technical replicates). Recombinant rabbit IgG antibodies raised against GFP (B2; Cat # ab290) or Hsc82 (Cat # ab30920), or mouse monoclonal IgM antibody against Hsp70 (2A4; Cat # ab5442) were purchased from Abcam (Toronto, Canada). Horseradish peroxidase‐labelled affinity purified goat IgG antibodies to rabbit IgG (Cat # 5450‐0010) or to mouse IgM (Cat # 5220‐0343) were purchased from SeraCare (Milford, USA).
2.11. Proteomic analysis by liquid chromatograph tandem mass spectrometry
EV samples (2 μg) collected from Bro1‐GFP expressing yeast cells subjected to heat conditioning were resolved by SDS‐PAGE and stained with Coomassie brilliant blue R‐250 to visualise protein bands for excision. Gel pieces were added to 200 μL 50 mM NH4HCO3 containing 10 mM dithiothreitol (DTT) and incubated at room temperature for 30 min. Two hundred microlitre of 50 mM NH4HCO3 containing 50 mM iodoacetamide was added and samples were incubated at room temperature for 30 min. Gel pieces were then washed at room temperature with 50 mM NH4HCO3 at room temperature for 15 min, 25 mM NH4HCO3 containing 5% acetonitrile (ACN) for 15 min, 25 mM NH4HCO3 containing 50 % ACN for 30 min (twice), and 100% ACN for 10 min. Gel pieces were then dried at 43˚C using a Savant SpeedVac Concentrator (Thermo Fisher Scientific, Toronto, Canada) and rehydrated in 25 mM NH4HCO3 containing porcine pancreas trypsin (Sigma–Aldrich, Oakville, Canada) at 30˚C for 12–14 h. Digested peptides were extracted by incubating samples with 60% ACN containing 0.5% formic acid, then dried at 43˚C and stored at −20˚C. Immediately prior to proteomic analysis, samples were resuspended in 10 μL 5% methanol containing 0.1% trifluoroacetic acid and injected into a Thermo LTQ Orbitrap Velos mass spectrometer configured with a Thermo EASY nLC II liquid chromatography system (Thermo Fisher Scientific, Toronto, Canada). Data was analysed using proprietary Proteome Discoverer 2.4 software. For proteomics analysis, reported proteins have a false discovery rate of < 1%. Relative protein abundance was estimated using consensus workflow precursor and reporter ions quantifier nodes. Proteomics data is provided in Supplementary Information.
2.12. Data analysis and presentation
Micrographs were processed using ImageJ and Adobe Photoshop CC software. Images presented were adjusted for brightness and contrast, inverted and sharpened with an unsharp masking filter. Image group identities were blinded for all micrographic analysis. GFP intensity was measured using the ImageJ Cell Counter plugin. A 4 × 4‐pixel region of interest was used and data shown was backgrounded subtracted. For cell viability assays, proportion of methylene‐blue‐positive dead cells were counted using the ImageJ Cell Counter plugin. Thermotolerance metric data are reported as mean ± SEM and compared using Welch's t‐tests. Unless indicated otherwise, all other data are reported as mean ± SEM and compared using Student's two‐tailed t‐test. All graphs were plotted using GraphPad Prism software version 9.5.1. Gene ontology (GO) analysis of proteomics data was conducted using the PANTHER (Protein Analysis Through Evolutionary Relationships) knowledgebase version 18.0 (https://www.pantherdb.org). Data was compared to the entire S. cerevisiae proteome or a previously published EV proteome dataset (Zhao et al., 2019).
3. RESULTS
3.1. EVs may contribute to thermotolerance in S. cerevisiae
Prior to our study, we designed an experimental paradigm to test involvement of EVs in thermotolerance with MISEV (minimal information for studies of extracellular vesicles) guidelines in mind (Théry et al., 2018; Figure 1a,b). This included (1) using high‐density yeast cultures (∼20 OD600nm units of cells collected during mid‐log growth in 3 mL liquid SC medium) to ensure cells were in close enough contact to efficiently share EVs, (2) washing cells prior to applying stressors to collect extracellular particles released only during stress, and (3) optimising a conditioning step (42˚C for 30 min, then 30˚C for 30 min recovery) to confer thermotolerance prior to subjecting cells to a subsequent lethal heat stress (50˚C for 30 min). We then spotted serial dilutions of cultures on solid SC medium, outgrew live cells and used the number of CFUs to assess survival (Figure 1c). We found that heat stress applied alone substantially reduced cell survival as compared to no stress or applying the conditioning step by itself. Whereas conditioning cells prior to heat stress improved cell survival.
To quantify effects of conditioning on cell survival, in place of the CFU assay, we stained stressed cultures with methylene blue (MB) to detect dead cells, imaged them and counted the number of MB‐negative live cells. In Figure 1d, we confirm that the conditioning step is not lethal as 98 ± 1% of cells survive compared to untreated cells grown under normal culture conditions (30˚C; 97 ± 1%). Only 63 ± 3% of cells survive after lethal heat stress is applied. However, when yeast are conditioned first before applying lethal heat stress 82 ± 3% survived, demonstrating a significant thermotolerant effect, that is, ∼ 20 % more cells survived when conditioning was applied. A single dose of heat conditioning was sufficient to provide maximal thermotolerance, as we applied up to five doses in tandem to the same yeast culture and all showed similar protective effects (Figure S2a). We also tested the time of recovery after heat conditioning from 0 up to 120 min and the maximum protective effect was observed at 30 min and this was sustained up to at least 120 min (Figure S2b). Thus, a single dose of heat conditioning was sufficient to induce lasting thermotolerance. We applied this treatment as a positive control to assess thermotolerance in future experiments, whereby the difference between cell survival with or without conditioning prior to heat stress was used as a standard to normalise data from test conditions (see Figure 1d).
To implicate EVs in thermotolerance, we collected the extracellular medium present only during conditioning (42˚C for 30 min). We then added this media, in place of conditioning, to naïve (untreated) cells and found that it was sufficient to partially confer thermotolerance (Figure 1e). Media collected from cells at 30˚C for 30 min (no conditioning; control) was less effective, suggesting that cells share an extracellular agent during conditioning for thermotolerance.
We next enriched EVs from the extracellular medium containing bioactivity using three methods: differential ultracentrifugation, polyethylene glycol treatment or ultrafiltration. However, because the time window for EV collection was only 30 min, we increased yeast culture volumes to acquire sufficient EVs for our experiments using a modified conditioning protocol (Figure 2a). EV samples were then added to a second, naïve culture of yeast (∼20 OD600nm of cells in 3 mL SC medium) in place of conditioning to assess their effects on thermotolerance (Figure 2b,c). Using methylene blue staining to measure cell survival, we found that adding 0.33 μg/mL of EV samples to naïve cells conferred partial thermotolerance as compared to standard conditioning (Figure 2d). EV isolation method (PEG, ultrafiltration, or ultracentrifugation) did not affect outcome, suggesting that method–dependent impurities probably do not contribute to observed responses. In support, subjecting EV samples to extreme heat to denature all proteins and melt EV lipid bilayers abolished thermotolerance, as did sonication to exclusively disrupt EV membranes (without effects on soluble proteins; Figure 2d), suggesting that intact membrane‐bound particles largely contribute to this effect.
We next determined if EV samples are capable of completely restoring thermotolerance gained by conditioning. To do so, we added increasing concentrations (up to 2.0 μg/mL) of EV samples prepared by ultracentrifugation to naïve yeast cultures and measured thermotolerance relative to standard conditioning (Figure 2e). We found that the highest concentration tested provided greater thermotolerance (∼1.40 times) and estimate that approximately 0.75 μg/mL of EV sample provides equal thermotolerance when compared to standard conditioning treatment. We repeated this experiment with fewer EV sample concentrations using the CFU assay to assess cell survival and made similar observations (Figure 2f) validating our results. Thus, we conclude that yeast cells release extracellular, membrane‐bound particles during conditioning for thermotolerance.
3.2. Exosomes, a subclass of EVs, likely contribute to thermotolerance
To better characterise EV samples that confer thermotolerance, we fixed and stained the bioactive fractions collected after conditioning prior to visualising them using transmission electron microscopy (TEM) and observed small structures resembling round particles with diameters < 200 nm (Figure 3a). Their presence was confirmed by atomic force microscopy, although topologies resembling circular particles were much smaller and deformed, probably due to dehydration necessary for visualisation (Figure 3b). Addition of detergent (Triton X‐100) to EV samples abolished the signal detected by atomic force microscopy (AFM) confirming that the round structures observed are likely membrane‐bound particles or vesicles.
FIGURE 3.
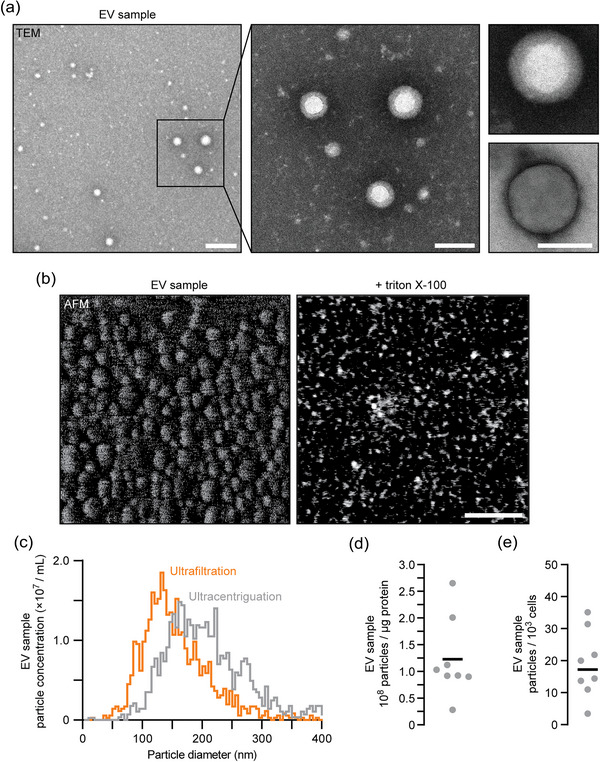
Visualisation and sizing of yeast EVs released during heat conditioning. (a) Transmission electron micrographs of EV samples collected by ultracentrifugation from wild type cells subjected to conditioning. Centre image shows a magnified view of the wide‐field image (left). Right images show additional examples of structures observed. Scale bars, 200 nm (left) and 100 nm (centre, right). () Atomic force tomographs of EV samples collected by ultracentrifugation from conditioned wild type cell cultures. Detergent (1% Triton X‐100) was added to disrupt membranes. Scale bar, 200 nm. (c) Particle size and concentration measurements of EV samples collected by ultracentrifugation or ultrafiltration conducted by nanoparticle tracking analysis (NTA). (d, e) We used results from NTA analysis of EV samples to calculate the number of particles per μg protein (d) or number of particles released from every thousand cells (e) for each EV sample collected by ultracentrifugation from conditioned wild type yeast. Bars indicate mean. Representative data shown in a, b and c are from ≥ 4 biological replicates. EV, extracellular vesicle.
EV sub‐types are primarily classified by size to help determine potential origin and function, for example, microvesicles have diameters from 100 to 1000 nm, exosomes 30 to 200 nm (Mathieu et al., 2019; van Niel et al., 2018). Thus, to further characterise EV samples collected by ultracentrifugation or ultrafiltration, we conducted nanoparticle tracking analysis (NTA) to measure particle size and observed median diameters of 165.8 ± 6.0 nm and 127.9 ± 8.3 nm, respectively (n = 3; Figure 3c), suggesting that a subset of small EVs such as exosomes may mediate the observed responses.
To better understand the extent of cell‐to‐cell EV transfer during conditioning, we determined particle concentrations using NTA (Figure 3c) and determined that EV samples contained an average of 3.28 ± 0.87 × 10⁸ total particles/mL or 1.26 ± 0.26 × 10⁸ particles/μg protein (Figure 3d). When considering our thermotolerance assay, we test approximately 2.16 × 10⁹ yeast cells (60 OD600nm units of cells in 3 mL SC medium, assuming 3.6 × 10⁷ cells/OD600nm unit) and the standard EV treatment contains 1.26 × 10⁸ particles (0.33 μg/mL in a 3 mL culture) which suggests that ∼6 particles added to every 100 recipient cells elicits the observed response. We also used this particle concentration measurement to calculate the number of particles released by large cultures of donor cells and found that ∼17 particles are released and collected from every 1000 donor cells during a 30‐min conditioning period (Figure 3e).
Besides size, a key feature that defines mammalian exosomes is enrichment of the biomarker ALIX, a protein thought to function with ESCRTs for exosome biogenesis (Baietti et al., 2012). Although uncharacterised in context to EV biology, S. cerevisiae possesses an ALIX ortholog called Bro1 (Bissig & Gruenberg, 2014). Thus, we tagged genomic BRO1 with GFP and monitored it using fluorescence microscopy to determine if Bro1‐positive exosomes are shared during conditioning. We stained cells with FM4‐64, a marker of endosome and vacuole membranes, and found that Bro1‐GFP localises to puncta adjacent to vacuoles within live, untreated yeast cells before conditioning (Figure 4a). As previously reported, these puncta likely represent intracellular sites of exosome biogenesis called multivesicular bodies (Bissig & Gruenberg, 2014). After conditioning, we find less Bro1‐GFP fluorescence within cells, suggesting that it may be released into the extracellular medium presumably within exosomes (Figure 4a,b). This was confirmed by measuring GFP fluorescence of EV‐enriched samples prepared by ultracentrifugation from the extracellular medium after conditioning (Figure 4c).
In support, Bro1‐GFP protein was detected in whole cell lysates and EV enriched samples by western blot analysis (Figure 4d). Using validated antibodies raised against human orthologs, we also probed blots for HSP70 and HSP90 proteins, which were previously identified in EVs collected from S. cerevisiae (Rodriguez et al., 2014). As predicted, bands with predicted molecular weights of HSPs are found in lysates and EVs (Figure 4e), confirming that known EV proteins are present in EV samples collected from Bro1‐GFP cells after conditioning. We next confirmed the presence of small, vesicle‐like particles in these samples by TEM (Figure 4f) and by NTA (Figure 4g,h), noting that tagging Bro1 with GFP did not affect particle size or numbers, suggesting its function in exosome biogenesis is unperturbed. We conclude that the ALIX ortholog Bro1 is present in EV enriched samples and is released from yeast cells during thermotolerance conditioning.
Another unique feature of exosomes is that their biogenesis relies on ESCRTs. These include 4 multi‐subunit complexes (ESCRT−0, –I, –II and –II) and accessory proteins (e.g., Bro1) that function in series to select and load exosome cargoes as well as drive membrane perturbations necessary for vesicle formation (Hurley, 2010; Gurung et al., 2021). Thus, to further implicate exosomes in the observed thermotolerance, we knocked out genes encoding key components of ESCRT–I (vps23∆), –II (vps36∆) or –III (snf7∆) as well as Bro1 (bro1∆) to block exosome biogenesis and determined if thermotolerance persisted. All mutants show significant defects in thermotolerance upon conditioning suggesting that ESCRTs and Bro1 contribute this response (Figure 4i). To demonstrate that this loss relates to defects in exosome biogenesis, we collected EV samples from conditioned cells missing VPS23, a component of ESCRT–I important for exosome cargo sorting (Hurley, 2010), and added them to naïve wild type cells to determine if they conferred thermotolerance. As expected, EV samples collected from vps23∆ cells showed a significantly smaller effect compared to those isolated from WT cells (Figure 4j). Thus, Vps23 seems to contribute in part to thermotolerance mediated by EV enriched preparations. All things considered, these results suggest that EVs shared between S. cerevisiae during heat stress conditioning are likely exosomes because they are relatively small, contain the ALIX ortholog Bro1 and require VPS23 for function.
3.3. Endocytosis of exosomes is needed for thermotolerance
For message delivery, exosome membranes are thought to fuse with the plasma membrane or are endocytosed and then back–fuse with endosome membranes to release their lumenal contents into the cytoplasm (van Niel et al., 2018). To determine the method of delivery used for EV‐mediated thermotolerance, we added Bro1‐GFP‐positive EV enriched samples to live, naïve yeast cells that do not express GFP and monitored their endocytosis by fluorescence microscopy (see Figure 5a). Calcofluor white, a fluorescent dye that labels the cell wall, was used to mark the perimeter of cells to determine if observed GFP was intracellular. As expected, Bro1‐GFP‐positive puncta (presumably endosomes) were observed within cells, and the proportion of cells containing Bro1‐GFP increased with conditioning (Figure 5b,c). To confirm that endocytosis is required for thermotolerance, we knocked out END3, which encodes a late coat protein responsible for clathrin‐mediated endocytosis (Giardina et al., 2014; Lu et al., 2016), and hypothesised that thermotolerance is impaired in these mutants. In support, conditioning of end3∆ cells provided little thermotolerance (Figure 5d), as they presumably can release EVs but not receive them. Also, EV samples collected from conditioned wild type cells failed to provide thermotolerance to naïve end3∆ cells (Figure 5e). We also measured zeta potential to estimate surface charge of particles within EV enriched samples (Figure 5f) and found that it is lower than –20 mV suggesting particles are colloidally stable (i.e., are less prone to aggregation) for efficient endocytosis by recipient cells.
In addition, S. cerevisiae like other yeasts have a porous cell wall that EVs must pass to convey signalling (Zhao et al., 2019). To demonstrate that the cell wall does not obstruct exosome passage, we knocked out CHS1, which encodes chitin synthase I required for cell wall biosynthesis (Ziman et al., 1996), to deconstruct the cell wall and examined whether this affected thermotolerance. As expected, deleting CHS1 had no effect on conditioning mediated thermotolerance (Figure 5d) and when EV samples from conditioned wild type cells were added to naïve chs1∆ cells, they continued to support thermotolerance (Figure 5e). Together, these results suggest that extracellular factors that include yeast exosomes pass the cell wall and require endocytosis to mediate thermotolerance signalling.
3.4. Ssa2, a Hsp70 ortholog, within exosomes is required for thermotolerance
Many heat shock proteins (HSPs) are detected in EV enriched samples collected from all organisms studied under varying conditions, including from S. cerevisiae (Mathivanan & Simpson, 2009; Mencher et al., 2020; Parreira et al., 2021; see Figure 4e). However, it is unclear if they may contribute to thermotolerance in yeast, and if so, the specific HSPs that contribute to this response are unknown. To help identify bioactive HSPs, we conducted proteomics analysis by mass spectrometry on EV enriched samples collected during heat conditioning (Figure 6; see Supplementary Information).
FIGURE 6.
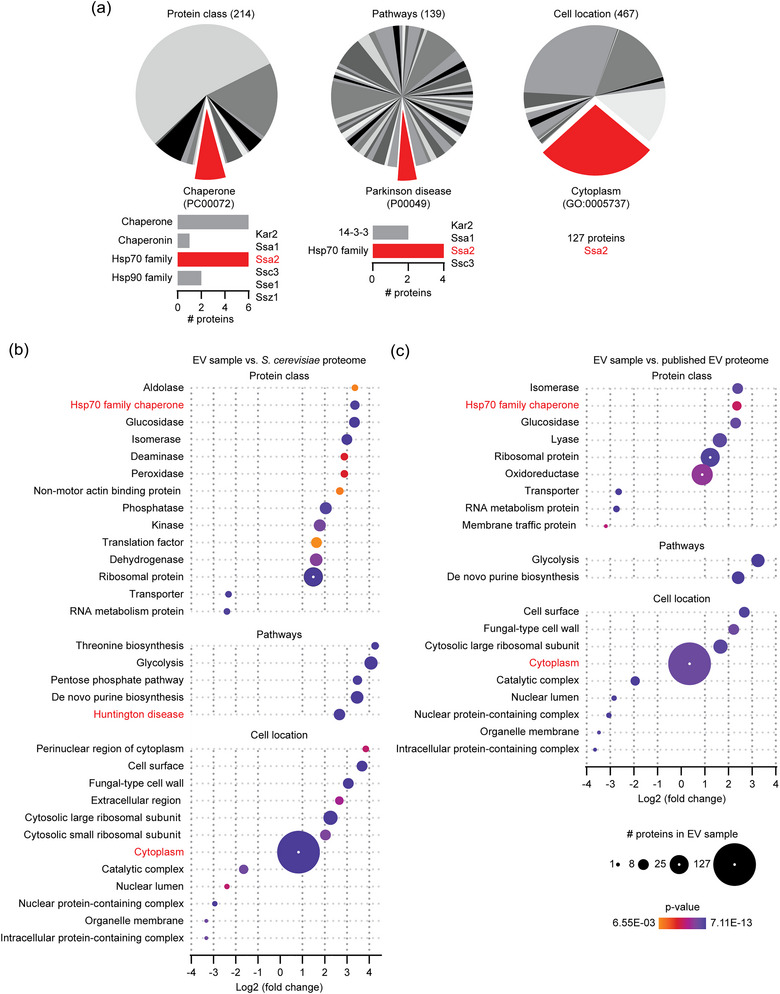
Gene ontology analysis of proteomics data from EV samples. (a) Gene ontology (GO) analysis of 266 proteins identified in EV samples collected by ultracentrifugation from conditioned wild type cells using the PANTHER 18.0 knowledgebase. Distribution of classifications for protein class, pathways and cell locations are shown. Total number of entries are indicated in paratheses. Categories of interest are shown in red; all categories are shown in Figures S3 and S4. Bar graphs (below) indicate the number of proteins found in each highlighted subcategory. Hsp70 family proteins identified in samples are listed, for example, Ssa2. (b, c) Proteins identified in EV samples were compared to the entire S. cerevisiae proteome (b) or a published EV proteomics dataset (c; Zhao et al., 2019). All significantly enriched or depleted GO subcategories found in our EV samples are shown. Size of circular points indicates number of protein entries identified in our EV samples. Categories of interest are highlighted in red. Data shown are from 2 biological replicates. See Supplementary Information for a list of all proteins identified and their GO classifications. EV, extracellular vesicle.
We identified 266 proteins in total and conducted gene ontology (GO) analysis focusing on protein class, pathway, and cell location to assess potential function and intracellular origin (Figure 6a). Based on GO Protein Class annotations, we found that most proteins were categorised as metabolic interconversion enzymes (117), translational proteins (37) or chaperones (15). Given their established roles in thermotolerance, we focused on the latter that includes six HSP70 paralogs: Kar2, Ssa1, Ssa2, Ssc3, Sse1 and Ssz1. GO Pathway analysis revealed that glycolysis (12), de novo purine biosynthesis (11), Huntington disease (9), the pentose phosphate pathway (6) and Parkinson's disease (6) show the highest number of entries. Notably, four of the HSP70s identified are orthologous to human proteins associated with Parkinson's disease and most are associated with the cytoplasm (GO Cell Location), where they may interact with the EV biogenesis machinery and be sorted into the lumen of newly formed vesicles. To determine protein types that are enriched in EVs released during conditioning, we compared this dataset to the entire S. cerevisiae proteome (Figure 6b) or to a published EV proteomic dataset generated from samples collected from unstressed S. cerevisiae (Figure 6c; Zhao et al, 2019). Of the GO terms that were significantly enriched or depleted, we again found that metabolic enzymes (e.g., aldolases, glucosidases, lyases, oxidoreductases) and translational proteins (ribosome subunits) were enriched. Of the chaperones, only Hsp70 family proteins were enriched, suggesting they may function in EV‐mediated thermotolerance. Notably, cytoplasmic proteins were enriched (e.g. HSP70s, which should localise to the EV lumen) whereas nuclear and organelle membrane proteins were depleted from EV samples, suggesting that preparations were likely free of cellular debris.
Based on this analysis, we chose to further study Ssa2, an HSP70 ortholog, because this chaperone class is enriched in our EV samples and their presence is detected by western blot (see Figure 4e), and human orthologs may underlie, at least in part, the pathogenesis of neurodegenerative diseases. To track Ssa2 protein in live yeast cells and EVs, we studied a strain with GFP inserted behind SSA2 in the genome. We first stained cells with FM4‐64 to label endosomes and vacuoles and visualised them using fluorescence microscopy. We found that Ssa2–GFP localised to FM4‐64‐positive puncta adjacent to vacuoles after conditioning, but not before (Figure 7a,b). These resemble Bro1‐GFP‐positive structures that are likely intracellular sites of exosome biogenesis. Like Bro1‐GFP, EV enriched samples collected after conditioning showed Ssa2‐GFP fluorescence (Figure 7c) and western blot analysis confirmed that it was present in this fraction, although it migrated faster than predicted by SDS‐PAGE (Figure 7d). We also noted that tagging Ssa2 with GFP had no effect on particle size (by NTA; Figure 7e,f), on protein content in EV samples (Figure 7g), on particle release by donor cells (Figure 7h) or on particle morphology (by TEM; Figure 7i), suggesting the GFP tag did not have a measurable effect on EV biogenesis or release.
We next determined if Ssa2 contributed to thermotolerance by knocking it out and examining cell survival by methylene blue staining. We found that ssa2∆ cells showed a measurable (but not statistically significant; P = 0.07) loss of thermotolerance after conditioning (Figure 7j). This observation may be explained by upregulation of other, cytoplasmic Hsp70 orthologs to compensate for loss of Ssa2, but it remains unclear if EVs contribute to the remaining thermotolerance. To resolve the latter, we collected EV enriched samples from ssa2∆ cells after conditioning. After confirming the mutation has no measurable effect on EV particle size, protein content of EV samples, or particle release (Figure 7e–h), we added EV samples collected from conditioned ssa2∆ cells to naïve wild‐type cells and found that thermotolerance is abolished (Figure 7k). Thus, we conclude that Ssa2 within EV enriched samples, in part, is important for thermotolerance in S. cerevisiae.
4. DISCUSSION
This study is one of the first to characterise EVs shared between S. cerevisiae cells and demonstrate their role in thermotolerance: Transient exposure to heat (i.e., conditioning), sufficient to induce the canonical heat‐shock response in yeasts (Lindquist & Craig, 1988), leads to a prolonged change in physiology within the cell population that promotes community survival when challenged with potentially lethal heat stress (Figure 1). This thermotolerance is conferred, at least in part, by EV enriched samples (Figure 2) that contain membrane‐encapsulated particles which likely include exosomes because they have relatively small diameters (Figure 3), they contain the ALIX ortholog Bro1, and they rely on the ESCRT–I subunit Vps23 for bioactivity (Figure 4). Bro1‐GFP, presumably contained within exosomes, is released by donor cells (Figure 4) and efficiently taken up by recipient cells (Figure 5) during conditioning. Proteomics analysis revealed that HSP70 chaperone proteins were enriched in EV samples collected after conditioning (Figure 6) and we confirmed the presence of one paralog, Ssa2, which is required for bioactivity (Figure 7). We speculate that Ssa2 is sorted into exosomes released by donor cells and deposited into the cytoplasm of recipient cells after exosome–endosome membrane fusion. Here, it may contribute to the canonical heat stress response or drive other signalling mechanisms to prevent toxicity and ensure colony survival when confronted with heat stress.
Our new experimental paradigm to study thermotolerance facilitated this discovery, whereby a specific pool of small EVs was collected only during stress (30 min), overcoming frequent issues with EV heterogeneity and missing physiological context, which are two of the greatest challenges in the field (Théry et al., 2018). With this in mind, we acknowledge that EV samples were filtered (0.22 μm) as a precautionary measure to remove cell debris during enrichment. Unfiltered samples of EVs collected from WT cells after conditioning contain a relatively small fraction of particles with diameters between 250 and 430 nm when analysed by NTA (unpublished data). This suggests that larger EVs as well as exosomes may potentially contribute to thermotolerance, and testing this hypothesis is the focus of future studies.
We also show that Bro1, an ALIX ortholog, may represent a yeast exosome biomarker and use it to track EVs (Figures 4 and 5). Although EVs and exosomes can be made at multiple cellular locations (van Niel et al., 2018), we find that GFP‐tagged Bro1 and Ssa2 concentrate at intracellular puncta reminiscent of multivesicular bodies (MVBs), where ESCRTs generate exosomes (Figures 4a and 7a; Gurung et al., 2021; Hurley, 2010; Juan & Fürthauer, 2018). In support, ESCRTs and Bro1 are needed for thermotolerance (Figure 4i,j), confirming that this exosome biogenesis pathways exists in S. cerevisiae (also see Zhao et al., 2019). Furthermore, deleting the ESCRT‐I subunit VPS23 reduces thermotolerance gained by EV enriched samples. Because Vps23 is thought to play a critical role in cargo protein sorting into exosomes during biogenesis, it is possible that Ssa2 or other factors (e.g., proteins important for EV uptake or back–fusion) fail to load accounting for this observed deficiency. Ongoing studies aim to resolve the basis and better understand ESCRT‐mediated exosome biogenesis using yeast as model organism.
EVs are released by other yeasts, bacteria, and many plant species whose cells are surrounded by porous cell walls (Brown et al., 2015; Ruf et al., 2022). We confirm that S. cerevisiae does the same, and that disrupting cell wall biogenesis (chs1∆) has no impact on exosome‐mediated thermotolerance (Figure 5d,e). Thus, consistent with previous reports (Zhao et al., 2019), we find that the cell wall does not impede intercellular signalling by EVs. Finally, EVs are thought to deliver their contents to recipient cells either by direct fusion with the plasma membrane, or by first entering the cell by endocytosis and then fusing with endosome membranes (van Niel et al., 2018). As observed by others (Giardina et al., 2014), we find that that the latter contributes to exosome‐mediated thermotolerance in S. cerevisiae, as blocking clathrin‐mediated endocytosis by deleting END3 abolishes the response (Figure 5d,e).
Our observations are similar to those made in metazoans suggesting this mechanism is conserved (Feng et al., 2014; Bewicke‐Copley et al., 2017; Huber et al., 2022). Notably, cultured human (HeLa) cells show a “bystander” effect whereby a subpopulation of (donor) cells release EVs upon heat stress, presumably because they already possess a thermotolerant property. A second subpopulation of bystander (recipient) cells take up these EVs to gain thermotolerance, promoting survival of the entire population (Bewicke‐Copley et al., 2017). This is also observed at the organismal level in Drosophila melanogaster when confronted with proteotoxic stress (Takeuchi et al., 2015). Herein, we find that only some yeast cells studied take up (Figure 5c) Bro1‐GFP‐positive exosomes for thermotolerance, consistent with the idea that perhaps separate populations of donor and recipient cells mediate this response.
Based on proteomics analysis, EVs responsible for thermotolerance are enriched with proteins that play roles in metabolism, protein translation, or chaperone activities. It is unclear how certain metabolic enzymes or ribosomal subunits may contribute to EV–mediated thermotolerance, warranting further investigation. However, we decided to further examine exosomal Hsp70s (a subclass of chaperone proteins identified) because they are implicated in cytoprotection from heat shock, hypoxia and other stressors, for example, protecting auditory hair cells from ototoxicity (Breglio et al., 2020). Ssa2 (Stress‐Seventy subfamily A2) is one of nine cytosolic Hsp70s (14 total) in S. cerevisiae, and each is predicted to fulfil specific cellular functions. Ssa2 is the only one that is constitutively expressed, possibly explaining why it is rapidly shared between cells within 30–60 min after stimulation (i.e., activation of transcription and translation are unnecessary; Boorstein et al., 1994). Of note, Ssa2 has distinct functional specificity in propagation of yeast Ura2/[URE3] and Sup35/[PSI+] prions, where it promotes prion formation and suppresses destabilisation and degradation of prion protein aggregates (Chernoff et al., 1999; Jones & Tuite, 2005; Wickner et al., 2007, 2018). Thus, we speculate that in addition to its folding activity Ssa2 may help seed recipient cells with prion aggregates from donors to induce lasting changes in cell physiology required for prolonged thermotolerance. Future studies will focus on Lsb2, a prion thought to provide memory of heat stress (Chernova et al., 2017) as well as Cyc8 and Sgt2, two prion‐like proteins identified in our EV samples by proteomics analysis. Although typically associated with disease, prions have beneficial functions in nature, for example, conferring tolerance to many stressors (Halfmann & Lindquist, 2010; Newby & Lindquist, 2013). This proposed mechanism would help ensure survival of the yeast community when confronted with extreme environmental heat stress.
Mammalian EVs help spread toxic protein aggregates between neurons and immune cells underlying the pathogenesis of neurodegenerative disorders including Alzheimer's, Parkinson's and Huntington's diseases (Lee et al., 2010; Liu et al., 2017, 2019). The molecular basis of this process remains largely enigmatic as well. Through ectopic expression of human disease alleles, S. cerevisiae was effectively used to help uncover the molecular machinery responsible for intracellular toxic aggregate formation or disassembly and degradation, which includes chaperones like Ssa2 (e.g., Gokhale et al., 2005; Jones & Tuite, 2005; Khurana & Lindquist, 2010; Park et al., 2013; Tardiff et al., 2013). In this study, GO analysis revealed that chaperones and yeast orthologs of other human proteins associated with Parkinson's and Huntington's diseases are enriched in EVs shared when proteotoxicity is presumably induced by heat stress (Figure 6). Thus, we reason that budding yeast is an exceptional model to better understand the molecular basis of fundamental EV biology and its roles in stress responses relevant to biological robustness and pathogenesis of human neurodegenerative diseases.
AUTHOR CONTRIBUTIONS
Curtis John Logan: Formal analysis; investigation; methodology; validation; visualization; writing—original draft. Claire C. Staton: Conceptualization; formal analysis; investigation; methodology; validation; visualization; writing—original draft. Joshua Thomas Oliver: Conceptualization; formal analysis; investigation; methodology; validation; visualization; writing—original draft. Jeff Bouffard: Formal analysis; investigation; visualization; writing—original draft; writing—review and editing. Thomas David Daniel Kazmirchuk: Formal analysis; investigation; visualization. Melissa Magi: Formal analysis; investigation; visualization. Christopher Leonard Brett: Conceptualization; funding acquisition; methodology; project administration; resources; supervision; visualization; writing—original draft; writing—review and editing.
CONFLICT OF INTEREST STATEMENT
The authors declare no competing interests.
Supporting information
Supplementary Information
Supplementary Information
ACKNOWLEDGEMENTS
We thank the Centre for Applied Nanomedicine at the McGill University Health Centre for assistance with nanoparticle tracking analysis. We thank Nooshin Movahed and Rolf Schmidt for assistance with transmission electron microscopy and atomic force microscopy at the Centre for Nanoscience Research, Concordia University. Proteomics analysis was conducted with assistance from Heng Jiang at the Centre for Biological Applications of Mass Spectrometry, Concordia University. Christopher Law assisted with fluorescence microscopy at the Centre for Microscopy and Cell Imaging, Concordia University. C.C.S. received an Undergraduate Summer Research Award from NSERC. C.J.L. received a fellowship from the Synthetic Biology Applications training program funded by the Natural Sciences and Engineering Research Council of Canada (NSERC). J.A.B. received a Horizon Postdoctoral Fellowship from Concordia University. This work was supported by research grant 2022‐PR‐298412 to C.L.B. from the Fonds de recherche du Québec—Nature et technologies.
Logan, C. J. , Staton, C. C. , Oliver, J. T. , Bouffard, J. , Kazmirchuk, T. D. D. , Magi, M. , & Brett, C. L. (2024). Thermotolerance in S. cerevisiae as a model to study extracellular vesicle biology. Journal of Extracellular Vesicles, 13, e12431. 10.1002/jev2.12431
Extracellular vesicles (EVs) mediate diverse physiology but the basis of their functions is enigmatic. Logan et al. begin to uncover the molecular underpinnings of EV biology using the powerful model organism S. cerevisiae by studying their role in thermotolerance.
REFERENCES
- Asai, H. , Ikezu, S. , Tsunoda, S. , Medalla, M. , Luebke, J. , Haydar, T. , Wolozin, B. , Butovsky, O. , Kügler, S. , & Ikezu, T. (2015). Depletion of microglia and inhibition of exosome synthesis halt tau propagation. Nature Neuroscience, 18(11), 1584–1593. 10.1002/jev2.12431 [DOI] [PMC free article] [PubMed] [Google Scholar]
- Bahram Sangani, N. , Gomes, A. R. , Curfs, L. M. G. , & Reutelingsperger, C. P. (2021). The role of extracellular vesicles during CNS development. Progress in Neurobiology, 205, 102124. 10.1016/j.pneurobio.2021.102124 [DOI] [PubMed] [Google Scholar]
- Baietti, M. F. , Zhang, Z. , Mortier, E. , Melchior, A. , Degeest, G. , Geeraerts, A. , Ivarsson, Y. , Depoortere, F. , Coomans, C. , Vermeiren, E. , Zimmermann, P. , & David, G. (2012). Syndecan‐syntenin‐ALIX regulates the biogenesis of exosomes. Nature Cell Biology, 14(7), 677–685. 10.1038/ncb2502 [DOI] [PubMed] [Google Scholar]
- Breglio, A. M. , May, L. A. , Barzik, M. , Welsh, N. C. , Francis, S. P. , Costain, T. Q. , Wang, L. , Anderson, D. E. , Petralia, R. S. , Wang, Y. X. , Friedman, T. B. , Wood, M. J. , & Cunningham, L. L. (2020). Exosomes mediate sensory hair cell protection in the inner ear. Journal of Clinical Investigation, 130(5), 2657–2672. 10.1172/JCI128867 [DOI] [PMC free article] [PubMed] [Google Scholar]
- Bewicke‐Copley, F. , Mulcahy, L. A. , Jacobs, L. A. , Samuel, P. , Akbar, N. , Pink, R. C. , & Carter, D. R. F. (2017). Extracellular vesicles released following heat stress induce bystander effect in unstressed populations. Journal of Extracellular Vesicles, 6(1), 1340746. 10.1080/20013078.2017.1340746 [DOI] [PMC free article] [PubMed] [Google Scholar]
- Bissig, C. , & Gruenberg, J. (2014). ALIX and the multivesicular endosome: ALIX in Wonderland. Trends in Cell Biology, 24(1), 19–25. 10.1016/j.tcb.2013.10.009 [DOI] [PubMed] [Google Scholar]
- Bister, N. , Pistono, C. , Huremagic, B. , Jolkkonen, J. , Giugno, R. , & Malm, T. (2020). Hypoxia and extracellular vesicles: A review on methods, vesicular cargo and functions. Journal of Extracellular Vesicles, 10(1), e12002. 10.1002/jev212431.12002 [DOI] [PMC free article] [PubMed] [Google Scholar]
- Boorstein, W. R. , Ziegelhoffer, T. , & Craig, E. A. (1994). Molecular evolution of the HSP70 multigene family. Journal of Molecular Evolution, 38(1), 1–17. 10.1007/BF00175490 [DOI] [PubMed] [Google Scholar]
- Brown, L. , Wolf, J. M. , Prados‐Rosales, R. , & Casadevall, A. (2015). Through the wall: Extracellular vesicles in Gram‐positive bacteria, mycobacteria and fungi. Nature Reviews Microbiology, 13(10), 620–630. 10.1038/nrmicro3480 [DOI] [PMC free article] [PubMed] [Google Scholar]
- Buzas, E. I. (2022). The roles of extracellular vesicles in the immune system. Nature Reviews Immunology, 4, 1–15. 10.1038/s41577-022-00763-8 [DOI] [PMC free article] [PubMed] [Google Scholar]
- Calderwood, S. K. , Murshid, A. , & Prince, T. (2009). The shock of aging: Molecular chaperones and the heat shock response in longevity and aging–A mini‐review. Gerontology, 55(5), 550–558. 10.1159/000225957 [DOI] [PMC free article] [PubMed] [Google Scholar]
- Chernoff, Y. O. , Newnam, G. P. , Kumar, J. , Allen, K. , & Zink, A. D. (1999). Evidence for a protein mutator in yeast: role of the Hsp70‐related chaperone ssb in formation, stability, and toxicity of the [PSI] prion. Molecular and Cellular Biology, 19(12), 8103–8112. 10.1128/MCB.19.12.8103 [DOI] [PMC free article] [PubMed] [Google Scholar]
- Chernova, T. A. , Chernoff, Y. O. , & Wilkinson, K. D. (2017). Prion‐based memory of heat stress in yeast. Prion, 11(3), 151–161. 10.1080/19336896.2017.1328342 [DOI] [PMC free article] [PubMed] [Google Scholar]
- Estévez‐Souto, V. , Da Silva‐Álvarez, S. , & Collado, M. (2022). The role of extracellular vesicles in cellular senescence. Febs Journal, 290(5), 1203–1211. 10.1111/febs.16585 [DOI] [PubMed] [Google Scholar]
- Feng, Y. , Huang, W. , Meng, W. , Jegga, A. G. , Wang, Y. , Cai, W. , Kim, H. W. , Pasha, Z. , Wen, Z. , Rao, F. , Modi, R. M. , Yu, X. , & Ashraf, M. (2014). Heat shock improves Sca‐1+ stem cell survival and directs ischemic cardiomyocytes toward a prosurvival phenotype via exosomal transfer: a critical role for HSF1/miR‐34a/HSP70 pathway. Stem Cells, 32(2), 462–472. 10.1002/stem.1571 [DOI] [PMC free article] [PubMed] [Google Scholar]
- Feyder, S. , De Craene, J. O. , Bär, S. , Bertazzi, D. L. , & Friant, S. (2015). Membrane trafficking in the yeast Saccharomyces cerevisiae model. International Journal of Molecular Sciences, 16(1), 1509–1525. 10.3390/ijms16011509 [DOI] [PMC free article] [PubMed] [Google Scholar]
- Finley, D. , Ulrich, H. D. , Sommer, T. , & Kaiser, P. (2012). The ubiquitin‐proteasome system of Saccharomyces cerevisiae . Genetics, 192(2), 319–360. 10.1534/genetics.112.140467 [DOI] [PMC free article] [PubMed] [Google Scholar]
- Freitas, M. S. , Bonato, V. L. D. , Pessoni, A. M. , Rodrigues, M. L. , Casadevall, A. , & Almeida, F. (2019). Fungal extracellular vesicles as potential targets for immune interventions. mSphere, 4(6), e00747–e00719. 10.1128/mSphere.00747-19 [DOI] [PMC free article] [PubMed] [Google Scholar]
- Giardina, B. J. , Stein, K. , & Chiang, H. L. (2014). The endocytosis gene END3 is essential for the glucose‐induced rapid decline of small vesicles in the extracellular fraction in Saccharomyces cerevisiae . Journal of Extracellular Vesicles, 3(1), 23497. 10.3402/jev.v3.23497 [DOI] [PMC free article] [PubMed] [Google Scholar]
- Gill, S. , Catchpole, R. , & Forterre, P. (2019). Extracellular membrane vesicles in the three domains of life and beyond. Fems Microbiology Review, 43(3), 273–303. 10.1093/femsre/fuy042 [DOI] [PMC free article] [PubMed] [Google Scholar]
- Gokhale, K. C. , Newnam, G. P. , Sherman, M. Y. , & Chernoff, Y. O. (2005). Modulation of prion‐dependent polyglutamine aggregation and toxicity by chaperone proteins in the yeast model. Journal of Biological Chemistry, 280(24), 22809–22818. 10.1074/jbc.M500390200 [DOI] [PubMed] [Google Scholar]
- Gurung, S. , Perocheau, D. , Touramanidou, L. , & Baruteau, J. (2021). The exosome journey: From biogenesis to uptake and intracellular signaling. Cell Communication and Signaling, 19(1), 47. 10.1186/s12964-021-00730-1 [DOI] [PMC free article] [PubMed] [Google Scholar]
- Halfmann, R. , & Lindquist, S. (2010). Epigenetics in the extreme: Prions and the inheritance of environmentally acquired traits. Science, 330(6004), 629–632. 10.1126/science.1191081 [DOI] [PubMed] [Google Scholar]
- Higuchi, A. , Morishita, M. , Nagata, R. , Maruoka, K. , Katsumi, H. , & Yamamoto, A. (2022). Functional characterization of extracellular vesicles from Baker's yeast Saccharomyces cerevisiae as a novel vaccine material for immune cell maturation. Journal of Pharmaceutical Sciences, S0022‐3549(22), 00386–00389. 10.1016/j.xphs.2022.08.032 [DOI] [PubMed] [Google Scholar]
- Honorato, L. , de Araujo, J. F. D. , Ellis, C. C. , Piffer, A. C. , Pereira, Y. , Frases, S. , de Sousa Araújo, G. R. , Pontes, B. , Mendes, M. T. , Pereira, M. D. , Guimarães, A. J. , da Silva, N. M. , Vargas, G. , Joffe, L. , Del Poeta, M. , Nosanchuk, J. D. , Zamith‐Miranda, D. , Dos Reis, F. C. G. , de Oliveira, H. C. , … Nimrichter, L. (2022). Extracellular vesicles regulate biofilm formation and yeast‐to‐hypha differentiation in Candida albicans . MBio, 13(3), e0030122. 10.1128/mbio.00301-22 [DOI] [PMC free article] [PubMed] [Google Scholar]
- Huber, C. C. , Callegari, E. A. , Paez, M. D. , Romanova, S. , & Wang, H. (2022). Heat shock‐induced extracellular vesicles derived from neural stem cells confer marked neuroprotection against oxidative stress and amyloid‐β‐Caused neurotoxicity. Molecular Neurobiology, 59(12), 7404–7412. 10.1007/s12035-022-03055-3 [DOI] [PMC free article] [PubMed] [Google Scholar]
- Huh, W. K. , Falvo, J. V. , Gerke, L. C. , Carroll, A. S. , Howson, R. W. , Weissman, J. S. , & O'Shea, E. K. (2003). Global analysis of protein localization in budding yeast. Nature, 425(6959), 686–691. 10.1038/nature02026 [DOI] [PubMed] [Google Scholar]
- Hur, Y. H. , Feng, S. , Wilson, K. F. , Cerione, R. A. , & Antonyak, M. A. (2021). Embryonic stem cell‐derived extracellular vesicles maintain ESC stemness by activating FAK. Developmental Cell, 56(3), 277–291. e6 10.1016/j.devcel.2020.11.017 [DOI] [PMC free article] [PubMed] [Google Scholar]
- Hurley, J. H. (2010). The ESCRT complexes. Critical Reviews in Biochemistry and Molecular Biology, 45(6), 463–487. 10.3109/10409238.2010.502516 [DOI] [PMC free article] [PubMed] [Google Scholar]
- Ikeda, M. A. K. , & Ferreira, K. S. (2021). Extracellular vesicles from sporothrix yeast cells. Current Topics in Microbiology and Immunology, 432, 35–44. 10.1007/978-3-030-83391-6_4 [DOI] [PubMed] [Google Scholar]
- Jolly, C. , & Morimoto, R. I. (2000). Role of the heat shock response and molecular chaperones in oncogenesis and cell death. JNCI: Journal of the National Cancer Institute, 92(19), 1564–1572. 10.1093/jnci/92.19.1564 [DOI] [PubMed] [Google Scholar]
- Jones, G. W. , & Tuite, M. F. (2005). Chaperoning prions: the cellular machinery for propagating an infectious protein? BioEssays, 27(8), 823–832. 10.1002/bies.20267 [DOI] [PubMed] [Google Scholar]
- Juan, T. , & Fürthauer, M. (2018). Biogenesis and function of ESCRT‐dependent extracellular vesicles. Seminars in cell & developmental biology, 74, 66–77. 10.1016/j.semcdb.2017.08.022 [DOI] [PubMed] [Google Scholar]
- Kabani, M. , & Melki, R. (2015). Sup35p in its soluble and prion states is packaged inside extracellular vesicles. MBio, 6(4), e01017–e01015. 10.1128/mBio.01017-15 [DOI] [PMC free article] [PubMed] [Google Scholar]
- Kalluri, R. , & LeBleu, V. S. (2020). The biology, function and biomedical applications of exosomes. Science, 367(6478), 6977. 10.1126/science.aau6977 [DOI] [PMC free article] [PubMed] [Google Scholar]
- Khurana, V. , & Lindquist, S. (2010). Modelling neurodegeneration in Saccharomyces cerevisiae: Why cook with baker's yeast? Nature Reviews Neuroscience, 11(6), 436–449. 10.1038/nrn2809 [DOI] [PubMed] [Google Scholar]
- Lee, S. J. , Desplats, P. , Sigurdson, C. , Tsigelny, I. , & Masliah, E. (2010). Cell‐to‐cell transmission of non‐prion protein aggregates. Nature Reviews Neurology, 6(12), 702–706. 10.1038/nrneurol.2010.145 [DOI] [PMC free article] [PubMed] [Google Scholar]
- Liebana‐Jordan, M. , Brotons, B. , Falcon‐Perez, J. M. , & Gonzalez, E. (2021). Extracellular vesicles in the fungi kingdom. International Journal of Molecular Sciences, 22(13), 7221. 10.3390/ijms22137221 [DOI] [PMC free article] [PubMed] [Google Scholar]
- Lindquist, S. , & Craig, E. A. (1988). The heat‐shock proteins. Annual Review of Genetics, 22, 631–677. 10.1146/annurev.ge.22.120188.003215 [DOI] [PubMed] [Google Scholar]
- Liu, S. , Hossinger, A. , Hofmann, J. P. , Denner, P. , & Vorberg, I. M. (2016). Horizontal transmission of cytosolic Sup35 Prions by extracellular vesicles. MBio, 7(4), e00915 16. 10.1128/mBio.00915-16 [DOI] [PMC free article] [PubMed] [Google Scholar]
- Liu, S. , Hossinger, A. , Göbbels, S. , & Vorberg, I. M. (2017). Prions on the run: How extracellular vesicles serve as delivery vehicles for self‐templating protein aggregates. Prion, 11(2), 98–112. 10.1080/19336896.2017.1306162 [DOI] [PMC free article] [PubMed] [Google Scholar]
- Liu, W. , Bai, X. , Zhang, A. , Huang, J. , Xu, S. , & Zhang, J. (2019). Role of exosomes in central nervous system diseases. Front Mol Neurosci, 12, 240. 10.3389/fnmol.2019.00240 [DOI] [PMC free article] [PubMed] [Google Scholar]
- Lu, R. , Drubin, D. G. , & Sun, Y. (2016). Clathrin‐mediated endocytosis in budding yeast at a glance. Journal of Cell Science, 129(8), 1531–1536. 10.1242/jcs.182303 [DOI] [PMC free article] [PubMed] [Google Scholar]
- Lucotti, S. , Kenific, C. M. , Zhang, H. , & Lyden, D. (2022). Extracellular vesicles and particles impact the systemic landscape of cancer. Embo Journal, 41(18), e109288. 10.15252/embj.2021109288 [DOI] [PMC free article] [PubMed] [Google Scholar]
- Mathieu, M. , Martin‐Jaular, L. , Lavieu, G. , & Théry, C. (2019). Specificities of secretion and uptake of exosomes and other extracellular vesicles for cell‐to‐cell communication. Nature Cell Biology, 21(1), 9–17. 10.1038/s41556-018-0250-9 [DOI] [PubMed] [Google Scholar]
- Mathivanan, S. , & Simpson, R. J. (2009). ExoCarta: A compendium of exosomal proteins and RNA. Proteomics, 9(21), 4997–5000. 10.1002/pmic.200900351 [DOI] [PubMed] [Google Scholar]
- Mencher, A. , Morales, P. , Valero, E. , Tronchoni, J. , Patil, K. R. , & Gonzalez, R. (2020). Proteomic characterization of extracellular vesicles produced by several wine yeast species. Microbial Biotechnology, 13(5), 1581–1596. 10.1111/1751-7915.13614 [DOI] [PMC free article] [PubMed] [Google Scholar]
- Miura, N. , & Ueda, M. (2018). Evaluation of unconventional protein secretion by Saccharomyces cerevisiae and other fungi. Cells, 7(9), 128. 10.3390/cells7090128 [DOI] [PMC free article] [PubMed] [Google Scholar]
- Newby, G. A. , & Lindquist, S. (2013). Blessings in disguise: biological benefits of prion‐like mechanisms. Trends in Cell Biology, 23(6), 251–259. 10.1016/j.tcb.2013.01.007 [DOI] [PubMed] [Google Scholar]
- Oliveira, D. L. , Nakayasu, E. S. , Joffe, L. S. , Guimarães, A. J. , Sobreira, T. J. , Nosanchuk, J. D. , Cordero, R. J. , Frases, S. , Casadevall, A. , Almeida, I. C. , Nimrichter, L. , & Rodrigues, M. L. (2010). Characterization of yeast extracellular vesicles: evidence for the participation of different pathways of cellular traffic in vesicle biogenesis. PLoS ONE, 5(6), e11113. 10.1371/journal.pone.0011113 [DOI] [PMC free article] [PubMed] [Google Scholar]
- Park, S. H. , Kukushkin, Y. , Gupta, R. , Chen, T. , Konagai, A. , Hipp, M. S. , Hayer‐Hartl, M. , & Hartl, F. U. (2013). PolyQ proteins interfere with nuclear degradation of cytosolic proteins by sequestering the Sis1p chaperone. Cell, 154(1), 134–145. 10.1016/j.cell.2013.06.003 [DOI] [PubMed] [Google Scholar]
- Parreira, V. , Santos, L. G. C. , Rodrigues, M. L. , & Passetti, F. (2021). ExVe: The knowledge base of orthologous proteins identified in fungal extracellular vesicles. Computational and Structural Biotechnology Journal, 19, 2286–2296. 10.1016/j.csbj.2021.04.031 [DOI] [PMC free article] [PubMed] [Google Scholar]
- Peres da Silva, R. , Puccia, R. , Rodrigues, M. L. , Oliveira, D. L. , Joffe, L. S. , César, G. V. , Nimrichter, L. , Goldenberg, S. , & Alves, L. R. (2015). Extracellular vesicle‐mediated export of fungal RNA. Scientific Reports, 5, 7763. 10.1038/srep07763 [DOI] [PMC free article] [PubMed] [Google Scholar]
- Qi, H. , Wang, Y. , Fa, S. , Yuan, C. , & Yang, L. (2021). Extracellular vesicles as natural delivery carriers regulate oxidative stress under pathological conditions. Frontiers in Bioengineering and Biotechnology, 9, 752019. 10.3389/fbioe.2021.752019 [DOI] [PMC free article] [PubMed] [Google Scholar]
- Rider, M. A. , Hurwitz, S. N. , & Meckes, D. G. Jr. (2016). ExtraPEG: A polyethylene glycol‐based method for enrichment of extracellular vesicles. Scientific Reports, 6, 23978. 10.1038/srep23978 [DOI] [PMC free article] [PubMed] [Google Scholar]
- Rodrigues, M. L. , Nakayasu, E. S. , Almeida, I. C. , & Nimrichter, L. (2014). The impact of proteomics on the understanding of functions and biogenesis of fungal extracellular vesicles. Journal of Proteomics, 97, 177–186. 10.1016/j.jprot.2013.04.001 [DOI] [PMC free article] [PubMed] [Google Scholar]
- Ruf, A. , Oberkofler, L. , Robatzek, S. , & Weiberg, A. (2022). Spotlight on plant RNA‐containing extracellular vesicles. Current Opinion in Plant Biology, 69, 102272. 10.1016/j.pbi.2022.102272 [DOI] [PubMed] [Google Scholar]
- Takeuchi, T. , Suzuki, M. , Fujikake, N. , Popiel, H. A. , Kikuchi, H. , Futaki, S. , Wada, K. , & Nagai, Y. (2015). Intercellular chaperone transmission via exosomes contributes to maintenance of protein homeostasis at the organismal level. PNAS, 112(19), E2497–E2506. 10.1073/pnas.1412651112 [DOI] [PMC free article] [PubMed] [Google Scholar]
- Tardiff, D. F. , Jui, N. T. , Khurana, V. , Tambe, M. A. , Thompson, M. L. , Chung, C. Y. , Kamadurai, H. B. , Kim, H. T. , Lancaster, A. K. , Caldwell, K. A. , Caldwell, G. A. , Rochet, J. C. , Buchwald, S. L. , & Lindquist, S. (2013). Yeast reveal a “druggable” Rsp5/Nedd4 network that ameliorates α‐synuclein toxicity in neurons. Science, 342(6161), 979–983. 10.1126/science.1245321 [DOI] [PMC free article] [PubMed] [Google Scholar]
- Théry, C. , Witwer, K. W. , Aikawa, E. , Alcaraz, M. J. , Anderson, J. D. , Andriantsitohaina, R. , Antoniou, A. , Arab, T. , Archer, F. , Atkin‐Smith, G. K. , & Ayre, D. C. (2018). Minimal information for studies of extracellular vesicles 2018 (MISEV2018): A position statement of the International Society for Extracellular Vesicles and update of the MISEV2014 guidelines. Journal of Extracellular Vesicles, 7(1), 1535750. 10.1080/20013078.2018.1535750 [DOI] [PMC free article] [PubMed] [Google Scholar]
- Thompson, A. G. , Gray, E. , Heman‐Ackah, S. M. , Mäger, I. , Talbot, K. , Andaloussi, S. E. , Wood, M. J. , & Turner, M. R. (2016). Extracellular vesicles in neurodegenerative disease—Pathogenesis to biomarkers. Nature reviews Neurology, 12(6), 346–357. 10.1038/nrneurol.2016.68 [DOI] [PubMed] [Google Scholar]
- Vallejo, M. C. , Nakayasu, E. S. , Matsuo, A. L. , Sobreira, T. J. , Longo, L. V. , Ganiko, L. , Almeida, I. C. , & Puccia, R. (2012). Vesicle and vesicle‐free extracellular proteome of Paracoccidioides brasiliensis: Comparative analysis with other pathogenic fungi. Journal of Proteome Research, 11(3), 1676–1685. 10.1021/pr200872s [DOI] [PMC free article] [PubMed] [Google Scholar]
- van Niel, G. , D'Angelo, G. , & Raposo, G. (2018). Shedding light on the cell biology of extracellular vesicles. Nature Reviews Molecular Cell Biology, 19(4), 213–228. 10.1038/nrm.2017.125 [DOI] [PubMed] [Google Scholar]
- Vanderwaeren, L. , Dok, R. , Voordeckers, K. , Nuyts, S. , & Verstrepen, K. J. (2022). Saccharomyces cerevisiae as a model system for eukaryotic cell biology, from cell cycle control to DNA damage response. International Journal of Molecular Sciences, 23(19), 11665. 10.3390/ijms231911665 [DOI] [PMC free article] [PubMed] [Google Scholar]
- Verghese, J. , Abrams, J. , Wang, Y. , & Morano, K. A. (2012). Biology of the heat shock response and protein chaperones: Budding yeast (Saccharomyces cerevisiae) as a model system. Microbiology and Molecular Biology Reviews, 76(2), 115–158. 10.1128/MMBR.05018-11 [DOI] [PMC free article] [PubMed] [Google Scholar]
- Wickner, R. B. , Edskes, H. K. , Shewmaker, F. , & Nakayashiki, T. (2007). Prions of fungi: Inherited structures and biological roles. Nature Reviews Microbiology, 5(8), 611–618. 10.1038/nrmicro1708 [DOI] [PMC free article] [PubMed] [Google Scholar]
- Wickner, R. B. , Edskes, H. K. , Son, M. , Bezsonov, E. E. , DeWilde, M. , & Ducatez, M. (2018). Yeast prions compared to functional prions and amyloids. Journal of Molecular Biology, 430(20), 3707–3719. 10.1016/j.jmb.2018.04.022 [DOI] [PubMed] [Google Scholar]
- Xu, R. , Rai, A. , Chen, M. , Suwakulsiri, W. , Greening, D. W. , & Simpson, R. J. (2018). Extracellular vesicles in cancer—Implications for future improvements in cancer care. Nature Reviews Clinical Oncology, 15(10), 617–638. 10.1038/s41571-018-0036-9 [DOI] [PubMed] [Google Scholar]
- Zhao, K. , Bleackley, M. , Chisanga, D. , Gangoda, L. , Fonseka, P. , Liem, M. , Kalra, H. , Al Saffar, H. , Keerthikumar, S. , Ang, C. S. , Adda, C. G. , Jiang, L. , Yap, K. , Poon, I. K. , Lock, P. , Bulone, V. , Anderson, M. , & Mathivanan, S. (2019). Extracellular vesicles secreted by Saccharomyces cerevisiae are involved in cell wall remodelling. Communications Biology, 2, 305. 10.1038/s42003-019-0538-8 [DOI] [PMC free article] [PubMed] [Google Scholar]
- Ziman, M. , Chuang, J. S. , & Schekman, R. W. (1996). Chs1p and Chs3p, two proteins involved in chitin synthesis, populate a compartment of the Saccharomyces cerevisiae endocytic pathway. Molecular Biology of the Cell, 7(12), 1909–1919. 10.1091/mbc.7.12.1909 [DOI] [PMC free article] [PubMed] [Google Scholar]
- Zimmermann, A. , Kainz, K. , Andryushkova, A. , Hofer, S. , Madeo, F. , & Carmona‐Gutierrez, D. (2016). Autophagy: One more Nobel Prize for yeast. Microb Cell, 3(12), 579–581. 10.15698/mic2016.12.544 [DOI] [PMC free article] [PubMed] [Google Scholar]
Associated Data
This section collects any data citations, data availability statements, or supplementary materials included in this article.
Supplementary Materials
Supplementary Information
Supplementary Information