

In December 2022, the Centers for Disease Control and Prevention (CDC) released Extended BMI-for-age growth charts1,2 for children and adolescents with high BMI values. These charts extend to a BMI of 60 and add 4 growth curves (98th, 99th, 99.9th, and 99.99th percentiles). Obesity among children and adolescents is defined as BMI ≥95th percentile of BMI-for-age and severe obesity as BMI ≥120% of the 95th percentile or ≥35.3 The recent American Academy of Pediatrics guideline for the treatment of obesity recommends using percentages of the 95th percentile of BMI-for-age to indicate different levels of severe obesity.4 This analysis compares CDC extended BMI-for-age percentiles with 120% and 140% of the 95th percentile and illustrates the differences between the prevalence of US children and adolescents 2 to 19 years of age with a BMI ≥ extended 98th percentile using the newly defined curve and those ≥120% of the 95th percentile using 2017 to March 2020 National Health and Nutritional Examination (NHANES) data.
METHODS
Extended percentiles from the 98th to 99.99th and percentages of the 95th percentile (120% and 140%) were plotted by using the CDC Extended BMI-for-age growth charts file.5
Prevalence estimates were calculated by using data from the nationally representative NHANES.6 Parental permission was obtained for youth <18 years of age, along with documented assent for participants 7 to 17 years of age and consent for participants 18 and older. Standardized measurements of weight and height were obtained during physical examinations. The National Center for Health Statistics Ethics Review Board approved NHANES and the examination response rate for youth 1 to 19 years of age was 51.5% from 2017 to March 2020.7,8
The prevalence of children and adolescents with a BMI ≥ extended 98th percentile of BMI-for-age and ≥120% of the 95th percentile along with the 95% confidence intervals are presented. The full definition of severe obesity, including a BMI ≥35, was not included in these comparisons because the ages at which the extended 98th percentile and 120% of the 95th percentile were at or above a BMI of 35 were virtually identical.
Estimates are shown by sex, age (2–5, 6–11, and 12–19 years), and race/Hispanic origin (Asian, Black, Hispanic, White, and other, which includes individuals reporting multiple races).
Differences in the prevalence of youth above the 2 cut points were tested by using a Z-statistic. National Center for Health Statistics presentation standards9 were used to evaluate the reliability of estimates. NHANES examination sample weights were used to adjust for oversampling, nonresponse, and noncoverage. Data were analyzed by using SAS (version 9.4) and SUDAAN (version 11.0).
Figure 1 reveals that 120% and 140% of the 95th percentile levels are higher than both the extended 98th and 99th BMI-for-age percentiles at younger ages (approximately ages 2 to 6 years). The extended 98th percentile approximates 120% of the 95th percentile for ages 7 and older.
FIGURE 1.
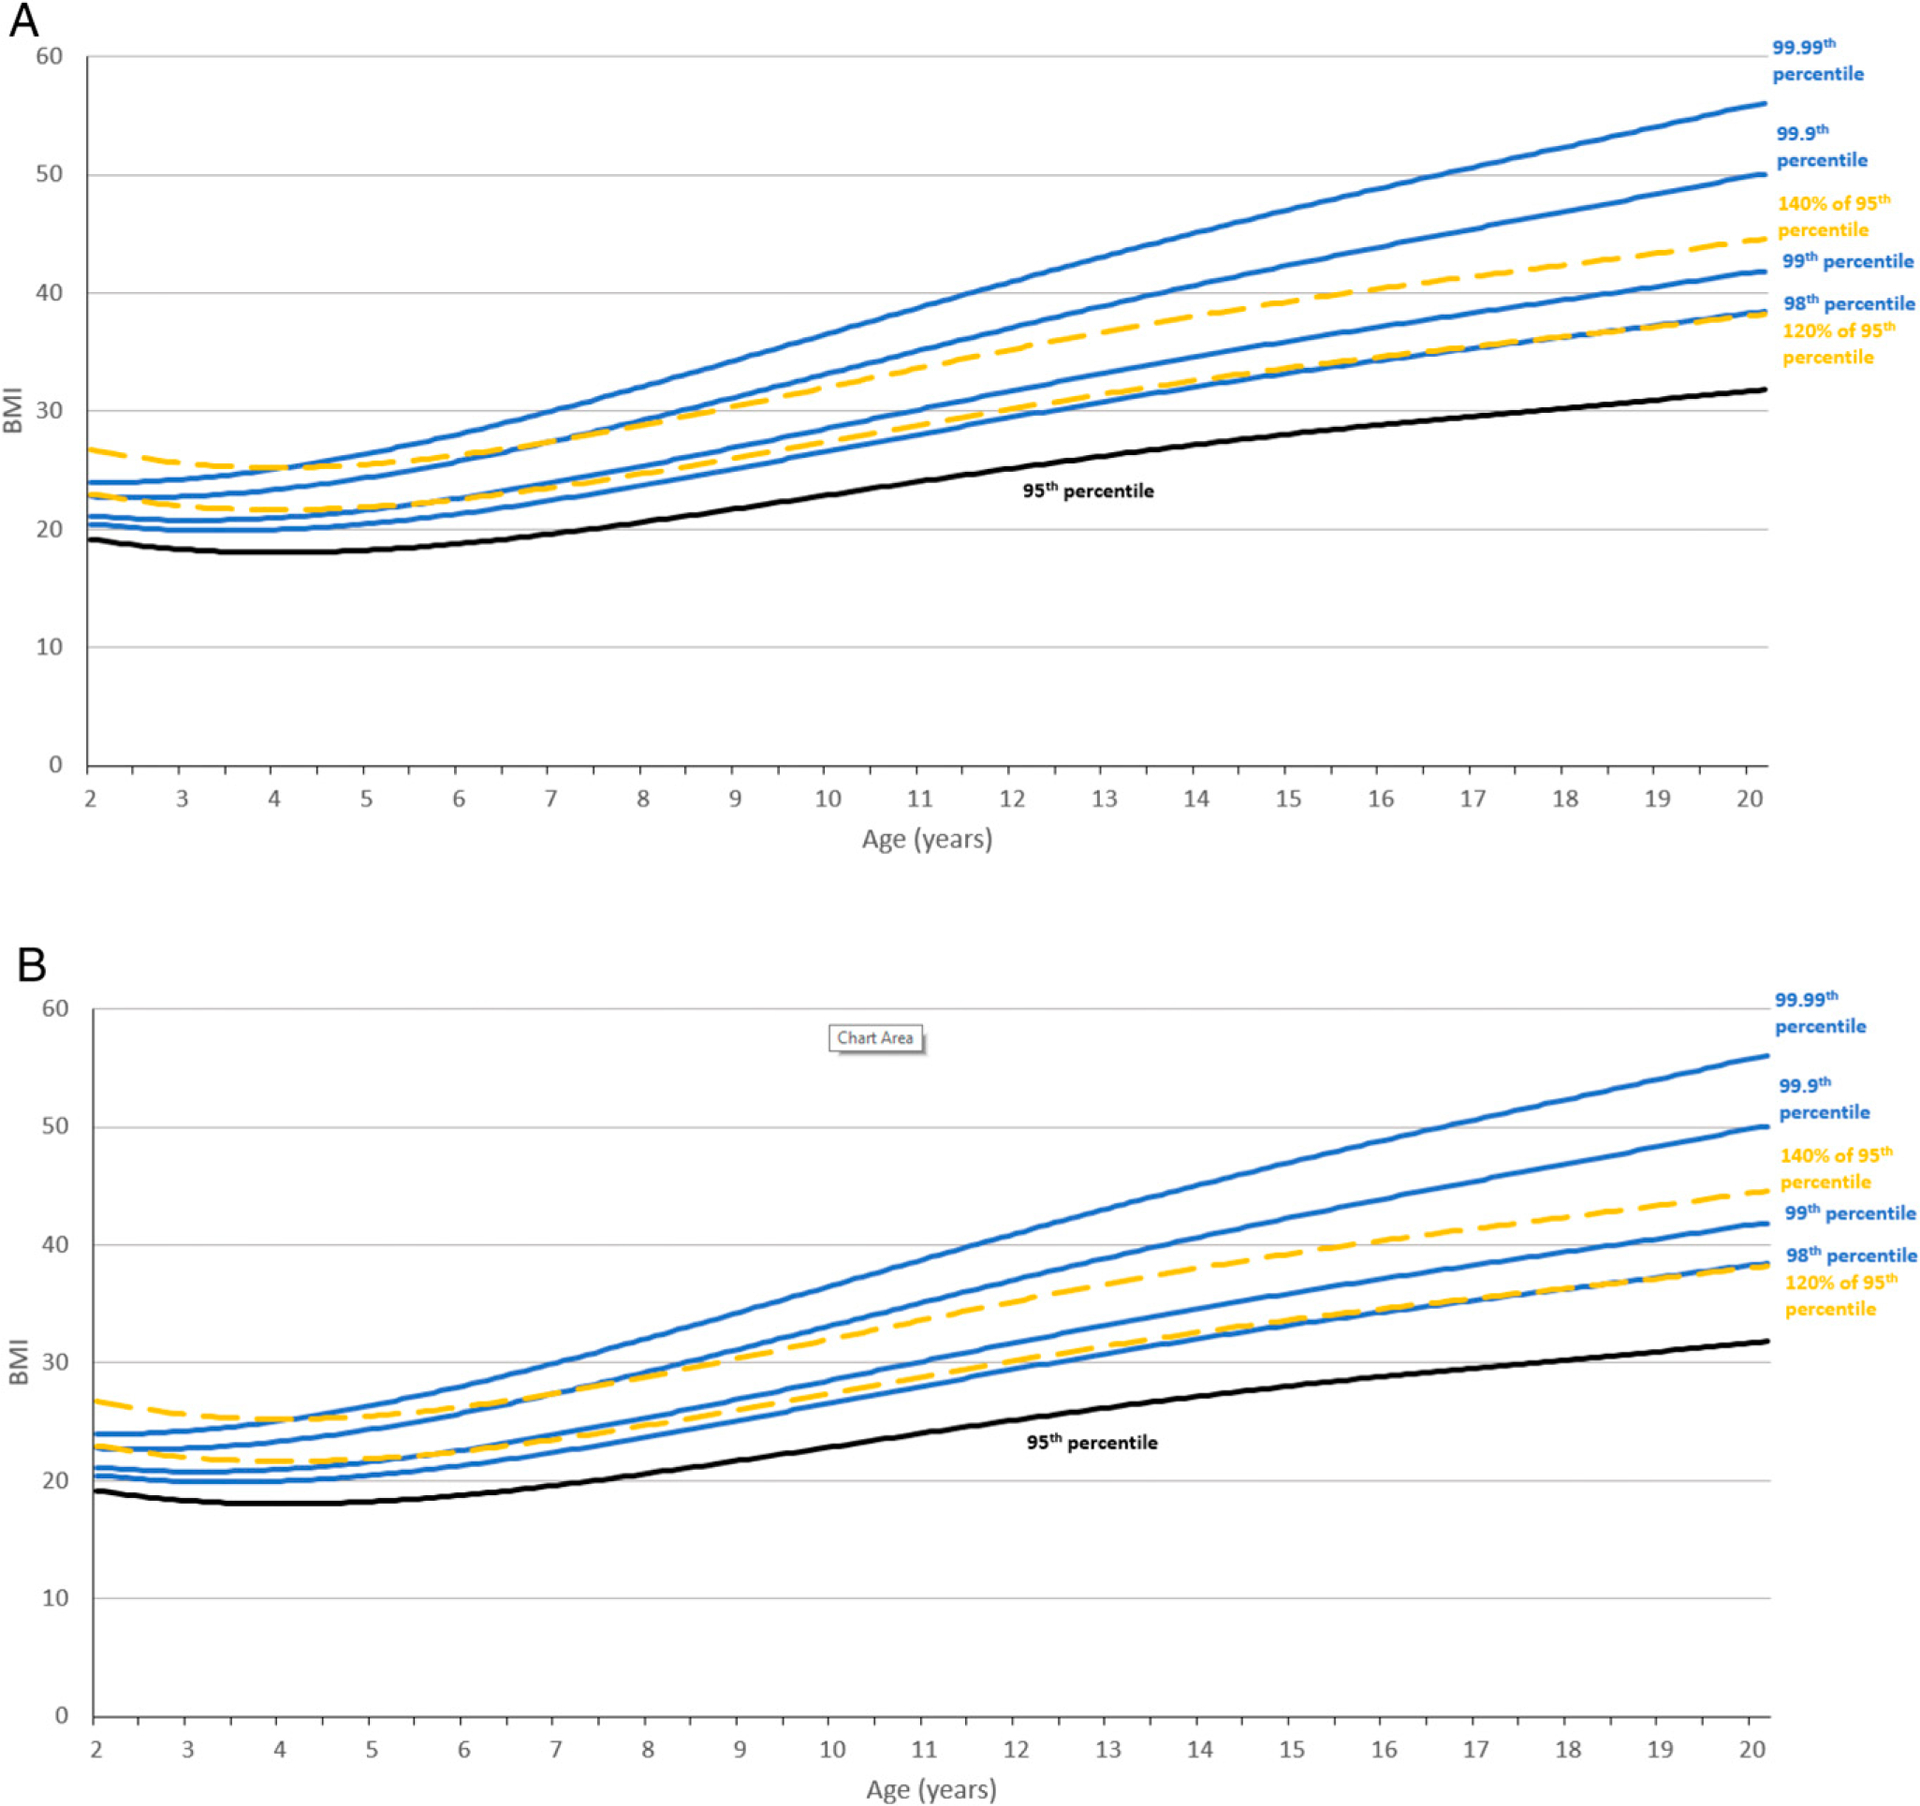
Select CDC Extended BMI-for-age percentiles, 95th percentile and 120% and 140% of the 95th percentile, (A) Girls and (B) Boys.1
Notes: Percentiles above the 95th percentile are Extended CDC BMI-for-age percentiles.
RESULTS
The sample size from NHANES 2017 to March 2020 was 4749 nonpregnant persons 2 to 19 years of age with measured weight and height. Among children and adolescents 2 to 19 years of age, 7.7% (95% confidence interval [CI] 6.5% to 9.0%) had BMIs ≥98th percentile compared with 6.7% (95% CI 5.5% to 8.1%) who had BMIs ≥120% of the 95th percentile (Table 1). The patterns by sex and race/Hispanic origin were similar to the overall estimates, except that the estimates for Asian children and adolescents were the same (2%) using both metrics. The patterns by age varied. Among children 2 to 5 years of age, the percentage ≥ extended 98th percentile was higher than the percentage ≥120% of the 95th percentile (4.5%, 95% CI 3.3% to 6.0% versus 2.5%, 95% CI 1.5% to 4.0%, P = 5 .02). Among children 6 to 11 years of age, 8.3% had BMIs ≥ extended 98th percentile compared with 6.9% with BMIs ≥120% of the 95th percentile. Among adolescents 12 to 19 years, the percentage ≥ extended 98th percentile was virtually the same as that based on ≥120% of the 95th percentile (8.7%, 95% CI 7.0% to 10.8% versus 8.5%, 95% CI 6.8% to 10.5%).
TABLE 1.
Percentage of US children and adolescents 2–19 years above the extended 98th percentile and 120% of the 95th percentile, by sex, age and race/Hispanic origin, 2017–March 2020
| Percentage (95% CI) | |||||
|---|---|---|---|---|---|
| n | Weighted Proportion of Population | Extended 98th Percentile | 120% of 95th Percentile | P-value for Difference* | |
| Total | 4749 | 100.00 | 7.7 (6.5–95) | 6.7 (5.5–18.1) | 0.23 |
| Sex | |||||
| Female | 2339 | 50.6 | 7.1 (5.7–8.7) | 6.1 (4.9–7.6) | 0.34 |
| Male | 2410 | 49.4 | 8.3 (6.8–10.0) | 7.3 (5.9–9.0) | 0.30 |
| Age (y) | |||||
| 2–5 | 1141 | 20.8 | 4.5 (3.3–6.0) | 2.5 (1.5–4.0) | 0.02 |
| 6–11 | 1765 | 33.4 | 8.3 (6.1–11.0) | 6.9 (5.0–9.3) | 0.36 |
| 12–19 | 1843 | 45.8 | 8.7 (7.0–10.8) | 8.5 (6.8–10.5) | 0.87 |
| Race/Hispanic origin | |||||
| Asian | 420 | 5.0 | 2.0 (0.7–4.5) | 2.0 (0.7–4.5) | 0.68 |
| Black | 1270 | 13.4 | 11.7 (9.7–14.0) | 10.3 (8.4–12.5) | 0.32 |
| Hispanic | 1143 | 25.0 | 9.9 (8.0–12.1) | 8.1 (6.2–10.4) | |
| Other | 445 | 6.5 | 7.6 (4.2–12.4) | 7.2 (3.9–11.9) | 0.19 |
| White | 1471 | 50.2 | 6.1 (4.2–8.6) | 5.5 (3.6–8.1) | 0.88 |
n, unweighted sample size; CI, confidence interval.
Z-statistic greater than 1.96 or less than −1.96, was used for pairwise statistical testing. Z-statistics: (Estimate1-Estimate2)/√(SE2 Estimate1) + (SE2 Estimate2).
Source: NHANES.
DISCUSSION
The 98th percentile of the CDC Extended BMI-for-age Growth Charts approximates 120% of the 95th percentile for older children. Among young children, however, a higher percentage were above the 98th percentile than above 120% of the 95th percentile. The extended method overcomes technical limitations of the CDC 2000 growth chart, which restricted the use of BMI percentiles and z-scores above the 97th percentile,10 thus permitting the use of higher percentiles and z-scores for assessing obesity severity. Clinical studies could determine if the 98th percentile is associated with comparable levels of health risk across the age span.
ACKNOWLEDGMENTS
Thank you to Joseph Afful, MS, Peraton Corporation for his programming assistance and to Samantha Pierce (CDC) for her comments on the manuscript.
ABBREVIATIONS
- CDC
Centers for Disease Control and Prevention
- NHANES
National Health and Nutrition Examination Survey
Footnotes
CONFLICT OF INTEREST DISCLOSURES: The authors have indicated they have no potential conflicts of interest relevant to this article to disclose. The findings and conclusions in this report are those of the authors and do not necessarily reflect those of the Centers for Disease Control and Prevention.
REFERENCES
- 1.Hales CM, Freedman DS, Akinbami L, et al. Evaluation of alternative body mass index (BMI) metrics to monitor weight status in children and adolescents with extremely high BMI using CDC BMI-for-age growth charts. Vital Health Stat 1. 2022;(197):1–42 [PubMed] [Google Scholar]
- 2.Wei R, Ogden CL, Parsons VL, et al. A method for calculating BMI z-scores and percentiles above the 95th percentile of the CDC growth charts. Ann Hum Biol. 2020;47(6):514–521 [DOI] [PMC free article] [PubMed] [Google Scholar]
- 3.Centers for Disease Control and Prevention. Defining childhood weight status. Available at: https://www.cdc.gov/obesity/basics/childhood-defining.html. Accessed February 21, 2023
- 4.Hampl SE, Hassink SG, Skinner AC, et al. Clinical practice guideline for the evaluation and treatment of children and adolescents with obesity. Pediatrics. 2023;151(2):e2022060640. [DOI] [PubMed] [Google Scholar]
- 5.Centers for Disease Control and Prevention. Data file for the extended CDC BMI-for-age growth charts for children and adolescents. Available at: https://www.cdc.gov/growthcharts/extended-bmi-data-files.htm. Accessed June 15, 2023
- 6.CDC National Center for Health Statistics. National Health and Nutrition Examination Survey. Available at: https://www.cdc.gov/nchs/nhanes/index.htm. Accessed May 10, 2022
- 7.CDC National Center for Health Statistics. NHANES response rates. Available at: https://wwwn.cdc.gov/nchs/nhanes/ResponseRates.aspx. Accessed February 28, 2020
- 8.Fakhouri THI, Martin CB, Chen TC, et al. An investigation of nonresponse bias and survey location variability in the 2017–2018 National Health and Nutrition Examination Survey. Vital Health Stat 2. 2020;(185):1–36 [PubMed] [Google Scholar]
- 9.Parker JD, Talih M, Malec DJ, et al. National Center for Health Statistics data presentation standards for proportions. Vital Health Stat 2. 2017;(175):1–22 [PubMed] [Google Scholar]
- 10.Flegal KM, Wei R, Ogden CL, et al. Characterizing extreme values of body mass index-for-age by using the 2000 Centers for Disease Control and Prevention growth charts. Am J Clin Nutr. 2009; 90(5):1314–1320 [DOI] [PubMed] [Google Scholar]