Abstract
4,6-Bis(3,5-dimethyl-1H-pyrazol-1-yl)-N-phenyl-1,3,5-triazin-2-amine (PTA-1), N-(4-bromophenyl)-4,6-bis(3,5-dimethyl-1H-pyrazol-1-yl)-1,3,5-triazin-2-amine (PTA-2) and 4,6-bis(3,5-dimethyl-1H-pyrazol-1-yl)-N-(4-methoxyphenyl)-1,3,5-triazin-2-amine (PTA-3) were synthesized and characterized. Their corrosion inhibition of carbon C-steel in 0.25 M H2SO4 was studied by electrochemical impedance. The inhibition efficiency (IE%) of triazine was superior due to the cumulative inhibition of triazine core structure and pyrazole motif. Potentiodynamic polarizations suggested that s-triazine derivatives behave as mixed type inhibitors. The IE% values were 96.5% and 93.4% at 120 ppm for inhibitor PTA-2 and PTA-3 bearing –Br and –OCH3 groups on aniline, respectively. While PTA-1 without an electron donating group showed only 79.0% inhibition at 175 ppm. The adsorption of triazine derivatives followed Langmuir and Frumkin models. The values of adsorption equilibrium constant K°ads and free energy change ΔG°ads revealed that adsorption of inhibitor onto steel surface was favoured. A corrosion inhibition mechanism was proposed suggesting the presence of physical and chemical interactions. Density functional theory computational investigation corroborated nicely with the experimental results. Monte Carlo simulation revealed that the energy associated with the metal/adsorbate arrangement dE ads/dN i, for both forms of PTA-2 and PTA-3 with electron donating groups (−439.73 and −436.62 kcal mol−1) is higher than that of PTA-1 molecule (−428.73 kcal mol−1). This aligned with experimental inhibition efficiency results.
Keywords: 1,3,5-triazines; C-steel; electrochemical studies; anti-corrosion; density functional theory calculations; Monte Carlo simulation
1. Introduction
Owing to their strength and cost effectiveness, iron alloys are undoubtedly considered as the efficient constructive backbones of metallic structures [1]. Due to its widespread applications, iron steel is being used in almost every aspect of our daily lives and, consequently, is subjected to constant modifications to enhance structural features [2,3].
Corrosion of iron-containing metals, including carbon steel, cast iron and other alloys, poses a major challenge that can lead to significant metallic losses and substantial reduction in their mechanical properties [4]. The structural changes caused by corrosion is due to the degradation of iron content and the formation of brittle layers of rust. It is estimated that corrosion can lead to the loss of approximately 10% of the world’s total metal output [5–7]. A common economic impact of corrosion on industries is related to the damaged facilities which may require the maintenance, repair or replacement of corroded equipment. Nevertheless, certain applications can avoid leakages or fractures that may lead to fatalities and are of serious environmental concerns [8–11].
Carbon steel is one of the readily available, low-cost iron alloys that contains up to 1% carbon. It is primarily used in the oil and gas industry to manufacture machines, wire ropes, seawater petroleum pipelines and other industrial appliances [11]. However, carbon steel is highly vulnerable to corrosion and considered unstable under acidic conditions which causes major metallic destruction, leading to tremendous economic losses.
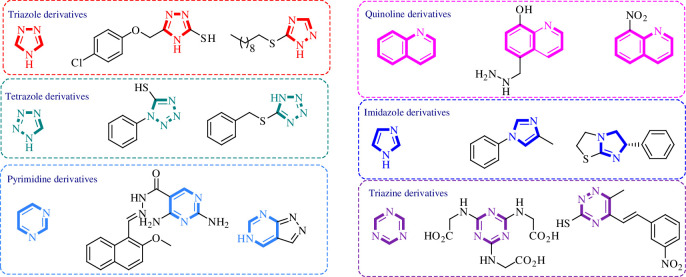
Corrosion prevention methods are specific protocols and strategies that are associated with decreasing the losses and damages caused by corrosion on industrial scale [12,13]. Each method depends on several factors including the type of corrosion, metal surface, pH of the medium, temperature and other relevant aspects. Accordingly, several protocols have been reported to mitigate the harmful impact of corrosion including design modification [14], sacrificial anodes [15,16] and surface coating [17–19]. The latter method relies on the formation of a protective layer using a proper material that suits both the type of metal and the environmental conditions to prevent the phenomenon of corrosion. The mechanism of this strategy is based on the adsorption of the protective material on the surface of the metal to form a protective layer. Several approaches highlighted the application of nanocomposites [20], inorganic compounds [21,22] and natural extracts [23] as cheap corrosion inhibitors with diversified applications and high durability on the metallic surface. At the same time, several studies reported toxicity concerns regarding the high concentrations of some inhibition agents such as hexavalent chromium [24,25] and mercapto-benzothiazole derivatives [26]. In addition, structurally diversified heterocyclic organic molecules have also been explored as efficient corrosion inhibition agents (figure 1). Due to the presence of π-bonds and heteroatoms such as nitrogen (N), oxygen (O) and sulfur (S), these compounds exhibit excellent corrosion inhibition profiles because the heteroatoms are known to ease the adsorption process on the metal surface which assists in protection of the metallic surface from corrosion. There is a large number of heterocyclic structures which have been reported as corrosion inhibitors including triazoles [27], tetrazoles [28], pyrimidines [29], quinolones [30], imidazoles [31], triazines [32], isoxazoles [33], pyrazoles [34], pyridines [35], pyrazines [36], pyridazines [37] and many more.
Figure 1.
Representative examples illustrating application of heterocyclic organic molecules as efficient corrosion inhibitors.
The new s-triazines prepared are expected to provide an anticorrosion coat for steel and iron in analogy with other related organic inhibitors, which when mixed with other ingredients provide uniform coating, dried surface and being less permeable to water and oxygen. The applied coatings can have a lifetime of up to 10 years [38].
Moreover, density functional theory (DFT) has been applied to predict the corrosion inhibition efficiency of organic molecules and to design efficient corrosion inhibitors [39].
Recently, Xuehui et al. [40] described the inhibitive effect of 2,4,6-tri(2-pyridyl)-s-triazine (TPT, figure 2) on the corrosion of steel in 1 M hydrochloric acid (HCl). Scanning electron microscopy (SEM) analysis indicated that the metal was protected from destructive corrosion by the addition TPT.
Figure 2.
Tripyridyl and triphenyl s-triazine derivatives as corrosion inhibitors [40,41].
More recently, five prepared triazines Ia–e were reported as corrosion inhibitors of steel in 1 N HCl solution. The inhibitory action of the triazines depended on the type of electronic groups present (figure 2) [41].
Very recently, the El-Faham group [42–44] reported several hydrazino-s-triazine derivatives (figure 3). They suggested that the number of hydrazino groups plays a vital role in the inhibition of corrosion. Additionally, the presence of oxygen as in 2,4-dihydrazino-6-morpholino-1,3,5-triazine (DHMT), 2,4-dihydrazino-6-methoxy-1,3,5-triazine (DHMeT) and 2-hydrazino-4,6-dimethoxy-1,3,5-triazine (DMeHT) renders the compounds more protected due to the formed film on the steel surface through lone pair sharing.
Figure 3.
Hydrazino-s-triazine derivatives as corrosion inhibitors [42–44].
Owing to significant interests of scientific community in preparing efficient organic corrosion inhibitors, we reported a facile synthesis of novel tri-substituted 1,3,5-triazine containing pyrazole ring and aromatic amines (figure 4) [45]. The synthesized compounds were subjected to detailed synergistic experimental and computational studies to evaluate their potential application as efficient corrosion inhibitors for carbon steel in an acidic medium. Thus, the newly prepared structures 4,6-bis(3,5-dimethyl-1H-pyrazol-1-yl)-N-phenyl-1,3,5-triazin-2-amine (PTA-1), N-(4-bromophenyl)-4,6-bis(3,5-dimethyl-1H-pyrazol-1-yl)-1,3,5-triazin-2-amine (PTA-2) and 4,6-bis(3,5-dimethyl-1H-pyrazol-1-yl)-N-(4-methoxyphenyl)-1,3,5-triazin-2-amine (PTA-3) were synthesized. They contained three inhibition moieties that can have cumulative anticorrosion effects: aniline, pyrazole and triazine containing one N, two N and three N sigma electrons donor atoms, respectively, and π aromatic rings. This novel strategy makes the new compounds possess superior anticorrosion properties at low concentrations compared to other compounds reported in the literature. The PTA compounds’ inhibition reached ~95% at 120 ppm concentration, while other reported compounds in the literature required 250–5000 ppm to attain inhibition greater than ~95%. In addition, the aniline moiety has different para-substituents, namely hydrogen, bromine and methoxy (–H, –Br, –OMe), in order to explore the effect of substituent on inhibition.
Figure 4.
Structures of organic molecules synthesized and explored for application as corrosion inhibitors in this study.
Several recent reports have demonstrated the significance of computational calculations for evaluating the inhibition efficiency of organic corrosion inhibitors [46–50]. In addition, mechanisms were postulated for the physio-chemical adsorption of heterocyclic structures on the surface of metals. However, advanced progress in the topic adopted Monte Carlo (MC) simulations to provide more insight into the interactions between the corrosion inhibitors and the metal surface [51,52].
2. Experimental
2.1. General procedure for the synthesis of bispyrazolyl-s-triazine derivatives PTA-1–3
Monopyrazolyl-s-triazine derivatives PTA-1–PTA-3 synthesized by the reaction of the hydrazine-s-triazine derivatives with acetylacetone in the presence of triethylamine base gave the desired pure products in high yield by following the reported method in the literature [45] (electronic supplementary material, synthetic method).
2.2. Electrochemical measurements
The electrochemical cell used in this study consists of three electrodes. Platinum (Pt) wire was used as counter electrode. The reference electrode used was a saturated silver/silver chloride (Ag/AgCl) electrode. The working electrode consisted of carbon steel rod with the following chemical composition (wt%): carbon (C), 0.164; sulfur (S), 0.001; manganese (Mn), 0.710; phosphorus (P), 0.0005; silicon (Si), 0.26; nickel (Ni), 0.123; chromium (Cr), 0.041; and iron (Fe), balance; the exposed area of the cylindrical C-steel rod is 0.5027 cm2. The choice of substrate C-steel is because it is used in industrial oil and water pipes. The choice of corrosive medium 0.25 M H2SO4 is because this acid is used to wash pipes from build-up of undesirable coat, and eventually causing corrosion of the pipes. The test solution used in all experiments was 0.25 M H2SO4 containing different concentrations of the triazine inhibitors (10, 25, 40, 50, 60, 100, 120, 150 and 175 ppm) [23]. The compounds PTA-1, PTA-2 and PTA-3 are soluble at the concentrations used in 0.25 M H2SO4. In general, PTA-2 and PTA-3 are more soluble than PTA-1, because PTA-2 and PTA-3 contain polar groups –Br and –OCH3.
Potentiodynamic polarization (PDP) study and electrochemical impedance spectroscopy (EIS) were conducted with a Gamry reference 600 Potentiostat/Galvanostat/ZRA (Warminster, PA) using Gamry software v. 7.07. At the beginning of the experiment, the steady-state open circuit potential EOCP was recorded by immersing the electrode in the corrosion solution for 1 h until reaching a steady state, with the indication 10 mV disturbance capacity [23]. EIS was conducted in the frequency range 0.1–100 000 Hz with a signal amplitude perturbation of 10 mV around the corrosion potential [42–44]. The polarization curves were recorded with a sweep rate of 5 mV s−1, by automatically polarizing the working electrode from 500 mV versus the rest potential [43].
2.3. Computational methods
DFT [53] studies were performed using Gaussian 16 (revision C.01) [54] and Gaussview 6.1.1 [55] was used to generate input geometries and for visualization of the output structures. Geometry optimizations and frequency calculations for the heterocyclic structures PTA-1, PTA-2 and PTA-3 neutral and protonated forms were carried out using the B3LYP functional [56–58] with the 6-311++G(d,p) basis set [59]. Electronic and structural parameters, electronic energies and dipole moment values were obtained from the optimization and frequency calculations. The vertical ionization potentials (I) and electron affinities (A) were calculated by obtaining the excitation energetics of the neutral, radical cation and radical anion species. This approach based on excitation energetics is considered more accurate compared to generally adopted Koopmans’ theorem which approximates (I) and (A) by equating to the energy values of highest occupied molecular orbital (HOMO) and lowest unoccupied molecular orbital (LUMO), respectively. As the latter approach is generally accepted, a comparative study has also been conducted. Quantum chemical parameters were calculated from the obtained values of (I) and (A), which have been extensively studied to rationalize the corrosion inhibition efficiency of organic inhibitors [60]. The calculations were initially performed in the gaseous phase; however, for comparison and to model the solvation effect, the optimization and frequency calculations were carried out by employing the integral equation formalism (IEF) version of polarized continuum model (PCM) solvation model for water (relative permittivity ε = 78.4) [61,62]. This is crucial as the corrosion process occurs in an aqueous phase. All stationary points were characterized as minima based on normal vibrational mode analysis. Thermal corrections were calculated from unscaled frequencies, assuming a standard state of 298.15 K and 1 atm. The structures presented here are the lowest energy-optimized conformers.
2.4. Monte Carlo simulations
The proper adsorption arrangements of the PTA1, PTA2 and PTA 3 molecules on the Fe(110) surface were determined using the adsorption locator module in the Materials Studio v. 7.0 program [63]. Initially, the adsorbate molecules were optimized using the COMPASS force field [64]. Subsequently, the adsorption of the investigated inhibitors, including Cl− ions, hydronium ions and water molecules, with the Fe(110) surface was simulated within a simulation box measuring 37.24 × 37.24 × 59.81 Å3 [65].
3. Results and discussion
3.1. Synthesis of inhibitors
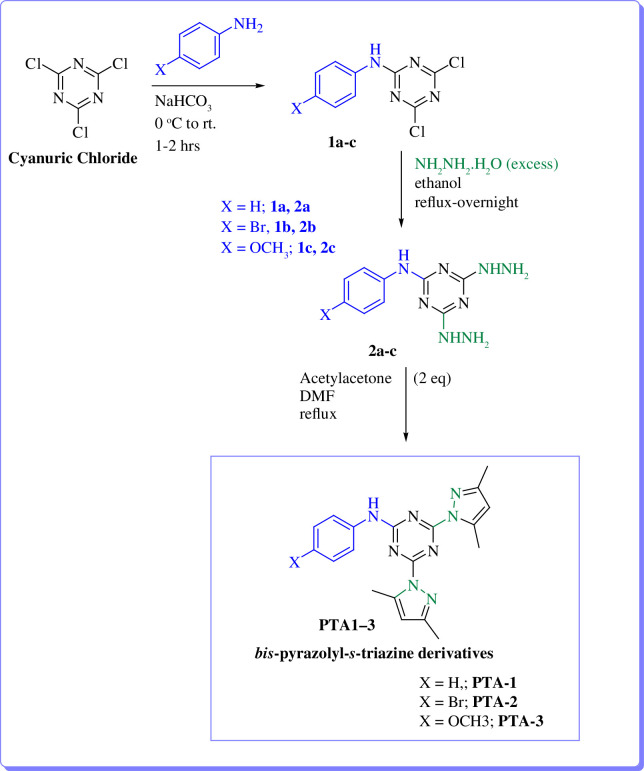
To explore further the application of the s-triazine-based molecules as corrosion inhibitors, three compounds having different electronic effects with either electron donating or withdrawing effects were selected, resynthesized and characterized by the El-Faham group [45]. The target compounds were prepared according to scheme 1 [45,66].
Scheme 1.
Synthesis pathway of s-triazine derives PTA-1–PTA-3 [45].
The structures of the three derivatives PTA-1–PTA-3 were confirmed by NMR and agreed with the reported data [45] (electronic supplementary material, synthetic method).
FTIR analysis was conducted with a Shimadzu 8300 FTIR spectrophotometer between 500 and 4000 cm−1 in order to characterize the three Scheme 1compounds. Their FTIR spectra are shown in electronic supplementary material, figure S1. The FTIR absorption peak wavenumbers (cm−1) were observed for PTA-1: 3256.2, 3001.6, 29369.9, 1601.1, 1578.0, 1551.0, 1489.2, 1404.4, 1350.3, 1142.0, 1045.5, 987.7, 817.9, 760.1, 702.2, 698.3, 582.6; for PTA-2: 3306.4, 3024.8, 2963.0, 1597.3, 1547.1, 1396.6, 1385.1, 1138.1, 1095.7, 1041.7, 980.0, 814.1 756.2, 663.6, 586.4; and for PTA-3: 3206.1, 3115.9, 2997.7, 2932.2, 2835.7, 1593.4, 1512.4, 1408.2. 1365.8, 1230.7, 1176.7, 1130.4, 1037.8, 976.1, 806.3, 744.6, 559.4.
3.2. Electrochemical impedance studies
The open circuit potential (OCP) was measured in the blank (0.25 M H2O4) and in the presence of inhibitors PTA-1, PTA-2 and PTA-3. The system could reach almost steady state after 1 h of OCP test. Therefore, 1 h is chosen as stabilization time for further EIS and polarization measurements. As the concentration of PTA-1 increased, the values of OCP are changed toward more positive values compared with the OCP value in the blank. This can be explained by the formation of an inhibition film on the carbon steel surface (electronic supplementary material, figure S2a) [67]. While there was no obvious trend in the case of PTA-2 and PTA-3 (electronic supplementary material figure S2b,c). In the case of PTA-3, the OCP values were more positive than that of the blank up to 1000 s, then they shifted to more negative values towards more cathodic ones. Similar trend was observed in the case of PTA-2 with some exceptions [68].
EIS data were fitted by electrical equivalent circuits (EECs) model 1, 2 and 3.
The EEC model 1 comprised a solution resistance (R s) and two circuits (time constants) connected in series. The first time constant consisted of a film resistance (R f) in parallel with film constant phase element (CPEf, figure 5a ) [44]. While the second time constant contains a charge transfer resistance (R ct) in parallel with a constant phase element of double-layer CPEdl as shown in figure 5a . The double-layer capacitance (C dl) can be computed from R ct, the impedance of CPEdl (Z CPE) and the exponents of CPEdl (n) [69].
Figure 5.
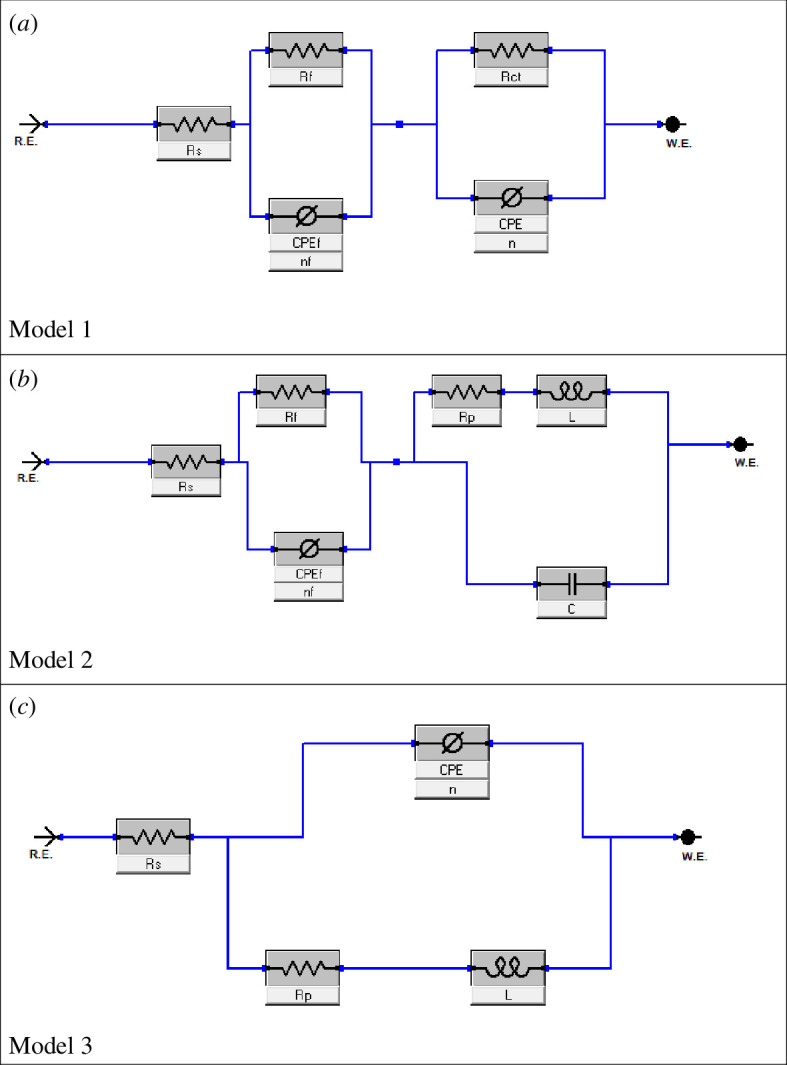
Equivalent circuits (a) model 1, (b) model 2 and (c) model 3 used to fit the impedance data.
EEC model 2 (figure 5b ) is like EEC model 1, but a pure double layer capacitor (C dl) replaced the constant phase element (CPEdl) and polarization resistance R p relaced R ct of model 1. Where R p has two contributions R ct and inductor resistance R L. Additionally, an inductance L component was added in model 2 [70] in order to account for the small inducive loop at low frequencies. The inductance L is the tendency of an electric conductor to oppose a change in the electric current flowing through it. The SI unit of inductance is henry abbreviated as H.
EEC model 3 (figure 5c ) comprised a solution resistance (R s) and one circuit (time constant). The circuit consisted of a constant phase element (CPE), a resistance (R p) and an inductance element (L); R p having contribution from both film resistance (R f) and charge transfer resistance (R ct).
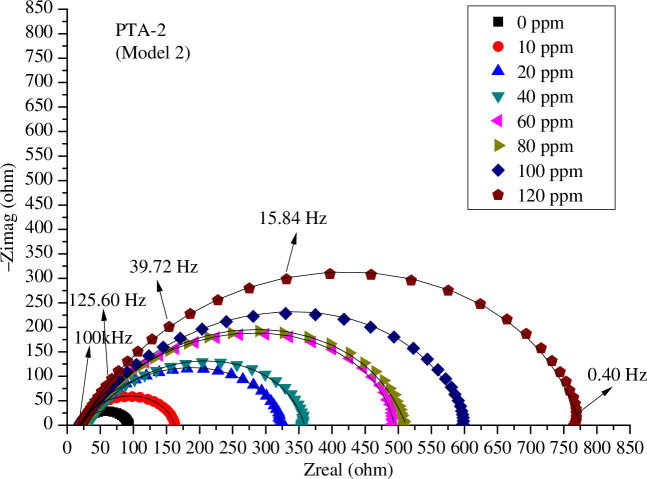
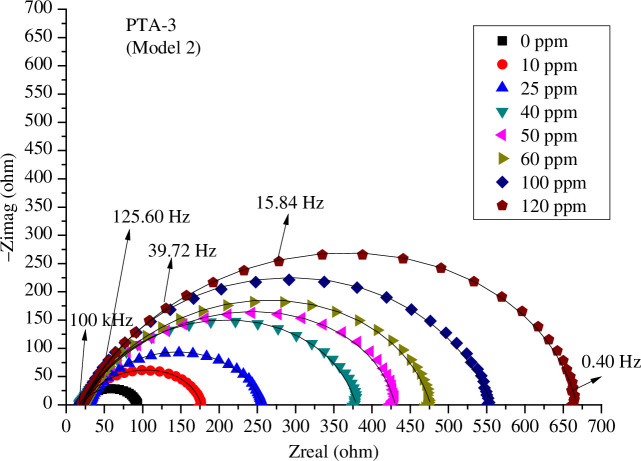
The influence of concentrations of PTA-1, PTA-2 and PTA-3 on the Nyquist plots of C-steel in 0.25 M sulfuric acid solution is shown, respectively, in figures 6–8 using model 2; and electronic supplementary material, figure S3a–c, using model 1, and figure S3d–f, using model 3. It is obvious that the higher the concentration of PTA-1, PTA-2 and PTA-3, the larger the size of the capacitive loops.
Figure 6.
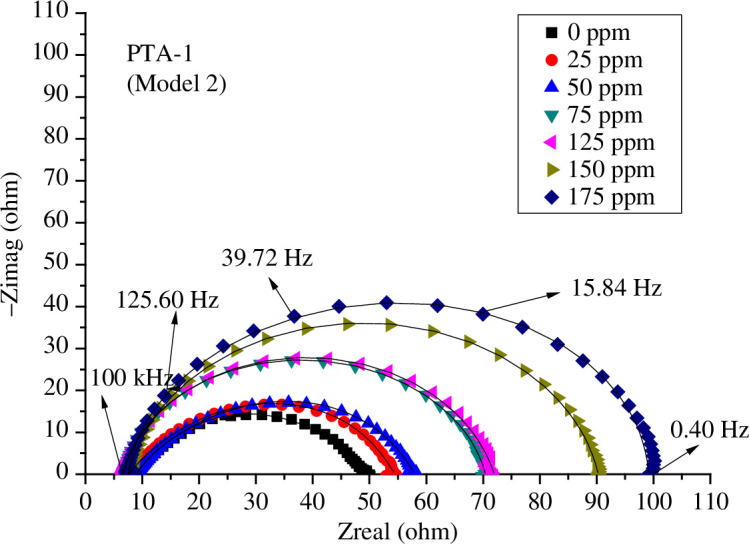
Nyquist plots of s-triazine (PTA-1) at different concentrations and 298 K in 0.25 M H2SO4 fitted by model 2.
Figure 7.
Nyquist plots for s-triazine (PTA-2) at different concentrations and 298 K in 0.25 M H2SO4 fitted by model 2.
Figure 8.
Nyquist plots for s-triazine (PTA-3) at different concentrations and 298 K in 0.25 M H2SO4 fitted by model 2.
It should be noted that the fitting by EEC model 3 using one time constant was not good since it deviated well from the experimental value (electronic supplementary material, figure S3d–f). That is why we have used two time constants in model 1 and model 2 [23,35]. Model 2 has the advantage of accounting for the inductance loop; the fitting of Nyquist plots was also perfect (figures 6–8). In general, every semicircle in the Nyquist plot should be represented by one time constant, but it happened as it is in the present case, two time constants show only one major semicircle in the Nyquist plot. The first semicircle can be very small at high frequency and merged with the larger semicircle as was found in other studies. Thus, the first semicircle was not observed due to the high-frequency limit [35].
All the measured impedance parameters are reported in tables 1–3 by using model 2 and electronic supplementary material, tables S1–S3, by using model 1 for PTA-1, PTA-2 and PTA-3, respectively. The inhibition efficiency %IE = 100 × Ɵ and the surface coverage Ɵ = 1 – [R (0)/R (i)] were calculated; where R = R ct + R f for model 1 and R = R p + R f for model 2 [23].
Table 1.
Impedance parameters for PTA-1 on C-steel in 0.25 M sulfuric acid by fitting the equivalent circuit model 2 (± error).
| PTA-1 | R s | R f | n f | Z CPEf | R p | C dl | R f + R p | θ | IE% | L |
|---|---|---|---|---|---|---|---|---|---|---|
| ppm | Ω cm2 ± 0.33 | Ω cm2 ± 1.88 | ± 0.13 | µΩ−1s n cm−2 ± 21.71 | Ω cm2 ± 2.22 | μF cm−2 ± 11.71 | Ω cm2 ± 4.1 | ± 0.60 | H | |
| 0 | 4.50 | 19.62 | 0.709 | 1024 | 0.98 | 3266 | 20.60 | 0.0000 | 0.00 | 2.88E-07 |
| 25 | 3.86 | 15.18 | 0.677 | 1679 | 8.36 | 1121 | 23.54 | 0.1248 | 12.48 | 1.64E-02 |
| 50 | 4.45 | 16.89 | 0.686 | 1351 | 7.83 | 953 | 24.72 | 0.1668 | 16.68 | 1.31E-05 |
| 75 | 3.36 | 22.44 | 0.860 | 450 | 9.60 | 391 | 32.04 | 0.3570 | 35.70 | 1.02E-05 |
| 125 | 3.24 | 19.36 | 0.808 | 641 | 13.58 | 350 | 32.94 | 0.3747 | 37.47 | 1.38E-02 |
| 150 | 3.85 | 27.19 | 0.859 | 336 | 14.35 | 354 | 41.53 | 0.5040 | 50.40 | 1.63E-02 |
| 175 | 3.77 | 20.35 | 0.917 | 250 | 25.71 | 269 | 46.06 | 0.5528 | 55.28 | 2.03E-03 |
Table 2.
Impedance parameters for PTA-2 on C-steel in 0.25 M sulfuric acid by fitting the equivalent circuit model 2 (± error).
| PTA-2 | R s | R f | n f | Z CPEf | R p | C dl | R f+ R p | θ | IE% | L |
|---|---|---|---|---|---|---|---|---|---|---|
| ppm | Ω cm2 ± 0.48 | Ω cm2 ± 3.64 | ± 0.035 | µΩ−1 s n cm−2 ± 12.22 | Ω cm2 ± 4.10 | µF cm−2 ± 7.4 | Ω cm2 ± 7.74 | ± 0.55 | H | |
| 0 | 10.29 | 19 | 0.748 | 855 | 17.42 | 431 | 36.42 | 0.0000 | 0.00 | 2.67E-06 |
| 10 | 9.43 | 28.54 | 0.687 | 798 | 43.83 | 203 | 72.37 | 0.4968 | 49.68 | 7.63E-02 |
| 20 | 9.53 | 83.8 | 0.731 | 256 | 70.03 | 201 | 153.83 | 0.7632 | 76.32 | 1.62E-01 |
| 40 | 14.95 | 77.16 | 0.721 | 281 | 88.32 | 147 | 165.49 | 0.7799 | 77.99 | 1.77E-01 |
| 60 | 10.58 | 111.75 | 0.761 | 158 | 126.28 | 111 | 238.03 | 0.847 | 84.70 | 2.49E-04 |
| 80 | 10.81 | 109.54 | 0.671 | 314 | 137.59 | 98 | 247.13 | 0.8526 | 85.26 | 2.37E-03 |
| 100 | 9.28 | 129.85 | 0.716 | 185 | 162.32 | 107 | 292.17 | 0.8753 | 87.53 | 5.66E-01 |
| 120 | 10.17 | 160.31 | 0.715 | 197 | 219.58 | 74 | 379.89 | 0.9041 | 90.41 | 4.53E-01 |
Table 3.
Impedance parameters for PTA-3 extract on C-steel in 0.25 M sulfuric acid by fitting the equivalent circuit model 2 (± error).
| PTA-3 | R s | R f | n f | Z CPEf | R p | C dl | R f + R p | θ | IE% | L |
|---|---|---|---|---|---|---|---|---|---|---|
| ppm | Ω cm2 ± 0.41 | Ω cm2 ± 4.75 | ± 0.05 | µΩ−1 s n cm−2 ± 11 | Ω cm2 ± 4.64 | µF cm−2 ± 5.5 | Ω cm2 ± 11.55 | ± 0.50 | H | |
| 0 | 10.29 | 19 | 0.748 | 855 | 17.42 | 431 | 36.42 | 0.00 | 0.00 | 2.67E-06 |
| 10 | 11.36 | 48.09 | 0.803 | 272 | 29.26 | 359 | 77.36 | 0.53 | 52.91 | 6.37E-02 |
| 25 | 14.44 | 61.38 | 0.742 | 388 | 53.54 | 169 | 114.92 | 0.68 | 68.30 | 9.18E-02 |
| 40 | 8.56 | 74.7 | 0.698 | 395 | 107.93 | 129 | 182.63 | 0.80 | 80.05 | 2.52E-01 |
| 50 | 10.33 | 99.94 | 0.754 | 182 | 106.27 | 122 | 206.21 | 0.82 | 82.33 | 2.05E-01 |
| 60 | 11.34 | 114.46 | 0.749 | 207 | 114.01 | 123 | 228.48 | 0.84 | 84.06 | 2.55E-01 |
| 100 | 8.64 | 111.8 | 0.674 | 491 | 160.76 | 109 | 272.56 | 0.87 | 86.63 | 3.75E-01 |
| 120 | 10.28 | 148.9 | 0.754 | 180 | 177.1 | 103 | 326 | 0.89 | 88.83 | 5.27E-01 |
The Nyquist diagrams are composed of a small inducive loop at low frequencies and a great capacitive loop at high frequencies. The capacitive loop increased with increasing inhibitor concentrations. This indicated that the corrosion inhibition is governed by charge transfer [63].
It is noted that R f + R ct values measured by model 1 (electronic supplementary material, tables S1–S3) and R f + R p values by model 2 (tables 1–3) increased with increase in the amount of inhibitors PTA-1, PTA-2 and PTA-3, respectively. Also, the surface coverage of steel Ɵ increased with higher concentration due to greater amount of adsorbed PTA-1, PTA-2 and PTA-3 on the steel surface, causing higher IE% [43]. PTA-2 and PTA-3 having electron rich groups –Br and –CH3 showed a maximum inhibition value IE% computed from both models 1 and 2, 90.4% and 88.83%, respectively, at the concentration 120 ppm (electronic supplementary material, tables S2 and S3; tables 3 and 4). While PTA-1 has 57.9% at 175 ppm (electronic supplementary material, table S1; table 1). The compounds PTA-1, PTA-2 and PTA-3 are soluble at the concentrations studied. The solubility increased in the following order: PTA-1 < PTA-3 < PTA-2. Thus, this electrochemical study could not cover inhibition at wider concentration range; at higher concentration, there was no improvement in % inhibition. Additionally, precipitation of excess insoluble amounts at higher concentrations occurred in the case of inhibitor PTA-3. Also, the semicircles of Nyquist plots obtained by impedance at higher concentrations than the optimum concentration of 120 ppm for PTA-2 and PTA-3, and 175 ppm for PTA-1 became depressed compared to the respective optimum concentrations. Thus the % inhibition values decreased instead of increasing above the optimum concentrations [62]. The CPE frequency exponent (n) values are reported in electronic supplementary material, tables S1–S3, when using EEC model 1 for PTA-1, PTA-2 and PTA-3. The increase in the n value to about 0.9 in the case of the inhibited system, compared to the n value of about 0.7 obtained in the blank acidic medium, could be related to a lessening of surface heterogeneities.
Table 4.
Phase angles and α values for PTA-1, PTA-2 and PTA-3 at various concentrations.
| 0 ppm | 25 ppm | 50 ppm | 75 ppm | 125 ppm | 150 ppm | 175 ppm | |||
|---|---|---|---|---|---|---|---|---|---|
| PTA-1 | phase angle (°) | −30.57 | −33.39 | −31.84 | −49.11 | −49.11 | −51 | −53.79 | |
| frequency (Hz) | 79.03 | 79.03 | 79.03 | 125.80 | 125.80 | 125.80 | 125.80 | ||
| slope α | −0.3286 | −0.3823 | −0.3765 | −0.5965 | −0.5917 | −0.6192 | −0.65373 | ||
| R 2 | 0.9844 | 0.9915 | 0.9946 | 0.995 | 0.9953 | 0.9951 | 0.99625 |
| 0 ppm | 10 ppm | 20 ppm | 40 ppm | 60 ppm | 80 ppm | 100 ppm | 120 ppm | ||
|---|---|---|---|---|---|---|---|---|---|
| PTA-2 | phase angle (°) | −30.92 | −41.37 | 44.79 | −42.89 | −49.57 | −48.31 | −50.3 | −54.89 |
| frequency (Hz) | 63.34 | 63.34 | 63.34 | 63.34 | 79.00 | 79.00 | 79.00 | 79.00 | |
| slope α | −0.3653 | −0.4952 | −0.5493 | −0.5194 | −0.5988 | −0.5784 | −0.59905 | −0.6588 | |
| R 2 | 0.9879 | 0.9928 | 0.9991 | 0.9976 | 0.9993 | 0.9991 | 0.99971 | 0.99971 |
| 0 ppm | 10 ppm | 25 ppm | 40 ppm | 50 ppm | 60 ppm | 100 ppm | 120 ppm | ||
|---|---|---|---|---|---|---|---|---|---|
| PTA-3 | phase angle (°) | −30.57 | −39.8 | −42.83 | −48 | −49.38 | −50.8 | −54.5 | −55.12 |
| frequency (Hz) | 79.03 | 79.03 | 79.03 | 79.03 | 79.03 | 79.03 | 79.03 | 79.03 | |
| slope α | −0.3279 | −0.4463 | −0.47 | −0.5764 | −0.5717 | −0.5717 | −0.62133 | −0.6341 | |
| R 2 | 0.9766 | 0.9901 | 0.9852 | 0.9954 | 0.9974 | 0.9965 | 0.99332 | 0.99771 |
The similarity in semicircle shapes of the Nyquist plots at different concentrations revealed that the corrosion inhibition process occurred with a charge transfer mechanism [40].
The constant phase element of double layer impedance of CPEdl (Z CPE) was also computed when using EEC model 1. The values of Z CPE (µΩ−1 s n cm−2) are presented in electronic supplementary material, tables S1–S3. In the case of PTA-2, the values decreased from 2740.1 for the blank to 358.2 for solution with concentration 120 ppm (electronic supplementary material, table S2). Also, for PTA-3, the values decreased to 322.3 for 120 ppm solution (electronic supplementary material, table S3) indicating more corrosion inhibition.
The double layer capacitance C dl was computed directly by fitting EEC model 2 using Gamry software v.7 (tables 1–3). However, when fitting data by EEC model 1, the C dl values were computed by Gamry software using R p, n and Z CPE values. C dl can be also calculated using Brug’s formula [71]
C dl values decrease with the increase in PTA-1, PTA-2 and PTA-3 concentrations. This is due to the replacement of water molecules by adsorbed molecules of lower dielectric constant. Thus, the greater the concentration of inhibitors PTA-1, PTA-2 and PTA-3, the greater the thickness of the adsorbed layer, and the smaller is the electrical capacitance [72]. Both results of increasing R f + R ct (model 1) and R f + R p (model 2), and decreasing C dl values suggest that the adsorbed PTA-1, PTA-2 and PTA-3 block the active sites on the metal surface and formed a protective coat [28].
The inductive loop in Nyquist plots (figures 6–8) can be attributed to adsorption of ions, neutral molecules or insoluble corrosive products, but may be also due to aggressive sulfate ions, which produce instability of electrode surface [70]. The inductance L values increased with increasing concentrations of inhibitors PTA-1, PTA-2 and PTA-3 (tables 1–3).
The film double layer capacitance C dlf was also calculated similarly as above form film resistance R f, film CPE frequency exponent n f and film CPE impedance Z CPEf when fitting the data by EEC model 1 for PTA-1 (electronic supplementary material, table S1). It was found that C dlf decreased from 5864.4 (for blank) to 107.9 (for 175 ppm PTA-1 solution). This decrease is expected with an increase in film coating as the concentration of inhibitors increased from 0 to 175 ppm.
3.2.1. Bode and Bode phase angle
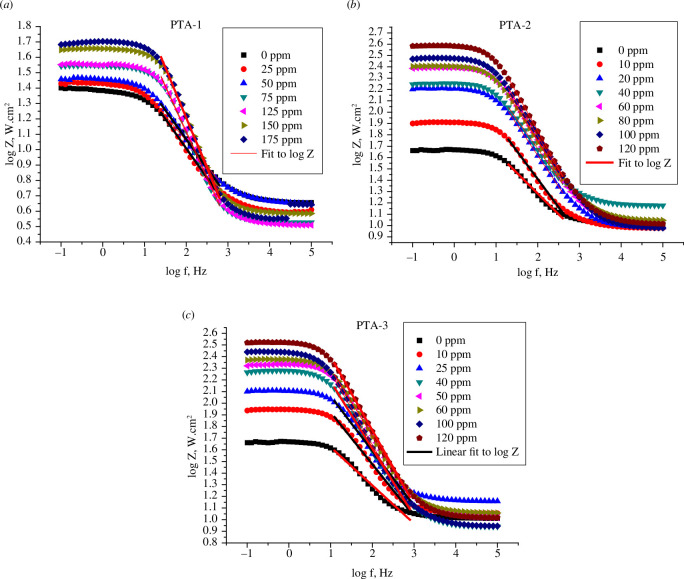
In a Bode plot, log |Z| was plotted against log f, where Z is the imaginary part of impedance in Ω cm2 and f is the frequency in Hz, for C-steel in 0.25 M H2SO4, in different concentrations of PTA-1, PTA-2 and PTA-3 (figure 9a–c ) [69].
Figure 9.
Bode plots of a C-steel electrode in 0.25 M H2SO4 solution with different concentrations of (a) PTA-1, (b) PTA-2 and (c) PTA-3.
The values of surface irregularities for C-steel, α, were calculated from the slope of the linear region of the plot. Ideal capacitors have α value equal to −1 while coarse steel has α value less than −1. It is noted that the α values increased with concentration from −0.34 (0 ppm) to −0.65373 (175 ppm) for PTA-1; −0.6588 (120 ppm) for PTA-2; and −0.6341 (120 ppm) for PTA-3 (table 4) [69].
The impedance modulus log|Z| at lowest frequency (0.1 Hz) showed an increasing trend as the concentration of triazine derivatives increased. In comparison with the blank sulfuric acid solution, the log|Z| value was improved by 1.18 orders of magnitude for the maximum concentration of 175 ppm of PTA-1 (from 1.41 to 1.67), and even more than 1.56 orders of magnitude can be obtained for PTA-2 (from 1.65 to 2.58) and 1.53 for PTA-3 (from 1.65 to 2.52). This supported the formation of more rigid adsorption layer and thus higher inhibition efficiency of PTA-2 and PTA-3 than PTA-1 for C-steel corrosion in sulfuric acid medium [73]
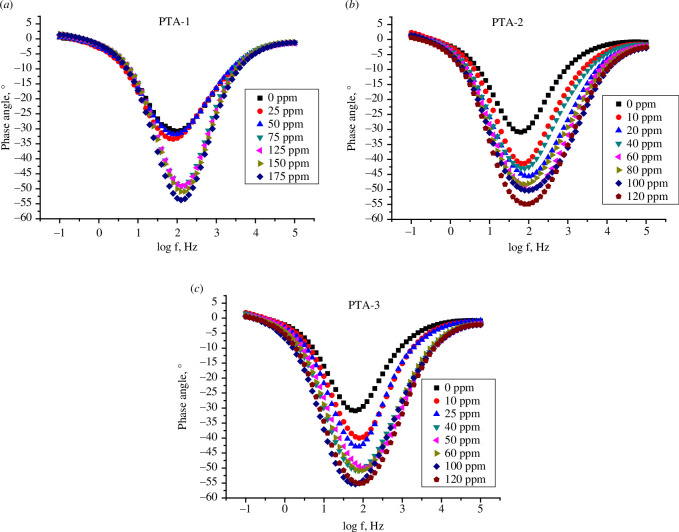
Figure 10a–c for PTA-1, PTA-2 and PTA-3 shows log Bode phase angle (°) plotted against log f (Hz) for the inhibitors. It is obvious that inhibition improved with increased inhibitor concentration since the phase angle values at the peak are more negative at higher concentrations. The phase angle values rose from −30.57° for the blank acid solution to −53.79° (PTA-1 at 175 ppm), −54.89° (PTA-2 at 120 ppm) and −55.12° (PTA-3 at 120 ppm) (table 4) and thus the inhibitive behaviour increased [43,72].
Figure 10.
Bode phase angle plots of a C-steel electrode in 0.25 M H2SO4 solution with different concentrations of (a) PTA-1, (b) PTA-2 and (c) PTA-3.
3.3. Potentiodynamic polarization study
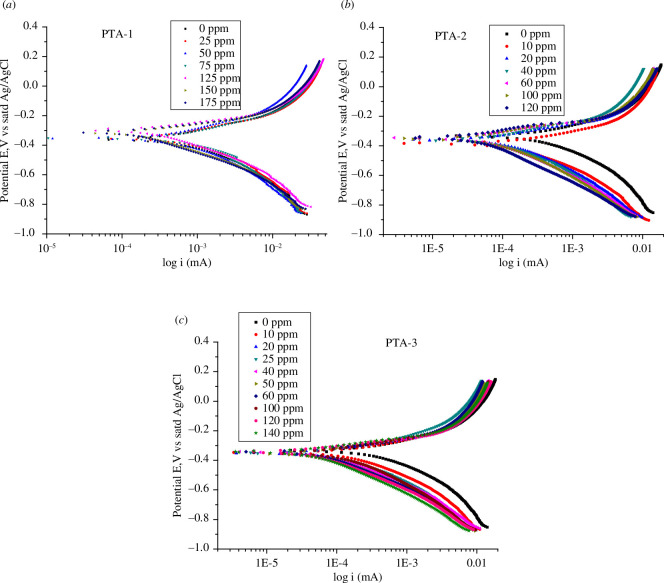
The polarization curves of the C-steel in 0.25 M H2SO4 at various concentrations of inhibitors are shown in figure 11a for PTA-1, figure 11b for PTA-2 and figure 11c for PTA-3.
Figure 11.
Semi-logarithmic polarization curves in 0.25 M H2SO4 at 298 K for all concentrations of (a) PTA-1, (b) PTA-2 and (c) PTA-3.
The PDP electrochemical kinetics parameters were obtained from the polarization curve Tafel plot using Gamry software v. 7. The region chosen to draw the straight line was arbitrary. The variation of the anodic branch towards more positive potential with increasing concentration is not as obvious as in the case of cathodic branch towards more negative potential values. This consequently indicated that corrosion inhibition is mainly of cathodic type. The corrosion potential E corr shifts in a random way to more negative values with an increase in inhibitor. The electrochemical corrosion kinetic parameters obtained from Tafel plots, corrosion potential (E corr), corrosion current density (i corr), corrosion rate (CR), cathodic and anodic Tafel slopes (β c and β a), are listed in table 5 for PTA-1, table 6 for PTA-2 and table 7 for PTA-3 [74]. It seems that the E corr values do not vary greatly with the inhibitor concentrations of PTA-2; the average value is −369.1 mV in the range 10–120 ppm (table 6). However, for PTA-1, E corr decreased from −360.0 at 0 ppm to −293.0 at 75 ppm. Then increased slightly to −310.0 at 175 ppm (table 5). E corr also decreased to −342.0 at 40 ppm of PTA-3, then changed very slightly at higher concentrations (table 7). In general, the corrosion potential E corr shift in a random way to more negative values with increase inhibitor concentration could be related to enhancement in inhibition [69].
Table 5.
Polarization parameters for various concentrations of for PTA-1 on C-steel in 0.25 M H2SO4 medium (±error).
| Tafel PTA-1 | β a (V/decade) | β c (V/decade) | i corr (μA) | E corr ±s.d. (μV ± 21) | corrosion rate (mpy) | Χ 2 | i corr ±s.d. (μA cm−2 ± 51.4) | θ | IE% ± 0.65 |
|---|---|---|---|---|---|---|---|---|---|
| 0 | 0.3037 | 0.3822 | 1450 | −360 | 1315 | 11.88 | 2884.4 | 0.000 | 0.000 |
| 25 | 0.2468 | 0.3275 | 1230 | −352 | 1119 | 8.246 | 2446.8 | 0.152 | 15.2 |
| 50 | 0.3190 | 0.3774 | 1180 | 355 | 1076 | 10.76 | 2347.3 | 0.186 | 18.6 |
| 75 | 0.2293 | 0.3082 | 686 | −293 | 623.8 | 32.42 | 1364.6 | 0.527 | 52.7 |
| 125 | 0.2117 | 0.2673 | 438 | −297 | 397.7 | 53.7 | 871.3 | 0.698 | 69.8 |
| 150 | 0.2112 | 0.2716 | 385 | −314 | 350.3 | 43.81 | 765.9 | 0.734 | 73.4 |
| 175 | 0.2017 | 0.2542 | 305 | −310 | 277.2 | 48.6 | 606.7 | 0.79 | 79 |
Table 6.
Polarization parameters for various concentrations of PTA-2 on C-steel in 0.25 M H2SO4 medium (±error).
| Tafel PTA-2 | β a (V/decade) | β c (V/decade) | i corr (μA) | E corr ± s.d. (μV ± 25) | corrosion rate (mpy) | Χ 2 | i corr ± s.d. (μA cm−2 ± 25) | θ | IE% ± 0.60 |
|---|---|---|---|---|---|---|---|---|---|
| 0 | 0.3037 | 0.3822 | 1450 | −360 | 1315.00 | 11.88 | 2884.4 | 0.000 | 0.0 |
| 10 | 0.2497 | 0.3232 | 316 | −384 | 287.50 | 31.7 | 628.6 | 0.782 | 78.2 |
| 20 | 0.2294 | 0.3154 | 212 | −360 | 192.40 | 23.93 | 421.7 | 0.854 | 85.4 |
| 40 | 0.2494 | 0.341 | 202 | −360 | 183.50 | 21.05 | 401.8 | 0.861 | 86.1 |
| 60 | 0.2009 | 0.2813 | 113 | −347 | 102.30 | 31.41 | 224.8 | 0.922 | 92.2 |
| 80 | 0.2056 | 0.2872 | 106 | −398 | 96.80 | 31.79 | 210.9 | 0.927 | 92.7 |
| 100 | 0.1782 | 0.2652 | 70 | −345 | 63.55 | 34.45 | 139.1 | 0.952 | 95.2 |
| 120 | 0.173 | 0.2474 | 51 | −390 | 46.34 | 39.42 | 101.4 | 0.965 | 96.5 |
Table 7.
Polarization parameters for various concentrations of PTA-3 on C-steel in 0.25 M H2SO4 medium (±error).
| Tafel PTA-3 | β a (V/decade) | β c (V/decade) | i corr (μA) | E corr ± s.d. (μV ± 22) | corrosion rate (mpy) | Χ 2 | i corr ± s.d. (μA cm−2 ± 27) | θ | IE% ± 0.55 |
|---|---|---|---|---|---|---|---|---|---|
| 0 | 0.3037 | 0.3822 | 1450 | −360 | 1315 | 11.88 | 2884.4 | 0 | 0 |
| 10 | 0.2562 | 0.3332 | 336 | −346 | 305.3 | 11.88 | 668.4 | 0.768 | 76.8 |
| 25 | 0.2488 | 0.3185 | 225 | −350 | 204.4 | 20.17 | 447.6 | 0.845 | 84.5 |
| 40 | 0.2089 | 0.2701 | 139 | −342 | 126.6 | 37.72 | 276.5 | 0.904 | 90.4 |
| 50 | 0.2161 | 0.284 | 140 | −352 | 126.9 | 31.76 | 278.5 | 0.903 | 90.3 |
| 60 | 0.2172 | 0.2838 | 133 | −345 | 120.6 | 34.56 | 264.6 | 0.908 | 90.8 |
| 100 | 0.2004 | 0.2626 | 115 | −339 | 104.9 | 41.2 | 228.8 | 0.921 | 92.1 |
| 120 | 0.1908 | 0.2601 | 92 | −342 | 83.72 | 37.49 | 183.2 | 0.936 | 93.6 |
On the other hand, the decrease in current density i corr (μA cm−2) and corrosion rates CR (mpy) was obvious for all three compounds, where mpy is mils per year. i corr and CR decrease from 1450.0 and 1315.00 for blank solution to 305.00 and 277.20 for PTA-1 at 175 ppm; 51.0 and 46.34 for PTA-2 at 120 ppm; 92.1 and 83.72 for PTA-3 at 120 ppm. Thus, PTA-2 showed the highest inhibition efficiency among the three compounds studied since it has the lowest i corr and CR at 120 ppm. This indicates that the para-bromo group on the phenyl of triazine compound PTA-2 affects i corr and CR strongly, then followed by the para-methoxy group in the case of PTA-2. Thus, the inhibition efficiency IE% of anticorrosion follows the order PTA-2 (96.5%) > PTA-3 (93.4%) > PTA-1 (79.0%).
Increasing the amounts of inhibitors shifted the cathodic curves more than the anodic curves to smaller corrosion current density (i corr) (figure 11a–c ). Thus, the addition of the inhibitors affected the cathodic proton-discharge (hydrogen-evolution) reaction more than the rate of anodic iron dissolution. This indicated that anticorrosion inhibition is a mixed type dominated by cathodic inhibition [40].
It can be seen from tables 5–7 that the values of cathodic slope β c (mV dec−1) and anodic slope β a (mV dec−1) decreased with increasing inhibitor concentrations. The decrease extent of βc and β a was in the order PTA-2 > PTA-3 > PTA-1. The β c values at the highest concentration of inhibitors were 0.2542, 0.2474 and 0.2601 (mV dec−1) for PTA-1, PTA-2 and PTA-3, respectively. This indicated that PTA-2 showed better inhibitory efficiency compared to the other two inhibitors [64]. The inhibition efficiency IE% and the surface coverage θ values were calculated from corrosion current density (i corr) values as described in [69,73]. The inhibitory efficiency IE% increased with the increase in inhibitor concentration, reaching the greatest values of 79.0% for PTA-1 at 175 ppm, 96.5% for PTA-2 at 120 ppm and 93.6% for PTA-3 at 120 ppm (tables 5–7). These values are in good agreement with the results from impedance studies except for PTA-1.
3.4. Adsorption isotherm
The experimental data were fitted to Langmuir, Temkin and Frumkin isotherms. The Langmuir adsorption isotherm equation (3.1) related to the surface coverage (θ) and the concentration of inhibitor (C) as [42,43]:
| (3.1) |
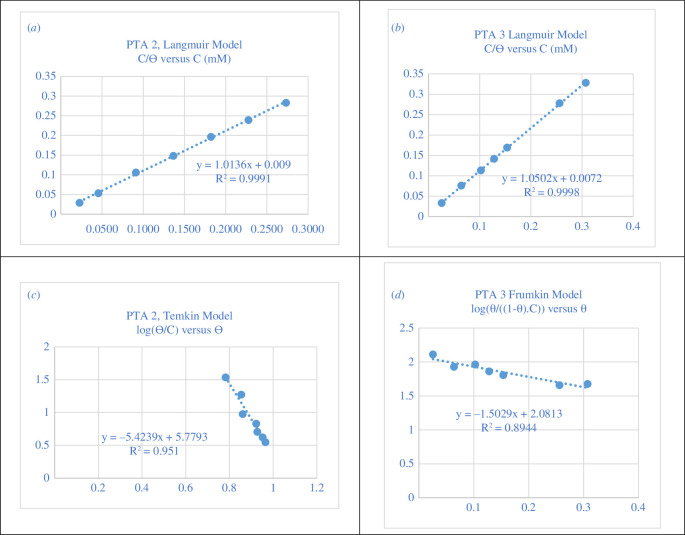
where C (mM) is the inhibitor concentration and K ads is the adsorption equilibrium constant. The straight lines obtained by plotting C/θ versus C in mM [62] are shown in figure 12a,b . The data fitted well with the Langmuir adsorption isotherm for PTA-2 and PTA-3 with regression coefficient R 2 = 0.9991 and 0.9998, respectively. While Langmuir fitting for PTA-1 gave R 2 of only 0.7305. The slope values for PTA-2 and PTA-3 are 1.014 and 1.050, close to 1.00 the theoretical value expected from the Langmuir equation.
Figure 12.
Langmuir adsorption isotherm of (a) PTA-2 and (b) PTA-3; (c) Temkin adsorption isotherm of PTA-2; (d) Frumkin adsorption isotherm of PTA-3 for all concentrations on carbon steel electrode in 0.25 M H2SO4 at 298 K.
The fitting of the Temkin model was carried by plotting log(θ/C) versus θ, according to equation (3.2) (figure 12c ) [74]:
| (3.2) |
where g is the adsorbate parameter. The R2 values obtained from the straight line for PTA-1, PTA-2 and PTA-3 are 0.3933, 0.9510 and 0.8852, respectively. Thus, the Temkin model is less acceptable than Langmuir model.
The data were also fitted to the Frumkin model (figure 12d and electronic supplementary material, figure S4), equation (3.3) [74]:
| (3.3) |
The plot of log[θ/(1 − θ)C)] versus θ gave R 2 values of 0.3503 and 0.8944, also less than that of the Langmuir model, for PTA-2 and PTA-3 (figure 12d ). But, Frumkin model R 2 is 0.8678 for PTA-1 which is higher than that obtained by the Langmuir model (electronic supplementary material, figure S4). Thus, the Langmuir model is suitable for PTA-2 and PTA-3 while the Frumkin model is more suitable for PTA-1 (electronic supplementary material, figure S2).
The standard free energy of adsorption (ΔG° ads) is related to the adsorption constant (K ads) by the following equation [42,43,75]:
| (3.4) |
where R is the universal gas constant, T is the absolute temperature and 55.5 is the molar concentration of water in the solution. K ads values were found equal to 2.73 × 10³, 1.11 × 10⁵ and 1.39 × 10⁵ for PTA-1, PTA-2 and PTA-3, respectively. The calculated values of ΔG° ads on C-steel are −38.76 kJ mol−1 for PTA-2 and −39.32 kJ mol−1 for PTA-3. In the case of PTA-1, ΔG°ads was found to be −29.58 kJ mol−1 [43]. This indicated that adsorption of inhibitor on steel surface is favoured over its presence in solution [76].
The para substituents –Br and –OCH3 on the aniline moiety of PTA-2 and PTA-3, respectively, are polar which has the effect of increasing the solubility of inhibitors in aqueous acidic media. Also, the presence of lone electron pairs on the para substituents rendered the inhibitors to act as Lewis bases that can donate electrons to Fe of the electrode surface. This is supported by very high negative ΔG° ads value of PTA-2 and PTA-3. While PTA-1 with no para substituent had less interaction with Fe surface and showed smaller ΔG° ads values.
3.5. Adsorption mechanism
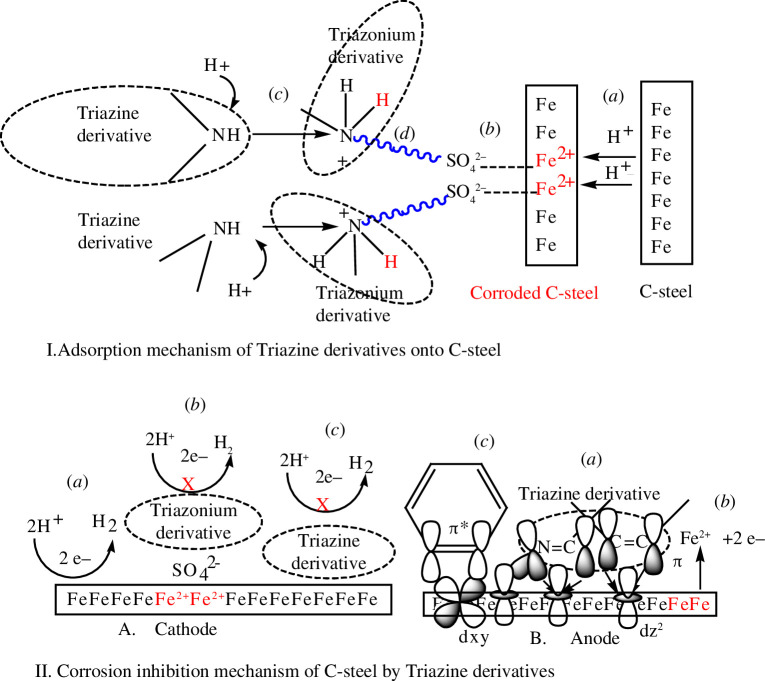
Physical adsorption of the triazine derivatives is caused by electrostatic interactions between the protonated compounds PTA-1, PTA-2 and PTA-3, and the negatively charged steel surface as shown in figure 13I [43,72].
Figure 13.
Proposed representation of (I) physical adsorption of triazines onto C-steel in 0.25 M H2SO4 solution and (II) inhibition mechanism at (A) the cathode and (B) the anode as well as physical adsorption (A. b ) and chemical adsorption (B. a ) and (c).
-
—
First, iron cation Fe2+ is formed by oxidation of Fe as a result of attack of acid H2SO4 onto the surface of C-steel.
-
—
SO4 2− anion from H2SO4 is attracted to the positively charged steel surface containing Fe2+ through electrostatic interactions, causing the surface of C-steel to become negatively charged
-
—
The triazine derivatives PTA-1, PTA-2 and PTA-3 are converted to positively charged triazonium forms by the attack of proton H+.
-
—
The positive triazonium species adsorb onto negatively charged C-steel via electrostatic interaction.
Chemical adsorption of the triazine derivatives onto the C-steel surface occurred through formation of coordinate bonds between electron-rich functional groups of triazine with empty d-orbital of Fe atom or Fe2+ ion. >C=N of imine of triazine and diazole rings, and >C=C< of phenyl ring group can share π electrons. The presence of methyl groups (electron donor by inductive effect) on the imidazole ring in place of H atoms increases electron donation of functional groups. While –N= and N< can share free electron pair as in PTA-1 (figure 13IIBa). PTA-2 and PTA-3 have additionally extra free electron pair donor groups, –Br and –OMe, respectively [44].
Chemical adsorption of the triazine onto C-steel surface can also occur through π-electron back donation from Fe d t2g orbital onto empty π* orbital of aromatic rings of s-triazines: phenyl amine derivative, triazine and diazole (figure 13IIBc). But, Br is stronger coordinating with Fe2+ or Fe than OMe. This can explain the little increase in the inhibition efficiency of PTA-2 compared to PTA-3.
3.6. Inhibition mechanism
Corrosion inhibition of C-steel in sulfuric acid solution by different triazines can be due to adsorption. The triazines inhibit corrosion by blocking both anodic and cathodic sites. In weak acidic solution, the triazines exist as neutral or protonated species.
The neutral triazines are chemically adsorbed on steel while protonated triazines are physically adsorbed on the cathodic sites of the mild steel forming a protective film (figure 13IIA b,c). This leads to a decrease in the exposed surface area of C-steel with the acid solution and a decrease in the evolution of hydrogen, as shown in figure 13IIA [41].
The adsorption of triazines on anodic site occurs through π electrons of imines and aromatic rings and through lone pair of electrons of various heteronitrogen atoms, and additionally of bromine in PTA-2 and oxygen (from methoxy group) in PTA-3. This decreases the anodic dissolution of C-steel [76].
In conclusion, the high performance of s-triazines is attributed to the presence of π electrons, lone pair electrons from nitrogen atoms of s-triazine and diazole rings, and quaternary nitrogen atoms, nd large molecular size and the planarity of these compounds. Both planarity and larger molecular size of studied molecules ensure formation of larger protective film on mild steel. Also, electron donation by inductive effect from methyl groups and by resonance from bromine and methoxy groups increases electron density at triazines causing stronger adsorption/inhibition on the metal surface [42–44]. The order of inhibition efficiency is: PTA-2 ≈ PTA-3 > PTA-1.
3.7. Comparative studies of inhibition by different symmetrical s-triazines
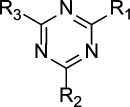
The anticorrosion application of s-triazine derivatives has been studied recently. We present, in table 8, the experimental results of inhibition by selected triazine: IE% inhibition from Tafel plot, maximum dose used, techniques used, molecular structure, adsorption type and isotherm for steel in 1 M HCl [40,42–44,72,77]. It is obvious from table 8 that the structural effect of triazine molecules, such as the functional groups, alkyl side chains, presence of heteroatoms, phenyl rings, π-bond conjugation, affects the overall corrosion inhibition efficiency.
Table 8.
s-Triazine-based corrosion inhibitors: structure, IE% from Tafel plot, maximum dose, adsorption type and isotherm for steel in 1 M HCl; while PTA-1, -2 and -3 in 0.25 M H2SO4.
s-triazine derivatives structures
|
metal/medium | concentration IE% | adsorption isotherm (type) | reference |
R1=R2=R3 =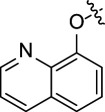


|
steel/1 M HCl | (250 ppm) | Langmuir (mixed) | [43] |
| 98.8% | ||||
| 85.1% | ||||
| 96.9% | ||||
R1=R2=R3 =
|
mild steel/1 M HCl | (312 ppm) 89.3% | Langmuir (mixed) | [40] |
| R1 =R3 = NH2NH–; R2 = 
R2 = 
|
steel/1 M HCl | (225 ppm) | Langmuir (mixed) | [42] |
| 98% | ||||
| 97% | ||||
| R1 = R3 = NH2–NH– ; R2 = CH3O– R1 = NH2–NH– ; R2 = R3 = CH3O– R1 = R2 = R3 = NH2–NH– |
steel/1 M HCl | (250 ppm) | Langmuir (mixed) | [44] |
| 98.0% | ||||
| 95.9% | ||||
| 97.7% | ||||
R1=R2=R3 =
n = 1 n = 2 n = 3 n = 4 n = 5 |
mild steel/1 M HCl | (5000 ppm) 71.8% | Langmuir (mixed) | [77] |
| (5000 ppm) 76.5% | ||||
| (5000 ppm) 81.7% | ||||
| (2000 ppm) 92.0% | ||||
| (500 ppm) 98.4% | ||||
R1=R2=R3 =
|
mild steel/1 M HCl | (5000 ppm) 35.4% | Langmuir (mixed) | [72] |
R1=R3=
R2 = 
X = H X = Br X = OCH3 |
C-steel/0.25 M H2SO4 | (175 ppm) 79.0% | Frumkin (mixed) | present work |
| (120 ppm) 96.5% | Langmuir (mixed) | |||
| (120 ppm) 93.4% | Langmuir (mixed) |
3.8. Density functional theory analysis
3.8.1. Geometry optimization
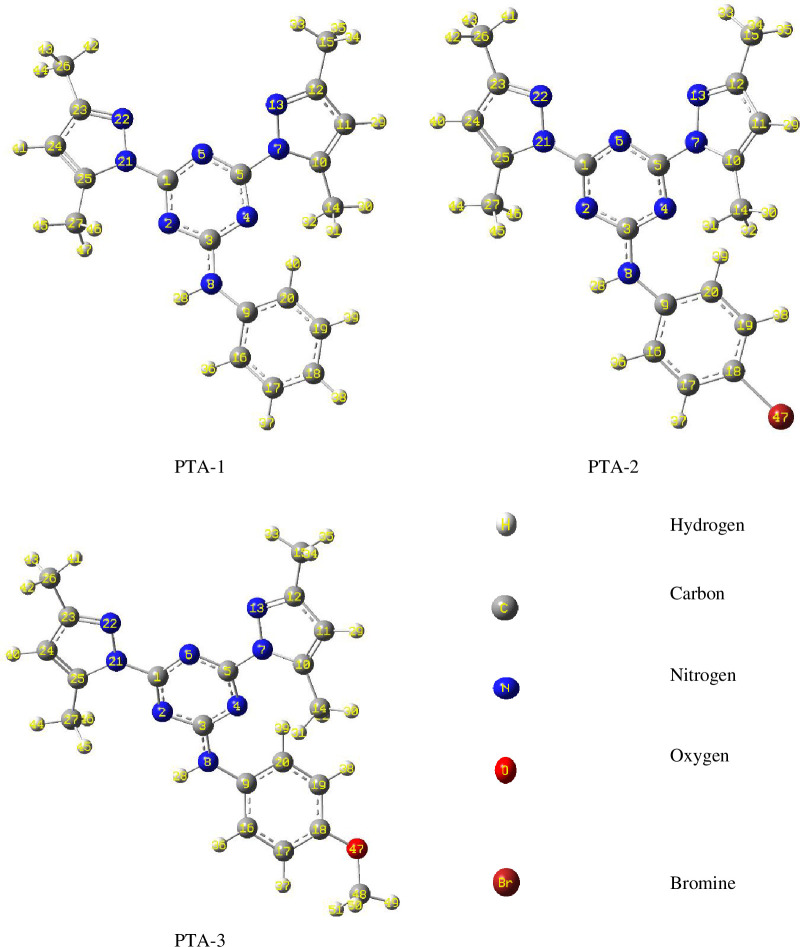
The optimized structures of the synthesized compounds are presented in figure 14. The molecule PTA-3 can possibly exist in two different isomers due to the presence of –OCH3 substituent, so both isomers were examined by DFT calculations to determine the most stable conformer. The studied compounds are structurally similar; however, presence of –Br and –OCH3 substituents on C-18 of PTA-2 and PTA-3, respectively, provide additional features for the comparative investigation.
Figure 14.
Optimized structures indicating numbering scheme for the atoms of the stable conformers, for the neutral form of synthesized organic heterocycles PTA-1, PTA-2 and PTA-3 (calculated at the B3LYP/6-311G++(d,p) level).
3.8.2. Frontier molecular orbitals and electrostatic potential map analysis
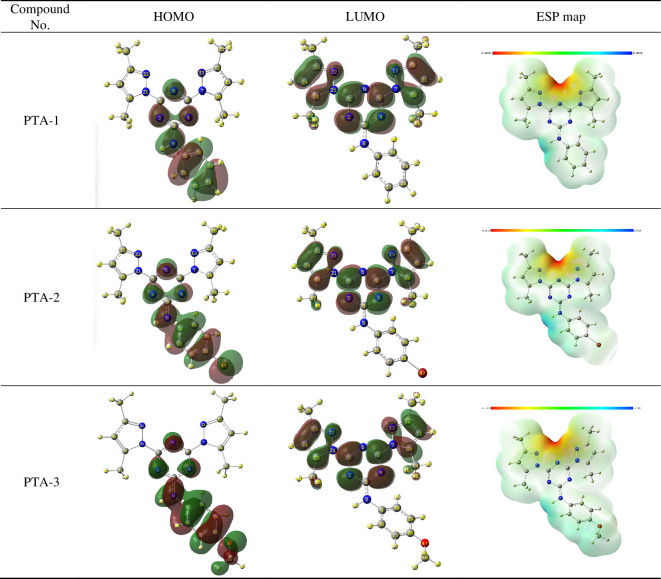
In order to gain a better insight into the chemical behaviour of organic molecules such as reactivity and stability, it is essential to analyse their frontier molecular orbitals (FMOs). These comprise HOMO and LUMO. The energy difference between these molecular orbitals is termed as energy gap or band gap, which is quite sensitive to the molecular substituents. The energy of HOMO (E HOMO) refers to the molecular tendency to donate electrons. Hence, high values of E HOMO reflect the molecule’s tendency to donate electrons to electrophilic moieties, in addition to its direct correlation with the ionization potential of a molecule. On the other hand, the low energy of LUMO (E LUMO) indicates the ability to gain electrons which enables one to detect electrophilic sites in a molecule and that is related to its electron affinity. As illustrated in figure 15, the frontier HOMO and LUMO orbital surfaces for the three molecules reported in this study are alike. For all the compounds, it is clearly evident that the electron density on HOMO is primarily localized on the phenylamine motif and extended to N atoms of the triazine structure. In the case of LUMO, the electron density is located on the pyrazole and triazine moieties of the molecules. Molecular electrostatic potential (ESP) maps of the three molecules are also highlighted in figure 15, which displays a three-dimensional distribution of the molecular electronic cloud. Electron-rich sites of the molecule are coloured in red which refers to the region with lowest ESP, and that appears on the triazine ring having the highest electronic density in all three compounds. While the electron-deficient sites show the highest ESP and are coloured in blue.
Figure 15.
Frontier molecular orbitals (HOMO and LUMO) and ESP maps of the stable conformers for the neutral form of compounds PTA-1, PTA-2 and PTA-3 by B3LYP/6-311G++(d,p) calculations. FMOs and ESP maps for the protonated form of compounds PTA-1, PTA-2 and PTA-3 by B3LYP/6-311G++(d,p) calculations are also provided in electronic supplementary material, figure S5.
3.8.3. E HOMO, E LUMO and ΔE
The energy values of FMOs were calculated for both neutral and protonated states of all three compounds in both gaseous and aqueous phases, which are presented in table 9. According to the observed values in both neutral and protonated states, the largest E HOMO and the lowest E LUMO values were obtained for the substituted compounds, PTA-3 and PTA-2, respectively. As a result, the energy gap (ΔE) followed a descending pattern from PTA-1 > PTA-2 > PTA-3 for both neutral and protonated forms of the compounds. In general, low value of ΔE and high value of E HOMO are linked with high corrosion inhibition efficiency. A low energy difference value results in a facile electron removal from the last occupied orbital for donation to the unoccupied d orbitals of the metal atom. Higher value of E HOMO is linked with the greater ability of a molecule to donate an electron to the metal surface which maximizes the interaction with the metal. This leads to a better adsorption and therefore enhances the corrosion inhibition efficiency. Based on the results tabulated in table 9, it is expected that there will be a better corrosion inhibition efficiency for both PTA-3 and PTA-2 compared with PTA-1 which is further confirmed by the experimental results.
Table 9.
E HOMO, E LUMO and ΔE (in eV) for the neutral and protonated forms of PTA-1, PTA-2 and PTA-3 calculated in the gaseous and aqueous (aq.) phases at the B3LYP/6-311G++(d,p) level of theory.
| compound | phase | neutral form | protonated form | ||||
|---|---|---|---|---|---|---|---|
| E HOMO | E LUMO | ΔE | E HOMO | E LUMO | ΔE | ||
| PTA-1 | gas | −6.373 | −1.604 | 4.769 | −9.685 | −5.292 | 4.393 |
| aq. | −6.443 | −1.78 | 4.663 | −7.058 | −2.559 | 4.499 | |
| PTA-2 | gas | −6.401 | −1.713 | 4.688 | −9.3 | −5.37 | 3.93 |
| aq. | −6.393 | −1.822 | 4.571 | −6.911 | −2.616 | 4.295 | |
| PTA-3 | gas | −6.015 | −1.49 | 4.525 | −8.805 | −5.181 | 3.625 |
| aq. | −6.077 | −1.731 | 4.347 | −6.469 | −2.502 | 3.967 | |
3.8.4. Quantum chemical parameters
The reactivity and stability of molecules are indicated by the global reactivity descriptors which can be computed using ionization potentials (I) and electron affinities (A). Ionization potential refers to the amount of energy needed to remove one electron from a molecule in the gaseous phase, while the addition of an electron to a neutral molecule is known as the electron affinity which is computed in the form of a released energy. Despite the generally adopted Koopmans’ theorem [78] which equates the ionization potential with the energy of HOMO and electron affinity with the LUMO energy, a more accurate approach is to consider vertical ionization potentials (I) and electron affinities (A) based on obtaining the excitation energetics, and these are calculated using equations (3.5) and (3.6), respectively [79]:
| (3.5) |
| (3.6) |
High value of ionization energy reflects chemical inertness and high stability while small ionization energy reflects high reactivity of the atoms and molecules. The values of I and A can be utilized to compute other chemical descriptors that rely on these quantities including electronegativity, electron chemical potential, global hardness and softness, electrophilicity index, electron back donation and fraction of electron transfer. Electronegativity (χ) measures the tendency of an atom to attract electrons and is described by the arithmetic mean of I and A. Accordingly, electrons tend to flow from molecules with low electronegativity towards species with high electronegativity and molecules with low χ are generally linked with greater inhibition efficiency. It is measured using the formula of equation (3.7):
| (3.7) |
Electronic chemical potential (µ) measures the escaping tendency of electron from equilibrium and a compound with high chemical potential is considered as a good electron donor, whereas a molecule having small chemical potential is generally a good electron acceptor. It is defined as the inverse of the electronegativity (χ).
Both global hardness (η) and global softness (S) are important quantum chemical descriptors which provide useful information about stability and reactivity of a molecule. The softness of a molecule refers to its high reactivity that highlights a facile electron transfer to an electron acceptor. It is the inverse of the hardness and reflects the presence of a small energy gap between the FMOs compared to the hard species. Therefore, hard substances are considered more stable and with less of a tendency to undergo any chemical changes. In addition, the chemical reactivity is directly proportional to the softness value and linked inversely with the hardness value. These parameters are calculated using equations (3.8) and (3.9):
| (3.8) |
| (3.9) |
The electrophilicity (ω*) indicates the ability of the inhibitor molecules to accept electrons. It reflects stabilization in energy after a molecule accepts an additional amount of electron charge from the environment. Higher value of electrophilicity means that the compound would be stabilized by a nucleophilic attack and vice versa. Also, high value of electrophilicity is a characteristic of a good electrophile while lower value of electrophilicity indicates a good and more reactive nucleophile. It is measured using equation (3.10) which is based on electronegativity and hardness:
| (3.10) |
Equations (3.11) and (3.12) are used to calculate the electron donor capacity (ω –) and electron acceptor capacity (ω +) which measure the tendency of a molecule to donate and accept charge, respectively.
| (3.11) |
| (3.12) |
Electron back donation (E B-d) is defined as the study of the interaction between the metallic surface and the corrosion inhibitor through charge transfer process. The energy change (ΔE B-d) of this process is directly proportional to the stability/hardness of the molecule which is measured as follows:
| (3.13) |
Low E B-d values indicate high molecular stability, which can lead to reduce the inhibition potency. Dipole moment (D) is also an important parameter that provides information regarding bond polarity and the distribution of the electronic cloud within a molecule. Large values of D signify unbalanced electronic distribution leading to substantial adsorption of the organic inhibitor on the metallic surface and, thus, enhance inhibition efficiency.
The number of transferred electrons (ΔN) from a species with lower electronegativity (inhibitor molecule) to another species with higher electronegativity (iron surface) is estimated using equation (3.14):
| (3.14) |
In equation (3.14), χ Fe and η Fe represent the theoretical electronegativity and hardness values of the iron surface, respectively, while χ mol and η mol denote the calculated values of electronegativity and hardness for the molecule being studied as corrosion inhibitor. The theoretical values for the iron surface are χ Fe = 7.0 eV mol−1 and η Fe = 0 eV mol−1 by assuming that for a metallic bulk I = A as it is softer than the neutral metallic atoms [80].
The quantum chemical descriptors calculated using equations (3.5)–(3.14) for PTA-1, PTA-2 and PTA-3 in gaseous and aqueous phases are tabulated in table 10. The calculated ionization potential (I) values in the aqueous phase are in the order of PTA-1 (6.32 eV) > PTA-2 (6.27 eV) > PTA-3 (5.98 eV). A similar trend is observed for the calculations carried out in the gaseous phase. As lower value of I is associated with high reactivity, PTA-3 is expected to exhibit higher corrosion inhibition efficiency compared to the other two inhibitor molecules. Similar trend is observed for electronegativity (χ), global hardness (η) and electrophilicity (ω*) where the values are following a descending order as PTA-1 > PTA-2 > PTA-3. Like the small value of I, small values of χ, η and ω* are also associated with higher inhibition efficiency which suggests the highest inhibition efficiency for PTA-3. As expected, the value of softness (S) is: PTA-3 > PTA-2 > PTA-1, as it is inverse of hardness. The highest values for the dipole moment (D) and electronic back donation were also found for the inhibitor PTA-3. One of the most important factors to measure the corrosion inhibition efficiency is the fraction of electron transfer (ΔN) and obtained values for this also agree with Lukovit’s study [80]. According to this, if ΔN < 3.6, the corrosion inhibition efficiency increases by increasing the electron-donating ability of corrosion inhibitors at the mild steel or electrolyte interface. All the calculated values of ΔN are below 3.6 and PTA-3 has the highest value of 0.44 and 0.75 in gaseous and aqueous phases, respectively, while PTA-1 has the lowest values of ΔN, 0.40 and 0.66, corresponding to calculations performed in gaseous and aqueous phases, respectively. This correlates strongly with the experimental inhibition efficiency results where PTA-1 was the least efficient corrosion inhibitor among the studied compounds while both PTA-2 and PTA-3 have shown better corrosion inhibition efficiency. A similar trend showing better corrosion inhibition efficiency by PTA-3 compared to PTA-2 and PTA-1 was observed when the calculations were performed for the protonated forms of these three compounds at the same level of theory.
Table 10.
The calculated chemical parameters for the neutral form of PTA-1, PTA-2 and PTA-3 calculated at the B3LYP/6-311G++(d,p) level in gaseous and aqueous (aq.) phases and protonated form of PTA-1, PTA-2 and PTA-3 in aqueous (aq.) phase by employing excitation energetics.
| chemical parameters | PTA-1 | PTA-2 | PTA-3 | ||||||
|---|---|---|---|---|---|---|---|---|---|
| gas | aq. | protonated* (aq.) | gas | aq. | protonated* (aq.) | gas | aq. | protonated* (aq.) | |
| electronic energy (neutral, hartrees) | −1174.389 | −1174.409 | −1174.856 | −3747.93 | −3747.952 | −3748.398 | −1288.944 | −1288.967 | −1289.415 |
| electronic energy (radical cation, hartrees) | −1174.105 | −1174.177 | −1174.601 | −3747.647 | −3747.721 | −3748.147 | −1288.671 | −1288.747 | −1289.180 |
| electronic energy (radical anion, hartrees) | −1174.399 | −1174.48 | −1174.956 | −3747.946 | −3748.024 | −3748.500 | −1288.951 | −1289.036 | −1289.512 |
| Ionization potential (I, eV) | 7.72 | 6.32 | 6.95 | 7.71 | 6.27 | 6.81 | 7.42 | 5.98 | 6.38 |
| electron affinity (A, eV) | 0.27 | 1.94 | 2.71 | 0.42 | 1.98 | 2.77 | 0.2 | 1.89 | 2.65 |
| electronegativity (χ, eV) | 3.99 | 4.13 | 4.83 | 4.07 | 4.12 | 4.79 | 3.81 | 3.93 | 4.52 |
| electronic chemical potential (µ, eV) | −3.99 | −4.13 | −4.83 | −4.07 | −4.12 | −4.79 | −3.81 | −3.93 | −4.52 |
| global hardness (η, eV) | 3.72 | 2.19 | 2.12 | 3.65 | 2.14 | 2.02 | 3.61 | 2.05 | 1.87 |
| global softness (S, eV) | 0.27 | 0.46 | 0.47 | 0.27 | 0.47 | 0.5 | 0.28 | 0.49 | 0.54 |
| electrophilicity (ω*, eV) | 29.69 | 18.68 | 24.67 | 30.15 | 18.24 | 23.12 | 26.24 | 15.85 | 19.04 |
| electron donor capacity (ω –, eV) | 4.61 | 6.22 | 8.18 | 4.75 | 6.3 | 8.33 | 4.37 | 6 | 7.96 |
| electron acceptor capacity (ω +, eV) | 0.61 | 2.1 | 3.36 | 0.69 | 2.17 | 3.54 | 0.56 | 2.07 | 3.44 |
| electronic back donation (ΔE B-d, eV) | −0.93 | −0.55 | −0.53 | −0.91 | −0.54 | −0.5 | −0.9 | −0.51 | −0.47 |
| dipole moment (D) | 3.961 | 6.615 | 1.615 | 2.892 | 5.242 | 8.918 | 5.786 | 8.921 | 3.364 |
| fraction of electron transfer (ΔN) | 0.4 | 0.66 | 0.51 | 0.4 | 0.67 | 0.55 | 0.44 | 0.75 | 0.67 |
At this juncture, quantum chemical parameters for all three compounds were calculated using widely reported Koopmans’ theorem [78] and compared with the values obtained by employing a more accurate method based on vertical ionization potentials (I) and electron affinities (A) as reported in table 10. According to Koopmans’ theorem, E HOMO and E LUMO are directly associated with ionization potentials (I) and electron affinities (A) according to equations (3.15) and (3.16)
| (3.15) |
| (3.16) |
The data obtained for the quantum chemical parameters by employing Koopmans’ theorem are presented in electronic supplementary material, figure S6. As expected, the values for the studied descriptors are different for both approaches; however, the obtained trends by both methods are in good agreement with each other. Overall, in both neutral and protonated forms, compound PTA-1 is the least efficient corrosion inhibitor as supported by the experimental results, while compound PTA-3 showed the highest tendency to be an efficient corrosion inhibitor.
3.8.5. Local selectivity by condensed Fukui function
Condensed Fukui function f is a well-recognized means to analyse local selectivity of an inhibitor molecule [81]. The values indicate the atoms in a molecule that are more susceptible to electrophilic or nucleophilic attacks. The preferred site for an attack by an electrophilic or nucleophilic agent will be at the atom where the value of or is maximum. The condensed Fukui functions are calculated using equations (3.17) and (3.18)
| (3.17) |
| (3.18) |
where is the charge at atomic centre k and , and are the electronic population of the atom k in the anionic, neutral and cationic species, respectively.
The difference between the nucleophilic and electrophilic Fukui functions is known as a dual descriptor [82]. It is given as follows:
| (3.19) |
The local softness (s) of an atom can be described as the product of the condensed Fukui function ( ) and the global softness (S), where high values of indicate high nucleophilicity, while high values of are indication of high electrophilicity.
| (3.20) |
| (3.21) |
Calculated values of Mulliken charges, condensed Fukui functions, dual descriptors and local softness indices for PTA-1, PTA-2 and PTA-3 are presented in electronic supplementary material, tables S5–S7 and figure S6, respectively. The numbering sequence for the atoms is highlighted in figure 14. It can be deduced that both N(7) and N(21) have the highest value for which means these are the most preferential reactive site for nucleophilic attack for all the compounds. For PTA-3, the values for N(7) and N(21) are equal, and for the compounds, the values for N(21) are similar to that of N(7) as well. This is expected as N(7) and N(21) are in the same environment. The most reactive electrophilic sites based on the obtained values of are C(14), C(3) and C(48) for PTA-1, PTA-2 and PTA-3, respectively. In addition, the energies and the Cartesian coordinates of the optimized structures are provided in electronic supplementary material, tables S8 and S9. Further computational investigation is underway to explore other pertinent features of the corrosion inhibitors and will be documented in due course.
3.9. Monte Carlo simulation
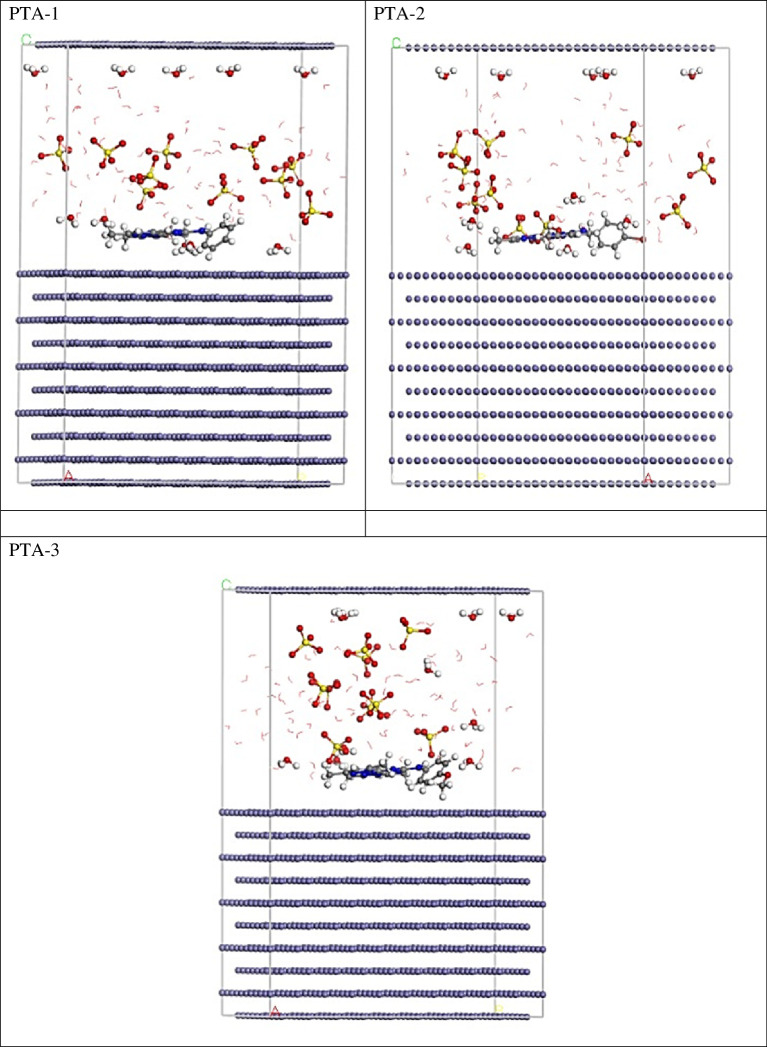
MC simulations were employed to investigate the interactions between the inhibitor molecules and the steel surface, aiming to elucidate the mechanism of the adsorption process. These simulations were specifically designed to analyse and understand the binding behaviour and overall interaction patterns between the inhibitor molecules and the steel surface. By using MC simulations, a clear understanding of the adsorption mechanism was obtained, providing valuable insights into how the inhibitor molecules interact with and bind to the steel surface. Fe(110) plane was used as a model for carbon steel surface in this work for MC simulations, since it is believed to be more stable energetically than the Fe(100) and Fe(111) surfaces [83]. Figure 16 illustrates the most favourable adsorption configurations for PTA-1, PTA-2 and PTA-3 molecules on the steel surface in a corrosive medium, as revealed by the adsorption locator module. The adsorption formations depicted in the figure exhibit a nearly flat arrangement, indicating an enhancement in adsorption efficiency and maximum surface coverage. This finding suggests that these adsorption configurations are highly suitable for achieving effective protection against corrosion on the steel surface [84]. Moreover, the calculated adsorption energies obtained from the MC simulations are documented in table 11. It was observed that PTA-2 and PTA-3 molecules exhibited higher negative adsorption energy values (−2112.34 and −2126.36 kcal mol−1, respectively) compared to the adsorption energy of PTA-1 molecule (−1765.78 kcal mol−1). This suggests that PTA-2 and PTA-3 molecules undergo energetically favourable adsorption on the steel interface, forming a stable adsorbed film that effectively protects the steel from corrosion. These findings align with the practical outcomes, further confirming the potential of PTA-2 and PTA-3 molecules as corrosion inhibitors for steel surfaces [85]. Furthermore, table 11 clearly indicates that the adsorption energy values for PTA-2 and PTA-3 molecules during the pre-geometry optimization step, i.e. before relaxation (−1686.23 and −1686.33 kcal mol−1, respectively), are even more negative than that of PTA-1 molecule (−1356.17 kcal mol−1). This signifies a higher level of protection effectiveness for PTA-2 and PTA-3 molecules compared to PTA-1 molecule. The more negative adsorption energy values for PTA-2 and PTA-3 indicate stronger binding to the steel surface, highlighting their superior potential as corrosion inhibitors.
Figure 16.
The highest proper adsorption arrangement for the PTA-1, PTA-2 and PTA-3 molecules on Fe(110) substrate achieved by adsorption locator module.
Table 11.
Data and descriptors computed by the MC simulations for the adsorption of PTA-1, PTA-2 and PTA-3 molecules on Fe(110).
| structures | adsorption energy (kcal mol−1) |
rigid adsorption energy (kcal mol−1) | deformation energy | inhibitor: dE ads/dN i | SO4 2−: dE ads/dN i | hydronium: dE ads/dN i | water: dE ads/dN i |
|---|---|---|---|---|---|---|---|
| PTA-1 | −1765.78 | −1356.17 | −409.61 | −428.73 | −121.33 | −82.73 | −17.24 |
| PTA-2 | −2112.34 | −1686.23 | −426.11 | −439.73 | −122.11 | −81.91 | −17.47 |
| PTA-3 | −2126.36 | −1686.33 | −440.03 | −436.62 | −122.02 | −81.98 | −17.42 |
The values of dE ads/dN i provide insights into the energy associated with the arrangement of metal and adsorbates (inhibitor molecules), excluding adsorbed water [86]. As shown in table 11, the dE ads/dN i values for both forms of PTA-2 and PTA-3 molecules (−439.73 and −436.62 kcal mol−1, respectively) are higher than that of PTA-1 molecule (−428.73 kcal mol−1). This indicates a stronger adsorption of PTA-2 and PTA-3 molecules compared to PTA-1 molecule. Additionally, the dE ads/dN i values for water molecules, sulfate ions and hydronium ions are lower than those of PTA-1, PTA-2 and PTA-3 molecules, suggesting that the inhibitor molecules exhibit robust adsorption compared to water molecules, sulfate ions and hydronium ions. This enhanced adsorption capability of the inhibitor molecules facilitates the displacement of water molecules, hydronium ions and sulfate ions, leading to the formation of a protective adsorbed layer on the steel surface. Consequently, PTA-1, PTA-2 and PTA-3 molecules effectively adsorb onto the steel surface, forming a robust protective layer that inhibits corrosion in aggressive solutions. This conclusion is supported by both empirical and theoretical investigations.
4. Conclusion
Three bis(dimethylpyrazolyl)-aniline-s-triazine derivatives were prepared in high yield and characterized to investigate their anticorrosion properties for C-steel.
As the inhibitor concentration increased, the polarization resistance R p (R f + R ct) increased, the C dl value decreased and the thickness of double layer increased, leading to increase in IE%.
Potentiodynamic polarization studies indicate a sharp decrease in corrosion current and corrosion rate with increase in concentration. The inhibition efficiency of the synthesized inhibitors followed the order PTA-2 (96.5% at 120 ppm) ≈ PTA-3 (93.4% at 120 ppm) > PTA-1 (79.0% at 175 ppm).
The presence of electron-rich group significantly increased the inhibition efficiency of PTA-2 (−Br) and PTA-3 (−OCH3) compared to PTA-1 with no functional group.
Comparative studies indicated that both triazine moiety and diazole groups contribute to corrosion inhibition.
The s-triazines PTA-2 and PTA-3 obey the Langmuir adsorption isotherm, while PTA-1 obeys the Frumkin model. All the triazines were found to act as mixed-type corrosion inhibitors that reduce iron oxidative dissolution and hinder hydrogen emission reaction.
The values of adsorption equilibrium constant K° ads and free energy change ΔG° ads revealed that the adsorption of inhibitor onto steel surface was favoured. A corrosion inhibition mechanism proposed the presence of physical and chemical interactions between the s-triazine inhibitors and C-steel.
A detailed computational study has provided an insight about the structural features of the molecules and calculation of quantum chemical descriptors such as ionization energy, electron affinity, electronegativity, electronic potential, global softness, global hardness and fraction of electron transfer enabled corroboration of the experimental results.
The values of the energy associated with the metal/adsorbate arrangement dE ads/dN i were calculated by MC simulations. They were almost equal for inhibitor PTA-2 and PTA-3 with electron donor groups –Br and –OMe, but higher than that of inhibitor PTA-1. This is in analogy with the obtained experimental anticorrosion results obtained for the inhibitors.
Acknowledgements
The authors would like to extend their sincere appreciation to the Researchers Supporting Project (RSP2023R64), King Saud University, and Prince Sultan University, Riyadh, Saudi Arabia, for their support.
Contributor Information
Hassan H. Hammud, Email: hhammoud@kfu.edu.sa.
Nadeem S. Sheikh, Email: nadeem.sheikh@ubd.edu.bn.
Ihab Shawish, Email: ishawish@psu.edu.sa.
Hawra A. Bukhamsin, Email: 217009709@student.kfu.edu.sa.
Dolayl E. Al-Hudairi, Email: 217010359@student.kfu.edu.sa.
Angelina L. X. Wee, Email: 19b2174@ubd.edu.bn.
Malai Haniti S. A. Hamid, Email: haniti.hamid@ubd.edu.bn.
Sarah A. Maache, Email: sarrah19921@gmail.com.
Hessa H. Al-Rasheed, Email: Halbahli@ksu.edu.sa.
Assem Barakat, Email: ambarakat@ksu.edu.sa.
Ayman El-Faham, Email: ayman.elfaham@alexu.edu.eg.
Hany M. Abd El-Lateef, Email: hmahmed@kfu.edu.sa.
Ethics
This work did not require ethical approval from a human subject or animal welfare committee.
Data accessibility
All data are available in the main text or the electronic supplementary material [87]. Samples of novel synthesized compounds are available from the authors.
Declaration of AI use
We have not used AI-assisted technologies in creating this article.
Authors’ contributions
H.H.H.: conceptualization, funding acquisition, project administration, resources, supervision, writing—original draft, writing—review and editing; N.S.S.: conceptualization, resources, software, supervision, writing—original draft, writing—review and editing; I.S.: formal analysis; H.A.B.: formal analysis; D.E.A.-H.: formal analysis; A.L.X.W.: formal analysis; M.H.S.A.H.: supervision; S.A.M.: formal analysis; H.H.A.-R.: supervision; A.B.: supervision; A.E.-F.: supervision, writing–review and editing; H.M.A.E.-L.: formal analysis, software, writing—original draft, writing—review and editing.
All authors gave final approval for publication and agreed to be held accountable for the work performed therein.
Conflict of interests declaration
We declare we have no competing interests.
Funding
This work was supported by the Deanship of Scientific Research, Vice Presidency for Graduate Studies and Scientific Research, King Faisal University, Saudi Arabia (grant no. 3273). Both M.H.S.A.H. and N.S.S. thank the Universiti Brunei Darussalam for a research grant (UBD/RSCH/1.4/FICBF(b)/2022/049).
References
- 1. Prasad AR, Kunyankandy A, Joseph A. 2020. Corrosion inhibitors in the oil and gas industry: economic considerations. In Corrosion inhibitors in the oil and gas industry, pp. 135–150. Weinheim, Germany: Wiley. ( 10.1002/9783527822140.ch5) [DOI] [Google Scholar]
- 2. Vogt JB, Proriol Serre I. 2021. A review of the surface modifications for corrosion mitigation of steels in lead and LBE. Coatings 11 , 53. ( 10.3390/coatings11010053) [DOI] [Google Scholar]
- 3. Wang FP, Liu TJ, Cai S, Gao D, Yu Q, Wang XM, Wang YT, Zeng YN, Li JG. A review of modified steel slag application in catalytic pyrolysis, organic degradation, electrocatalysis, photocatalysis, transesterification and carbon capture and storage. Appl. Sci. 11 , 4539. ( 10.3390/app11104539) [DOI] [Google Scholar]
- 4. Akpoborie J, Fayomi OSI, Inegbenebor AO, Ayoola AA, Dunlami O, Samuel OD, Agboola O. 2021. Electrochemical reaction of corrosion and its negative economic impact. IOP Conf. Ser. Mater. Sci. Eng. 1107 , 012071. ( 10.1088/1757-899X/1107/1/012071) [DOI] [Google Scholar]
- 5. Fayomi OSI, Akande IG, Odigie S. 2019. Economic impact of corrosion in oil sectors and prevention: an overview. J. Phys.Conf. Ser. 1378 , 022037. ( 10.1088/1742-6596/1378/2/022037) [DOI] [Google Scholar]
- 6. Javaherdashti R. 2000. How corrosion affects industry and life. Anti-Corrosion Methods Mater. 47 , 30–34. ( 10.1108/00035590010310003) [DOI] [Google Scholar]
- 7. Velázquez JC, Hernández-Sánchez E, Terán G, Capula-Colindres S, Diaz-Cruz M, Cervantes-Tobón A. 2022. Probabilistic and statistical techniques to study the impact of localized corrosion defects in oil and gas pipelines: a review. Metals (Basel) 12 , 576. ( 10.3390/met12040576) [DOI] [Google Scholar]
- 8. Angst UM. 2018. Challenges and opportunities in corrosion of steel in concrete. Mater. Struct. Constr. 51 , 1–20. ( 10.1617/s11527-017-1131-6) [DOI] [Google Scholar]
- 9. Li CQ, Yang W, Shi W. 2020. Corrosion effect of ferrous metals on degradation and remaining service life of infrastructure using pipe fracture as example. Struct. Infrastruct. Eng 16 , 583–598. ( 10.1080/15732479.2019.1663221) [DOI] [Google Scholar]
- 10. Birbilis N, Choudhary S, Scully JR, Taheri ML. 2021. A perspective on corrosion of multi-principal element alloys. Npj Mater. Degrad. 5 , 1–8. ( 10.1038/s41529-021-00163-8) [DOI] [Google Scholar]
- 11. Wasim M, Djukic MB. 2021. Corrosion induced failure of the ductile iron pipes at micro- and nano-levels. Eng. Fail. Anal. 121 , 105169. ( 10.1016/j.engfailanal.2020.105169) [DOI] [Google Scholar]
- 12. Hossain N, Asaduzzaman Chowdhury M, Kchaou M. 2021. An overview of green corrosion inhibitors for sustainable and environment friendly industrial development. J. Adhes. Sci. Technol. 35 , 673–690. ( 10.1080/01694243.2020.1816793) [DOI] [Google Scholar]
- 13. Zehra S, Mobin M, Aslam R. 2022. Corrosion prevention and protection methods. In Eco-friendly corrosion inhibitor, pp. 13–26. Amsterdam, The Netherlands: Elsevier. ( 10.1016/B978-0-323-91176-4.00023-4) [DOI] [Google Scholar]
- 14. Hu JY, Zhang SS, Chen E, Li WG. 2022. A review on corrosion detection and protection of existing reinforced concrete (RC) structures. Constr. Build. Mater. 325 , 126718. ( 10.1016/j.conbuildmat.2022.126718) [DOI] [Google Scholar]
- 15. Cheng X, Xia J, Wu R, Jin W, Pan C. 2022. Optimisation of sacrificial anode cathodic protection system in chloride-contaminated reinforced concrete structure. J. Build. Eng. 45 , 103515. ( 10.1016/j.jobe.2021.103515) [DOI] [Google Scholar]
- 16. Silva Campos MDR, Blawert C, Scharnagl N, Störmer M, Zheludkevich ML. 2022. Cathodic protection of mild steel using aluminium-based alloys. Materials (Basel) 15 , 1301. ( 10.3390/ma15041301) [DOI] [PMC free article] [PubMed] [Google Scholar]
- 17. Momoh A, Adams FV, Samuel O, Bolade OP, Olubambi PA. 2022. Corrosion prevention: the use of nanomaterials. In Modified nanomaterials for environmental applications, pp. 91–105. Cham, Switzerland: Springer. ( 10.1007/978-3-030-85555-0_5) [DOI] [Google Scholar]
- 18. Abdel-Karim AM, El-Shamy AM. 2022. A review on green corrosion inhibitors for protection of archeological metal artifacts. J. Bio. Tribo. Corros. 8 , 35. ( 10.1007/s40735-022-00636-6) [DOI] [Google Scholar]
- 19. Ji X, Wang W, Zhao X, Wang L, Ma F, Wang Y, Duan J, Hou B. 2022. Poly(dimethyl siloxane) anti-corrosion coating with wide pH-responsive and self-healing performance based on core−shell nanofiber containers. J. Mater. Sci. Technol. 101 , 128–145. ( 10.1016/j.jmst.2021.06.014) [DOI] [Google Scholar]
- 20. Honarvar Nazari M, Zhang Y, Mahmoodi A, Xu G, Yu J, Wu J, Shi X. 2022. Nanocomposite organic coatings for corrosion protection of metals: a review of recent advances. Prog. Org. Coatings 162 , 106573. ( 10.1016/j.porgcoat.2021.106573) [DOI] [Google Scholar]
- 21. Veedu KK, Mohan S, Somappa SB, Gopalan NK. 2022. Eco-friendly anticorrosive epoxy coating from Ixora leaf extract: a promising solution for steel protection in marine environment. J. Clean. Prod. 340 , 130750. ( 10.1016/j.jclepro.2022.130750) [DOI] [Google Scholar]
- 22. Jena G, Philip J. 2022. A review on recent advances in graphene oxide-based composite coatings for anticorrosion applications. Prog. Org. Coatings 173 , 107208. ( 10.1016/j.porgcoat.2022.107208) [DOI] [Google Scholar]
- 23. Hammud HH, Maache SA, Al Otaibi N, Sheikh NS. 2022. An integrated experimental and theoretical studies on the corrosion inhibition of carbon steel by harmal extracts. Molecules 27 , 7250. ( 10.3390/molecules27217250) [DOI] [PMC free article] [PubMed] [Google Scholar]
- 24. Puthran D, Patil D. 2022. Usage of heavy metal-free compounds in surface coatings. J. Coat. Technol. Res. 20 , 87–112. ( 10.1007/s11998-022-00648-4) [DOI] [Google Scholar]
- 25. Prasad S, Yadav KK, Kumar S, Gupta N, Cabral-Pinto MMS, Rezania S, Radwan N, Alam J. 2021. Chromium contamination and effect on environmental health and its remediation: a sustainable approaches. J. Environ. Manage. 285 , 112174. ( 10.1016/j.jenvman.2021.112174) [DOI] [PubMed] [Google Scholar]
- 26. Zhang J, Cui S, Shen L, Gao Y, Liu W, Zhang C, Zhuang S. 2022. Promotion of bladder cancer cell metastasis by 2-mercaptobenzothiazole via its activation of aryl hydrocarbon receptor transcription: molecular dynamics simulations, cell-based assays, and machine learning-driven prediction. Environ. Sci. Technol. 56 , 13254–13263. ( 10.1021/acs.est.2c05178) [DOI] [PubMed] [Google Scholar]
- 27. Belghiti ME, et al. 2022. Performance of triazole derivatives as potential corrosion inhibitors for mild steel in a strong phosphoric acid medium: combining experimental and computational (DFT, MDs & QSAR) approaches. J. Mol.Struct. 1256 , 132515. ( 10.1016/j.molstruc.2022.132515) [DOI] [Google Scholar]
- 28. Qiang Y, Zhi H, Guo L, Fu A, Xiang T, Jin Y. 2022. Experimental and molecular modeling studies of multi-active tetrazole derivative bearing sulfur linker for protecting steel from corrosion. J. Mol. Liq. 351 , 118638. ( 10.1016/j.molliq.2022.118638) [DOI] [Google Scholar]
- 29. Mehta RK, Gupta SK, Yadav M. 2022. Studies on pyrimidine derivative as green corrosion inhibitor in acidic environment: electrochemical and computational approach. J. Environ. Chem. Eng. 10 , 108499. ( 10.1016/j.jece.2022.108499) [DOI] [Google Scholar]
- 30. Verma C, Quraishi MA, Ebenso EE. 2020. Quinoline and its derivatives as corrosion inhibitors: a review. Surf. Interfaces 21 , 100634. ( 10.1016/j.surfin.2020.100634) [DOI] [Google Scholar]
- 31. Ouakki M, Galai M, Cherkaoui M. 2022. Imidazole derivatives as efficient and potential class of corrosion inhibitors for metals and alloys in aqueous electrolytes: a review. J. Mol. Liq. 345 , 117815. ( 10.1016/j.molliq.2021.117815) [DOI] [Google Scholar]
- 32. Chauhan DS, Quraishi MA, Nik WBW, Srivastava V. 2021. Triazines as a potential class of corrosion inhibitors: present scenario, challenges and future perspectives. J. Mol. Liq. 321 , 114747. ( 10.1016/j.molliq.2020.114747) [DOI] [Google Scholar]
- 33. Elqars E, et al. 2022. New 3-(2-methoxyphenyl)-isoxazole-carvone: synthesis, spectroscopic characterization, and prevention of carbon steel corrosion in hydrochloric acid. J. Mol. Liq. 347 , 118311. ( 10.1016/j.molliq.2021.118311) [DOI] [Google Scholar]
- 34. Cherrak K, et al. 2022. Performance evaluation of newly synthetized bi-pyrazole derivatives as corrosion inhibitors for mild steel in acid environment. J. Mol. Struct. 1261 , 132925. ( 10.1016/j.molstruc.2022.132925) [DOI] [Google Scholar]
- 35. Abd El-Lateef HM, Khalaf MM, Shalabi K, Abdelhamid AA. 2022. Efficient synthesis of 6,7-dihydro-5H-cyclopenta[b]pyridine-3-carbonitrile compounds and their applicability as inhibitor films for steel alloy corrosion: collective computational and practical approaches. ACS Omega 7 , 24727–24745. ( 10.1021/acsomega.2c02639) [DOI] [PMC free article] [PubMed] [Google Scholar]
- 36. Dewangan AK, Dewangan Y, Verma DK. 2021. Pyrazine derivatives as green corrosion inhibitors. In Theory and applications of green corrosion inhibitors, pp. 161–182. Millersville, PA: Materials Research Foundation. ( 10.21741/9781644901052) [DOI] [Google Scholar]
- 37. Quadri TW, et al. 2022. Development of QSAR-based (MLR/ANN) predictive models for effective design of pyridazine corrosion inhibitors. Mater. Today Commun. 30 , 103163. ( 10.1016/j.mtcomm.2022.103163) [DOI] [Google Scholar]
- 38. Taylor SR. 2012. The role of intrinsic defects in the protective behavior of organic coatings. In Handbook of environmental degradation of materials (ed. Myer K), pp. 655–672. Amsterdam, The Netherlands: Elsevier. ( 10.1016/B978-1-4377-3455-3.00022-5) [DOI] [Google Scholar]
- 39. Obot IB, Macdonald DD, Gasem ZM. 2015. Density functional theory (DFT) as a powerful tool for designing new organic corrosion inhibitors. Part 1: an overview. Corros. Sci. 99 , 1–30. ( 10.1016/j.corsci.2015.01.037) [DOI] [Google Scholar]
- 40. Xuehui P, Baorong H, Weihua L, Faqian L, Zhigang Y. 2007. 2,3,5-Triphenyl-2H-tetrazolium chloride and 2,4,6-tri(2-pyridyl)-s-triazine on the corrosion of mild steel in HCI. Chin. J. Chem. Eng. 15 , 909–915. ( 10.1016/S1004-9541(08)60024-5) [DOI] [Google Scholar]
- 41. Shukla SK, Singh AK, Quraishi MA. 2012. Triazines: efficient corrosion inhibitors for mild steel in hydrochloric acid solution. Int. J. Electrochem. Sci. 7 , 3371–3389. ( 10.1016/S1452-3981(23)13962-9) [DOI] [Google Scholar]
- 42. El-Mahdy GA, Al-Rasheed HH, Al Alshaikh M, Al-Lohedan HA, El-Faham A. 2016. 2,4-Dihydrazino-6-morpholino-1,3,5-triaizne (DHMT) and 2,4-dihydrazino-6-piperidino-1,3,5-triaizne (DHPT) as promising corrosion inhibitors of steel in acidic media. Int. J. Electrochem. Sci. 11 , 5459–5472. ( 10.20964/2016.07.08) [DOI] [Google Scholar]
- 43. El-Faham A, Dahlous KA, Al Othman ZA, Al-Lohedan HA, El-Mahdy GA. 2016. sym-trisubstituted 1,3,5-triazine derivatives as promising organic corrosion inhibitors for steel in acidic solution. Molecules 21 , 436–447. ( 10.3390/molecules21040436) [DOI] [PMC free article] [PubMed] [Google Scholar]
- 44. El-Faham A, Osman SM, Al-Lohedan HA, El-Mahdy GA. 2016. Hydrazino-methoxy-1,3,5-triazine derivatives’ excellent corrosion organic inhibitors of steel in acidic chloride solution. Molecules 21 , 714–727. ( 10.3390/molecules21060714) [DOI] [PMC free article] [PubMed] [Google Scholar]
- 45. Shawish I, et al. 2022. Synthesis and antiproliferative activity of a new series of mono- and bis(dimethylpyrazolyl)-s-triazine derivatives targeting EGFR/PI3K/AKT/mTOR signaling cascades. ACS Omega 7 , 24858–24870. ( 10.1021/acsomega.2c03079) [DOI] [PMC free article] [PubMed] [Google Scholar]
- 46. Iroha NB, Anadebe VC, Maduelosi NJ, Nnanna LA, Isaiah LC, Dagdag O, Berisha A, Ebenso EE. 2023. Linagliptin drug molecule as corrosion inhibitor for mild steel in 1 M HCl solution: electrochemical, SEM/XPS, DFT and MC/MD simulation approach. Colloids Surf. A 660 , 130885. ( 10.1016/j.colsurfa.2022.130885) [DOI] [Google Scholar]
- 47. Fakhry H, et al. 2022. Experimental, DFT studies and molecular dynamic simulation on the corrosion inhibition of carbon steel in 1 M HCl by two newly synthesized 8-hydroxyquinoline derivatives. J. Indian Chem. Soc. 99 , 100701. ( 10.1016/j.jics.2022.100701) [DOI] [Google Scholar]
- 48. Ravi S, Peters S, Varathan E, Ravi M, Selvi JA. 2023. Molecular interaction and corrosion inhibition of benzophenone and its derivative on mild steel in 1 N HCl: electrochemical, DFT and MD simulation studies. Colloids Surf. A 661 , 130919. ( 10.1016/j.colsurfa.2023.130919) [DOI] [Google Scholar]
- 49. El-Mokadem TH, Hashem AI, Abd El-Sattar NEA, Dawood EA, Abdelshafi NS. 2023. Green synthesis, electrochemical, DFT studies and MD simulation of novel synthesized thiourea derivatives on carbon steel corrosion inhibition in 1.0 M HCl. J. Mol. Struct. 1274 , 134567. ( 10.1016/j.molstruc.2022.134567) [DOI] [Google Scholar]
- 50. Abdelshafi NS, Sadik MA, Shoeib MA, Halim SA. 2022. Corrosion inhibition of aluminum in 1 M HCl by novel pyrimidine derivatives, EFM measurements, DFT calculations and MD simulation. Arab. J. Chem. 15 , 103459. ( 10.1016/j.arabjc.2021.103459) [DOI] [Google Scholar]
- 51. Bhardwaj N, Sharma P, Berisha A, Mehmeti V, Dagdag O, Kumar V. 2022. Monte Carlo simulation, molecular dynamic simulation, quantum chemical calculation and anti-corrosive behaviour of Citrus limetta pulp waste extract for stainless steel (SS-410) in acidic medium. Mater. Chem. Phys. 284 , 126052. ( 10.1016/j.matchemphys.2022.126052) [DOI] [Google Scholar]
- 52. Bhardwaj N, Sharma P, Guo L, Dagdag O, Kumar V. 2022. Molecular dynamic simulation, quantum chemical calculation and electrochemical behaviour of Punica granatum peel extract as eco-friendly corrosion inhibitor for stainless steel (SS-410) in acidic medium. J. Mol. Liq. 346 , 118237. ( 10.1016/j.molliq.2021.118237) [DOI] [Google Scholar]
- 53. Parr RG, Yang W. 1989. Density-functional theory of atoms and molecules. Oxford, UK: Oxford University Press. [Google Scholar]
- 54. Frisch MJ, et al. 2019. Gaussian 16, revision C.01. Wallingford, CT: Gaussian Inc. [Google Scholar]
- 55. Denningtom J, Keith R, Millam T. 2009. GaussView, version 5. Shawnee Mission, KS: Semichem Inc. [Google Scholar]
- 56. Becke AD. 1993. A new mixing of Hartree–Fock and local density-functional theories. J. Chem. Phys. 98 , 1372–1377. ( 10.1063/1.464304) [DOI] [Google Scholar]
- 57. Becke AD. 1993. Density-functional thermochemistry. III. The role of exact exchange. J. Chem. Phys. 98 , 5648–5652. ( 10.1063/1.464913) [DOI] [Google Scholar]
- 58. Lee C, Yang W, Parr RG. 1988. Development of the Colle-Salvetti correlation-energy formula into a functional of the electron density. Phys. Rev. B 37 , 785–789. ( 10.1103/physrevb.37.785) [DOI] [PubMed] [Google Scholar]
- 59. Obot IB, Obi-Egbedi NO. 2010. Theoretical study of benzimidazole and its derivatives and their potential activity as corrosion inhibitors. Corros. Sci. 52 , 657–660. ( 10.1016/j.corsci.2009.10.017) [DOI] [Google Scholar]
- 60. Sastri VS, Elboujdaini M, Perumareddi JR. 2005. Utility of quantum chemical parameters in the rationalization of corrosion inhibition efficiency of some organic inhibitors. Corrosion 61 , 933–942. ( 10.5006/1.3280893) [DOI] [Google Scholar]
- 61. Tomasi J, Mennucci B, Cammi R. 2005. Quantum mechanical continuum solvation models. Chem. Rev. 105 , 2999–3094. ( 10.1021/cr9904009) [DOI] [PubMed] [Google Scholar]
- 62. Mennucci B, Cancès E, Tomasi J. 1997. Evaluation of solvent effects in isotropic and anisotropic dielectrics and in ionic solutions with a unified integral equation method: theoretical bases, computational implementation, and numerical applications. J. Phys. Chem. B 101 , 10506–10517. ( 10.1021/jp971959k) [DOI] [Google Scholar]
- 63. Dehghani A, Mostafatabar AH, Bahlakeh G, Ramezanzadeh B. 2020. A detailed study on the synergistic corrosion inhibition impact of the quercetin molecules and trivalent europium salt on mild steel; electrochemical/surface studies, DFT modeling, and MC/MD computer simulation. J. Mol. Liq. 316 , 113914. ( 10.1016/j.molliq.2020.113914) [DOI] [Google Scholar]
- 64. Feng Y, Chen S, Guo W, Zhang Y, Liu G. 2007. Inhibition of iron corrosion by 5,10,15,20-tetraphenylporphyrin and 5,10,15,20-tetra-(4-chlorophenyl)porphyrin adlayers in 0.5 M H2SO4 solutions. J. Electroanal. Chem. 602 , 115–122. ( 10.1016/j.jelechem.2006.12.016) [DOI] [Google Scholar]
- 65. Abd El-Lateef HM, Shalabi K, Tantawy AH. 2020. Corrosion inhibition and adsorption features of novel bioactive cationic surfactants bearing benzenesulphonamide on C1018-steel under sweet conditions: combined modeling and experimental approaches. J. Mol. Liq. 320 , 114564. ( 10.1016/j.molliq.2020.114564) [DOI] [Google Scholar]
- 66. Shawish I, Soliman SM, Haukka M, Dalbahi A, Barakat A, El-Faham A. 2021. Synthesis, and molecular structure investigations of a new s-triazine derivatives incorporating pyrazole/piperidine/aniline moieties. Crystals 11 , 1500. ( 10.3390/cryst11121500) [DOI] [Google Scholar]
- 67. Zohdy KM, El-Shamy AM, Kalmouch A, Gad EAM. 2019. The corrosion inhibition of (2Z,2′Z)-4,4′-(1,2-phenylene bis(azanediyl))bis(4-oxobut-2-enoic acid) for carbon steel in acidic media using DFT. Egypt. J. Petrol. 28 , 355–359. ( 10.1016/j.ejpe.2019.07.001) [DOI] [Google Scholar]
- 68. Lei X, Wang H, Feng Y, Zhang J, Sun X, Lai S, Wang Z, Kang S. 2015. Synthesis, evaluation and thermodynamics of a 1H-benzo-imidazole phenanthroline derivative as a novel inhibitor for mild steel against acidic corrosion. RSC Adv. 5 , 99084–99094. ( 10.1039/C5RA15002G) [DOI] [Google Scholar]
- 69. Al Otaibi N, Hammud HH. 2021. Corrosion inhibition using Harmal Leaf extract as an eco-friendly corrosion inhibitor. Molecules 26 , 7024. ( 10.3390/molecules26227024) [DOI] [PMC free article] [PubMed] [Google Scholar]
- 70. Burduhos-Nergis DP, Vizureanu P, Sandu AV, Bejinariu C. 2020. Evaluation of the corrosion resistance of phosphate coatings deposited on the surface of the carbon steel used for carabiners manufacturing. Appl. Sci. 10 , 2753. ( 10.3390/app10082753) [DOI] [PMC free article] [PubMed] [Google Scholar]
- 71. Brug GJ, van den Eeden ALG, Sluyters-Rehbach M, Sluyters JH. 1984. The analysis of electrode impedances complicated by the presence of a constant phase element. J. Electroanal. Chem. 176 , 275–295. ( 10.1016/S0022-0728(84)80324-1) [DOI] [Google Scholar]
- 72. Yoo SH, Kim YW, Chung K, Kim NK, Kim JS. 2013. Corrosion inhibition properties of triazine derivatives containing carboxylic acid and amine groups in 1.0 M HCl solution. Ind. Eng. Chem. Res. 52 , 10880–10889. ( 10.1021/ie303092j) [DOI] [Google Scholar]
- 73. Qiang Y, Li H, Lan X. 2020. Self-assembling anchored film basing on two tetrazole derivatives for application to protect copper in sulfuric acid environment. J. Mater. Sci. Technol. 52 , 63–71. ( 10.1016/j.jmst.2020.04.005) [DOI] [Google Scholar]
- 74. Hussin MH, Kassim MJ. 2011. The corrosion inhibition and adsorption behavior of Uncaria gambir extract on mild steel in 1M HCl. Mater. Chem. Phys. 125 , 461–468. ( 10.1016/j.matchemphys.2010.10.032) [DOI] [Google Scholar]
- 75. Shahini MH, Ramezanzadeh M, Bahlakeh G, Ramezanzadeh B. 2021. Superior inhibition action of the Mish Gush (MG) leaves extract toward mild steel corrosion in HCl solution: theoretical and electrochemical studies. J. Mol. Liq. 332 , 115876. ( 10.1016/j.molliq.2021.115876) [DOI] [Google Scholar]
- 76. Goulart CM, Esteves-Souza A, Martinez-Huitle CA, Rodrigues CJF, Maciel MAM, Echevarria A. 2013. Experimental and theoretical evaluation of semicarbazones and thiosemicarbazones as organic corrosion inhibitors. Corros. Sci. 67 , 281–291. ( 10.1016/j.corsci.2012.10.029) [DOI] [Google Scholar]
- 77. Yoo SH, Kim YW, Shin J, Kim NK, Kim JS. 2015. Effects of the chain length of tris(carboxyalkylamino)triazine on corrosion inhibition properties. Bull. Korean Chem. Soc. 36 , 346–355. ( 10.1002/bkcs.10090) [DOI] [Google Scholar]
- 78. Koopmans T. 1934. Über die zuordnung von wellenfunktionen und eigenwerten zu den einzelnen elektronen eines atoms. Physica 1 , 104–113. ( 10.1016/S0031-8914(34)90011-2) [DOI] [Google Scholar]
- 79. Ser CT, Žuvela P, Wong MW. 2020. Prediction of corrosion inhibition efficiency of pyridines and quinolines on an iron surface using machine learning-powered quantitative structure-property relationships. Appl. Surf. Sci. 512 , 145612. ( 10.1016/j.apsusc.2020.145612) [DOI] [Google Scholar]
- 80. Lukovits I, Kálmán E, Zucchi F. 2001. Corrosion inhibitors—correlation between electronic structure and efficiency. Corrosion 57 , 3–8. ( 10.5006/1.3290328) [DOI] [Google Scholar]
- 81. Fuentealba P, Pérez P, Contreras R. 2000. On the condensed Fukui function. J. Chem. Phys. 113 , 2544–2551. ( 10.1063/1.1305879) [DOI] [Google Scholar]
- 82. Morell C, Grand A, Toro-Labbé A. 2005. New dual descriptor for chemical reactivity. J. Phys. Chem. A 109 , 205–212. ( 10.1021/jp046577a) [DOI] [PubMed] [Google Scholar]
- 83. Altalhi AA. 2023. Anticorrosion investigation of new diazene-based Schiff base derivatives as safe corrosion inhibitors for API X65 steel pipelines in acidic oilfield formation water: synthesis, experimental, and computational studies. ACS Omega 8 , 31271–31280. ( 10.1021/acsomega.3c03592) [DOI] [PMC free article] [PubMed] [Google Scholar]
- 84. El-Lateef HMA. 2020. Corrosion inhibition characteristics of a novel salycilidene isatin hydrazine sodium sulfonate on carbon steel in HCl and a synergistic nickel ions additive: a combined experimental and theoretical perspective. Appl. Surf. Sci. 501 , 144237. ( 10.1016/j.apsusc.2019.144237) [DOI] [Google Scholar]
- 85. Khalaf MM, Tantawy AH, Soliman KA, Abd El-Lateef HM. 2020. Cationic gemini-surfactants based on waste cooking oil as new ‘green’ inhibitors for N80-steel corrosion in sulphuric acid: a combined empirical and theoretical approaches. J. Mol. Struct. 1203 , 127442. ( 10.1016/j.molstruc.2019.127442) [DOI] [Google Scholar]
- 86. Abd El-Lateef HM, Khalaf MM. 2019. Novel dispersed Ti2O3-SiO2/polyaniline nanocomposites: in-situ polymerization, characterization and enforcement as a corrosion protective layer for carbon-steel in acidic chloride medium. Colloids Surf. A 573 , 95–111. ( 10.1016/j.colsurfa.2019.04.059) [DOI] [Google Scholar]
- 87. Hammud HH, et al. 2024. Supplementary material from: Bis(dimethylpyrazolyl)-aniline-s-triazine derivatives as efficient corrosion inhibitors for C-steel and computational studies. Figshare. ( 10.6084/m9.figshare.c.7158514) [DOI] [PMC free article] [PubMed]
Associated Data
This section collects any data citations, data availability statements, or supplementary materials included in this article.
Data Availability Statement
All data are available in the main text or the electronic supplementary material [87]. Samples of novel synthesized compounds are available from the authors.


