Abstract
3D echocardiography (3DE) is the standard modality for visualizing heart valves and their surrounding anatomical structures. Commercial cardiovascular ultrasound systems commonly offer a set of parameters that allow clinical users to modify, in real time, visual aspects of the information contained in the echocardiogram. To our knowledge, there is currently no work that demonstrates if the methods currently used by commercial platforms are optimal. In addition, current platforms have limitations in adjusting the visibility of anatomical structures, such as reducing information that obstructs anatomical structures without removing essential clinical information. To overcome this, the present work proposes a new method for 3DE visualization based on “focus + context” (F+C), a concept which aims to present a detailed region of interest while preserving a less detailed overview of the surrounding context. The new method is intended to allow clinical users to modify parameter values differently within a certain region of interest, independently from the adjustment of contextual information. To validate this new method, a user study was conducted amongst clinical experts. As part of the user study, clinical experts adjusted parameters for five echocardiograms of patients with complete atrioventricular canal defect (CAVC) using both the method conventionally used by commercial platforms and the proposed method based on F+C. The results showed relevance for the F+C-based method to visualize 3DE of CAVC patients, where users chose significantly different parameter values with the F+C-based method.
Keywords: 3D/4D echocardiography, volume rendering, medical image visualization, “focus + context”
1. INTRODUCTION
Congenital heart disease is among the most prevalent birth defects, with an occurrence rate of nearly 1 in every 100 births worldwide [1]. In the clinical setting, echocardiography is considered the standard of care to visualize the heart anatomy and is essential for diagnosis, treatment and planning of interventions related to congenital heart disease, as well as for post-operative follow-up. While the use of 2D echocardiography remains widespread, 3D/4D echocardiography provides clinical users with a better interpretation and a more intuitive approach to manipulate the patient’s anatomy, which is crucial to understand complex valve anatomy associated with congenital heart anomalies.
Commercial 3D cardiac ultrasound quantification software customarily uses a direct volume rendering technique specific to 3D echocardiograms (3DE), for which optical properties such as color and opacity are assigned to each unit of volume, commonly referred to as voxels. To adjust volume rendering properties in an intuitive manner, commercial platform interfaces typically offer a set of parameters that allow clinical users to adjust visual components of the echocardiogram in real time, until the desired visualization is achieved. However, to our knowledge, there is currently no work that shows if the methods currently used by commercial platforms are optimal for 3DE visualization.
Furthermore, since the parameters found in current commercial platforms are applied to the entire echocardiogram, we believe that clinical users often make a compromise by keeping as much information as possible from anatomical components of interest, such as the heart valve, without it being partially or even completely hidden by contextual anatomy. Nevertheless, it is essential for clinicians to visualize anatomical components in their respective context: therefore, the real challenge lies in retaining as much contextual information as possible, without hiding any components of primary interest such as the valves.
This study presents a new method for 3DE visualization based on the “focus + context” (F+C) concept, which aims to present a detailed region of interest while also providing an overview of the context in lesser detail. To our knowledge, although previous work has shown interest for visualization techniques with F+C in medical applications such as augmented reality [2], [3], its usefulness for 3DE visualization has not yet been studied. The goal of the present work was to develop a F+C-based method for viewing 3DE and validate its usefulness in the case of CAVC patients by conducting a user study with clinical experts, where the proposed method will be compared to the method currently used by commercial platforms.
2. METHODS
2.1. Volume rendering
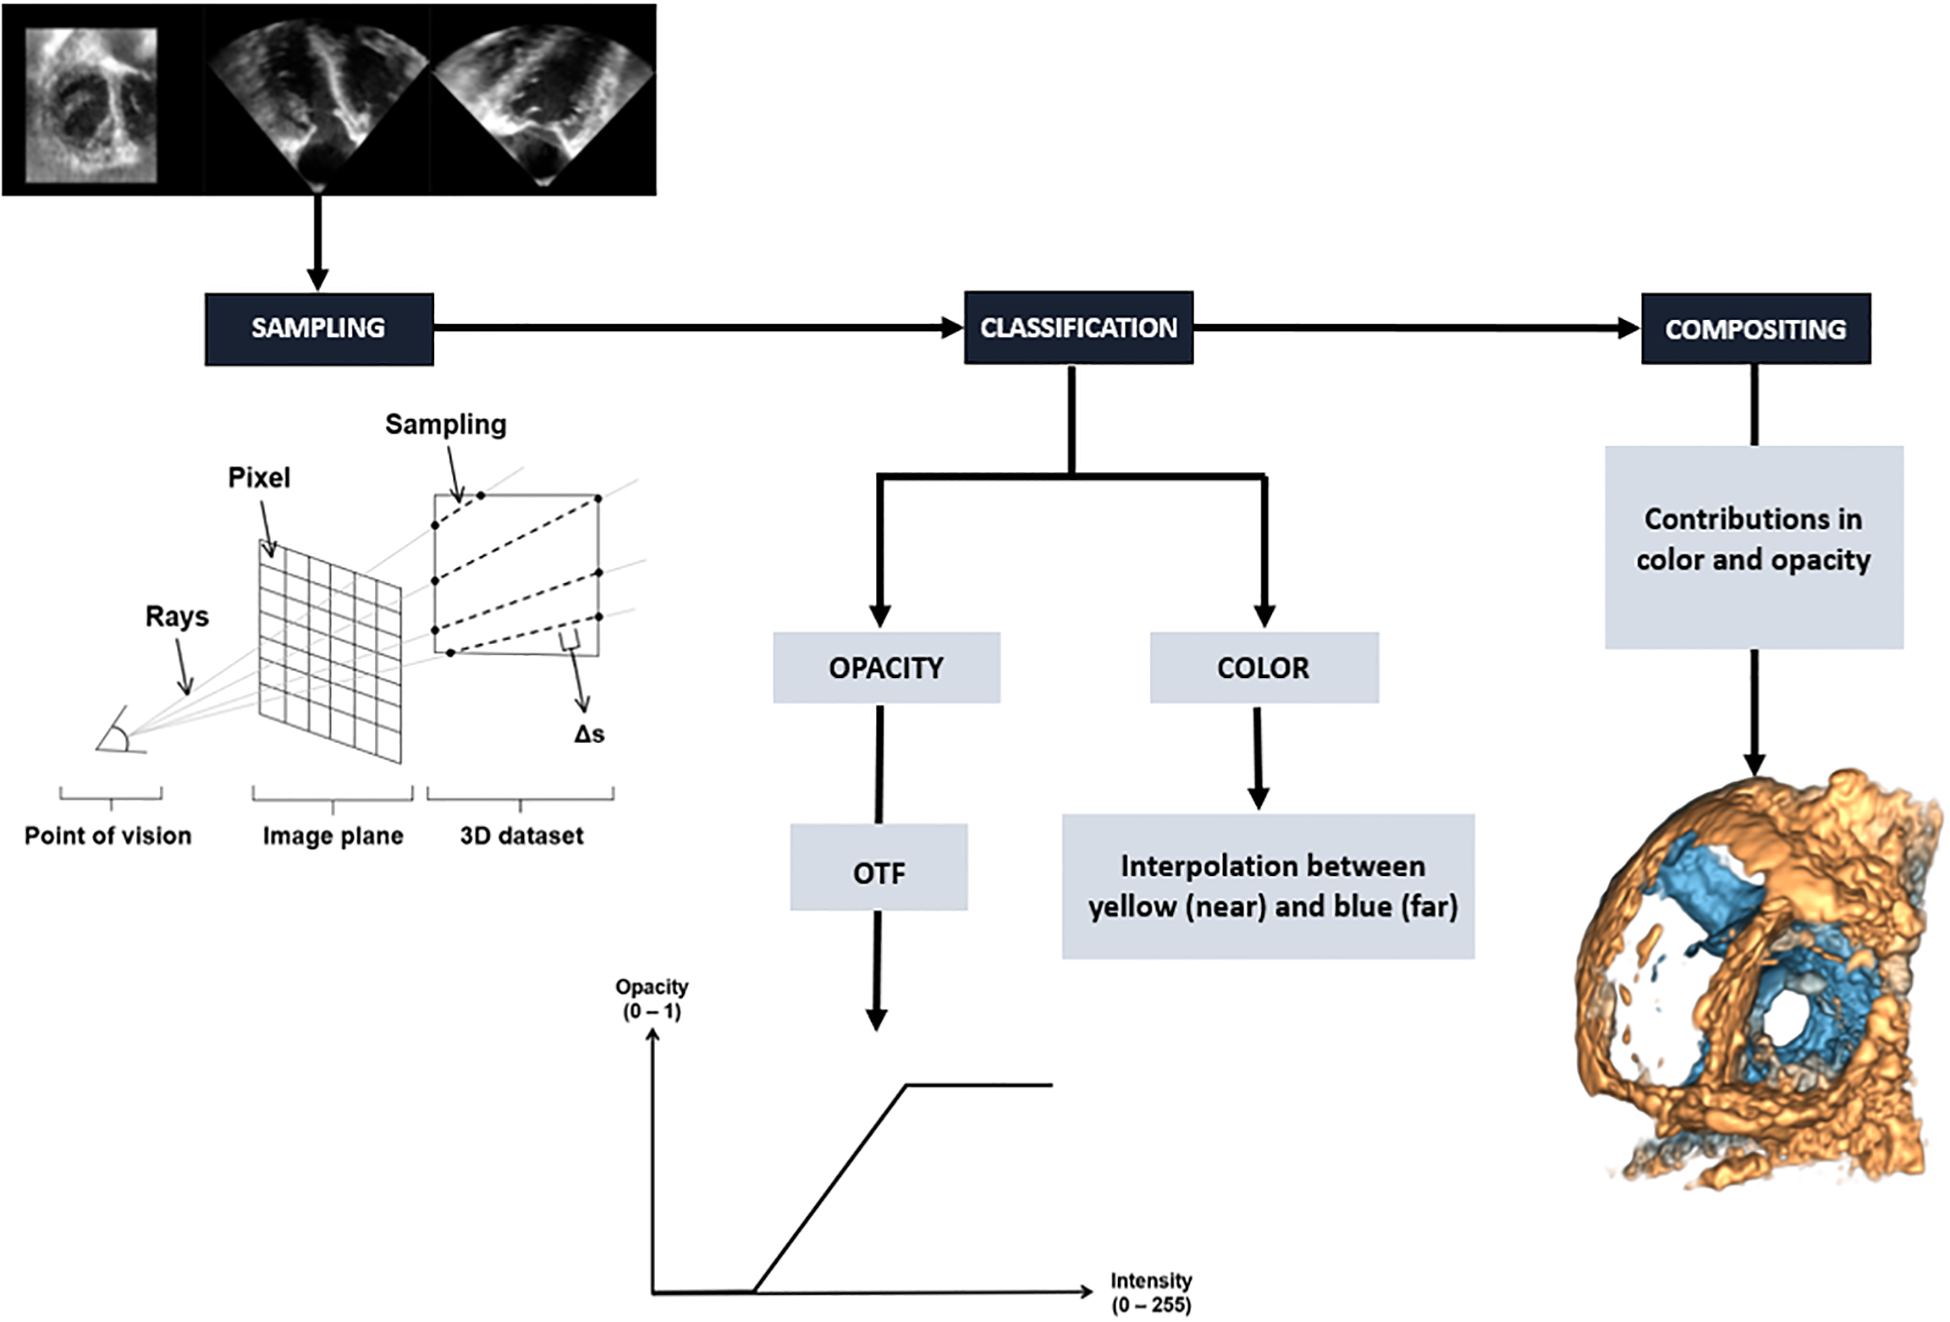
In volume rendering, the color and opacity of each voxel are determined by the projection of a ray that is cast through the 3D dataset. It is different from surface rendering, where a large amount of information is rejected through surface extraction, thus making it more difficult to reproduce textures or anatomical details that might be relevant for 3DE visualization. Volume rendering, which does not require any intermediate step such as segmentation [4], is usually performed using three main steps: sampling, classification and compositing.
During sampling, points are distributed along the section of each ray which crosses the volume. Then, a classification step transforms voxel intensity values into colors and opacity. An opacity transfer function (OTF) is used to map intensity to opacity values, which allows to determine a threshold for which voxels are visible [5]. In the final step of the ray-casting algorithm, i.e. compositing, the contributions from each sample point are accumulated to obtain the final color and opacity values that are visible on the image plane. To achieve this step, color and opacity are calculated recursively for each sampling point along the projected ray. For each iteration along the ray, results from previous sample points are combined to the result of the current voxel, thus resulting in a final color that considers both color and opacity contributions from the classification step as well as those of the previous sampling point.
2.2. Volume rendering in current commercial 3DE platforms
To our knowledge, no existing work supports the methods currently used by commercial platforms in terms of 3DE volume rendering. To the best of our abilities, we have recreated what we believe commercial platforms are currently using as volume rendering methods within the Echo Volume Render module, which is part of SlicerHeart [5], an open-source platform which encompasses a set of tools dedicated to cardiac images such as ultrasound, computed tomography (CT) and magnetic resonance imaging (MRI). The Echo Volume Render has an interface familiar to clinical users, allowing them to modify certain aspects of the volume rendering such as the OTF.
For 3DE volume rendering, the Echo Volume Render uses the standard ray-casting algorithm described above, where the color and opacity of each pixel are determined by casting rays through the 3D dataset (Figure 1). In other imaging modalities such as CT and MRI, it is usual to determine voxel coloring using a color transfer function, since each tissue type tends to have a distinct intensity value. However, in ultrasound images, since tissues are typically distinguished by a difference in texture and not in intensity [6], it is generally impossible to differentiate anatomical components by distinct colors. This makes the use of color transfer functions not suitable for 3DE volume rendering. Therefore, coloring in 3DE volume rendering is based on voxel distance instead of voxel intensity. To help with depth perception, commercial platforms typically use a yellow-to-blue hue convention, where voxels closest to the observer appear yellow, then fade to blue as they get further in depth. This depth-dependent coloring has been implemented inside the Echo Volume Render module, which can be modified through a depth range parameter [5].
Figure 1.
Opacity transfer function for 3DE volume rendering implemented in the Echo Volume Render module.
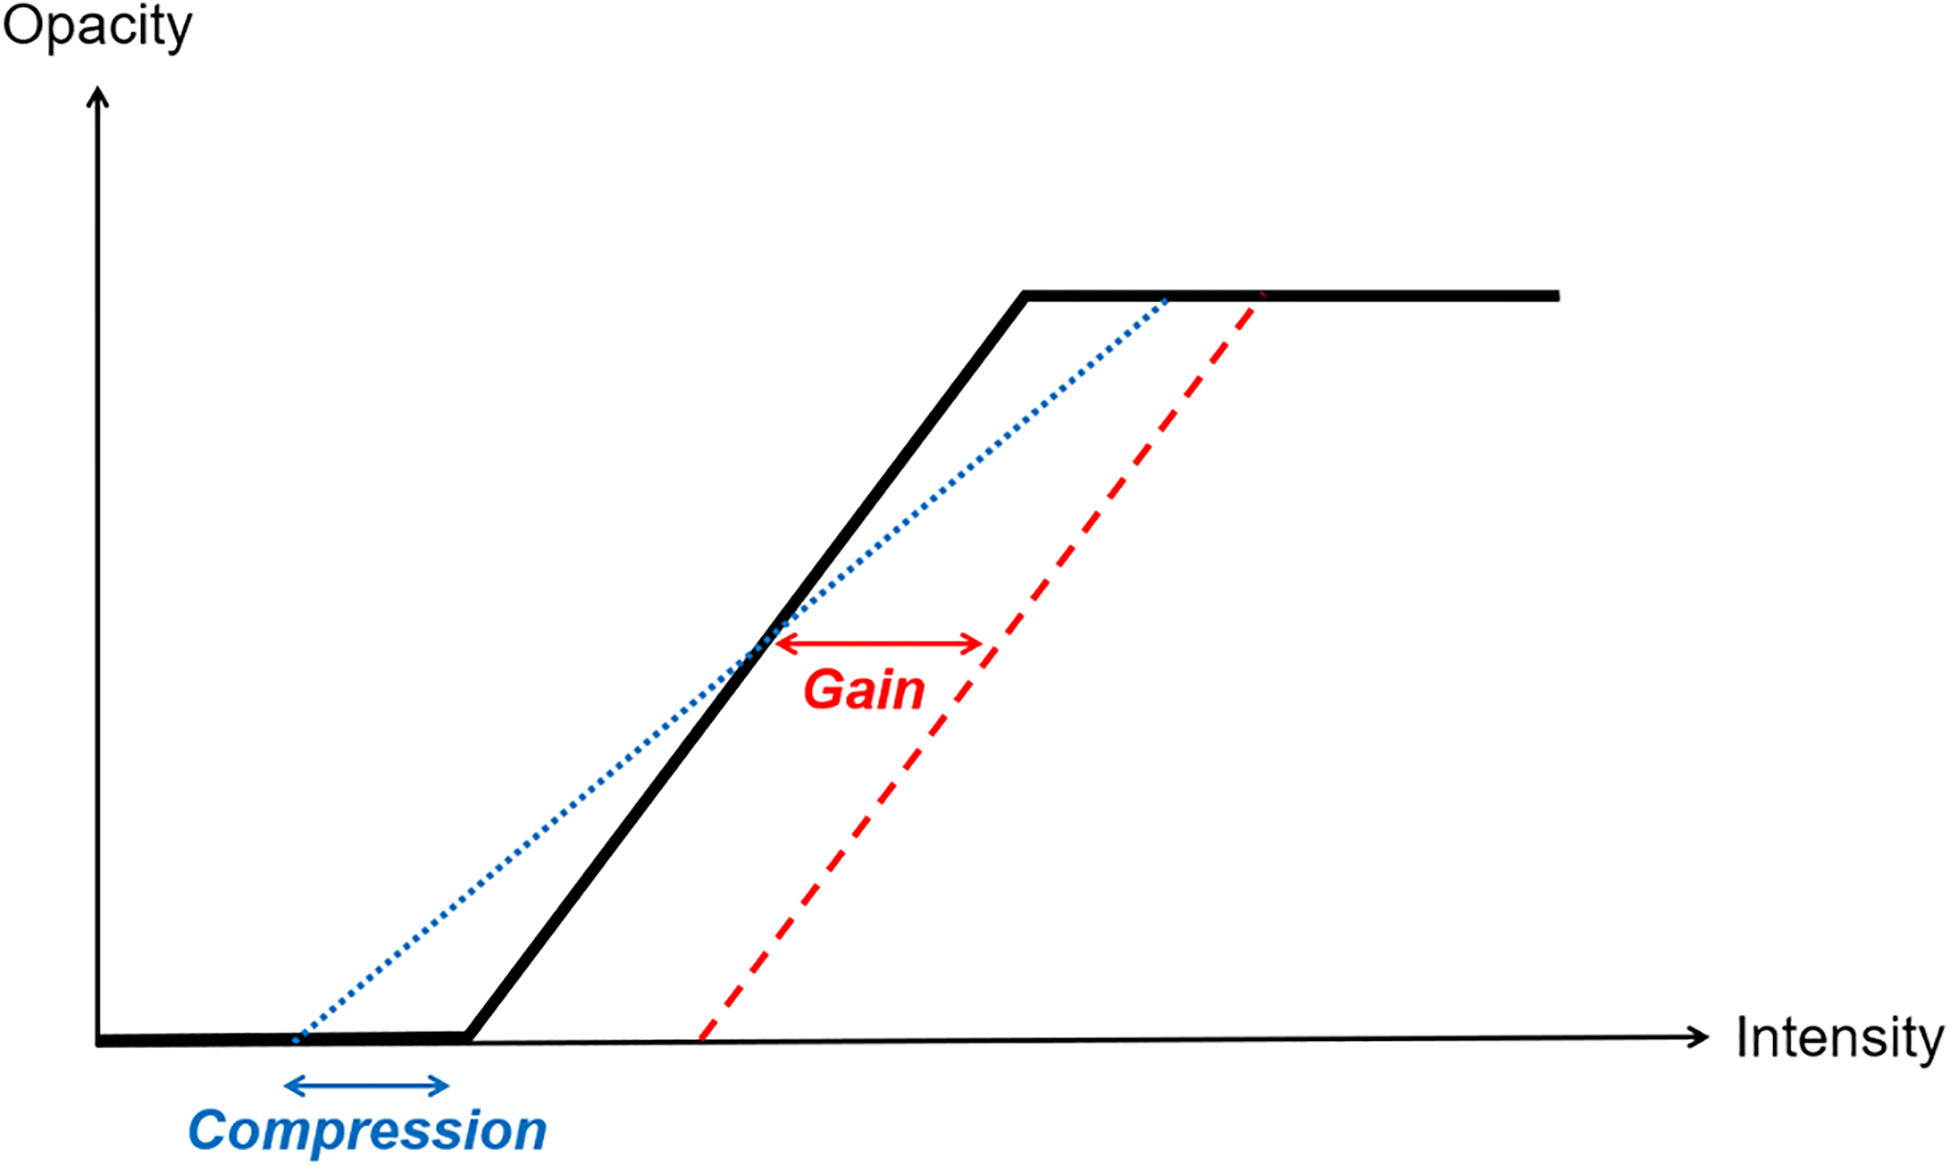
Commercial 3DE platforms typically offer a set of parameters that allow clinical users to adjust volume rendering properties. These parameters enable users to, for example, modify the OTF intuitively using slider buttons on the interface. The Echo Volume Render emulates the parameters commonly found in commercial platforms, such as gain, compression and cropping [5]. Gain modifies the OTF by moving it from left to right, thus allowing to define a transparency threshold for components inside the 3DE according to their intensity value (Figure 2). As for compression, it modifies the slope of the OTF, thus enabling the adjustment of acuity according to user preference.
Figure 2.
Opacity transfer function for 3DE volume rendering implemented in the Echo Volume Render module.
Despite the usefulness of 3D echocardiography to manipulate and interpret heart anatomy, currently available commercial platforms have limitations which make it difficult to visualize some anatomical components in proper detail without encountering an occlusion problem caused by contextual information. Figure 3 shows an example of this problem, where the valve is the anatomical component of interest.
Figure 3.
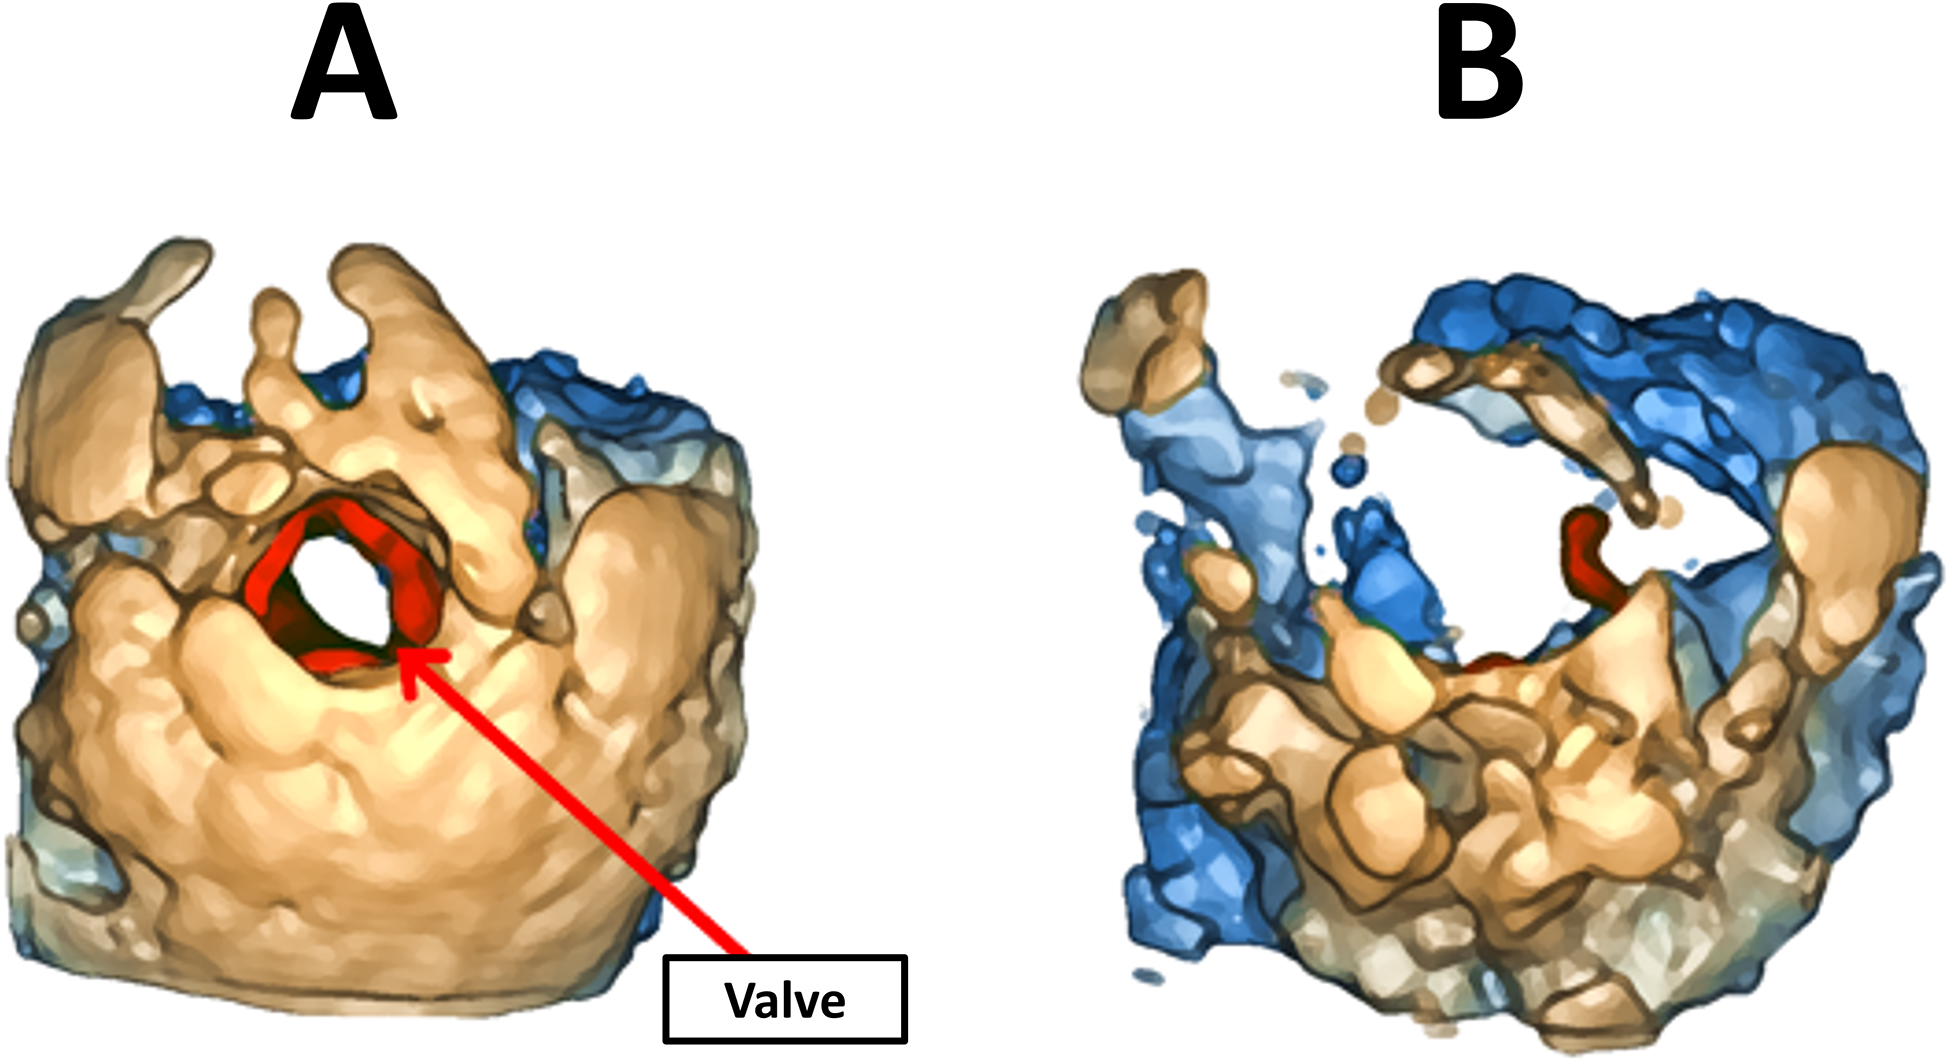
(A) Occlusion of the valve (in red) by contextual information. (B) Illustration of parameter adjustment to remove contextual information, which removes valuable information from the valve.
In Figure 3 (A), although the valve can be visualized clearly, part of the leaflets is hidden by contextual anatomy. When the user adjusts parameters such as gain to modify the OTF, the amount of context is more adequate but most of the valve is now gone, making it nearly impossible to interpret, as shown in Figure 3 (B). Given that speckle noise present in ultrasound images is often of similar intensity to anatomical components, noise removal remains one of the main challenges in 3DE visualization [7]. Although commercial platforms typically have a smoothing parameter that helps remove some of the noise, it is often difficult to remove it completely prior to volume rendering, thus resulting in a noisy volume rendered 3DE.
By using the available user-defined parameters such as gain and compression, clinical users can adjust the opacity of anatomical components. This can help remove some of the noise, but at the expense of also losing valuable information from anatomical components. Currently, in commercial platforms, it is not possible to differentiate the adjustment of parameters in different regions of the 3DE, thus forcing users to choose parameter values that will be applied to the entire volume. Consequently, we suspect that clinical users often make a tradeoff between anatomical components of primary interest and their surrounding context.
A cropping parameter allows the user to crop the 3DE volume by defining a region of interest (ROI) bounded by a rectangular prism whose dimensions and orientation can be modified by the user. This allows, for example, to remove information located in front of the valve. However, cropping is a partial solution to the above-mentioned occlusion problem, since it tends to remove a large amount of contextual information that may be relevant to the interpretation of the anatomy (Figure 4).
Figure 4.
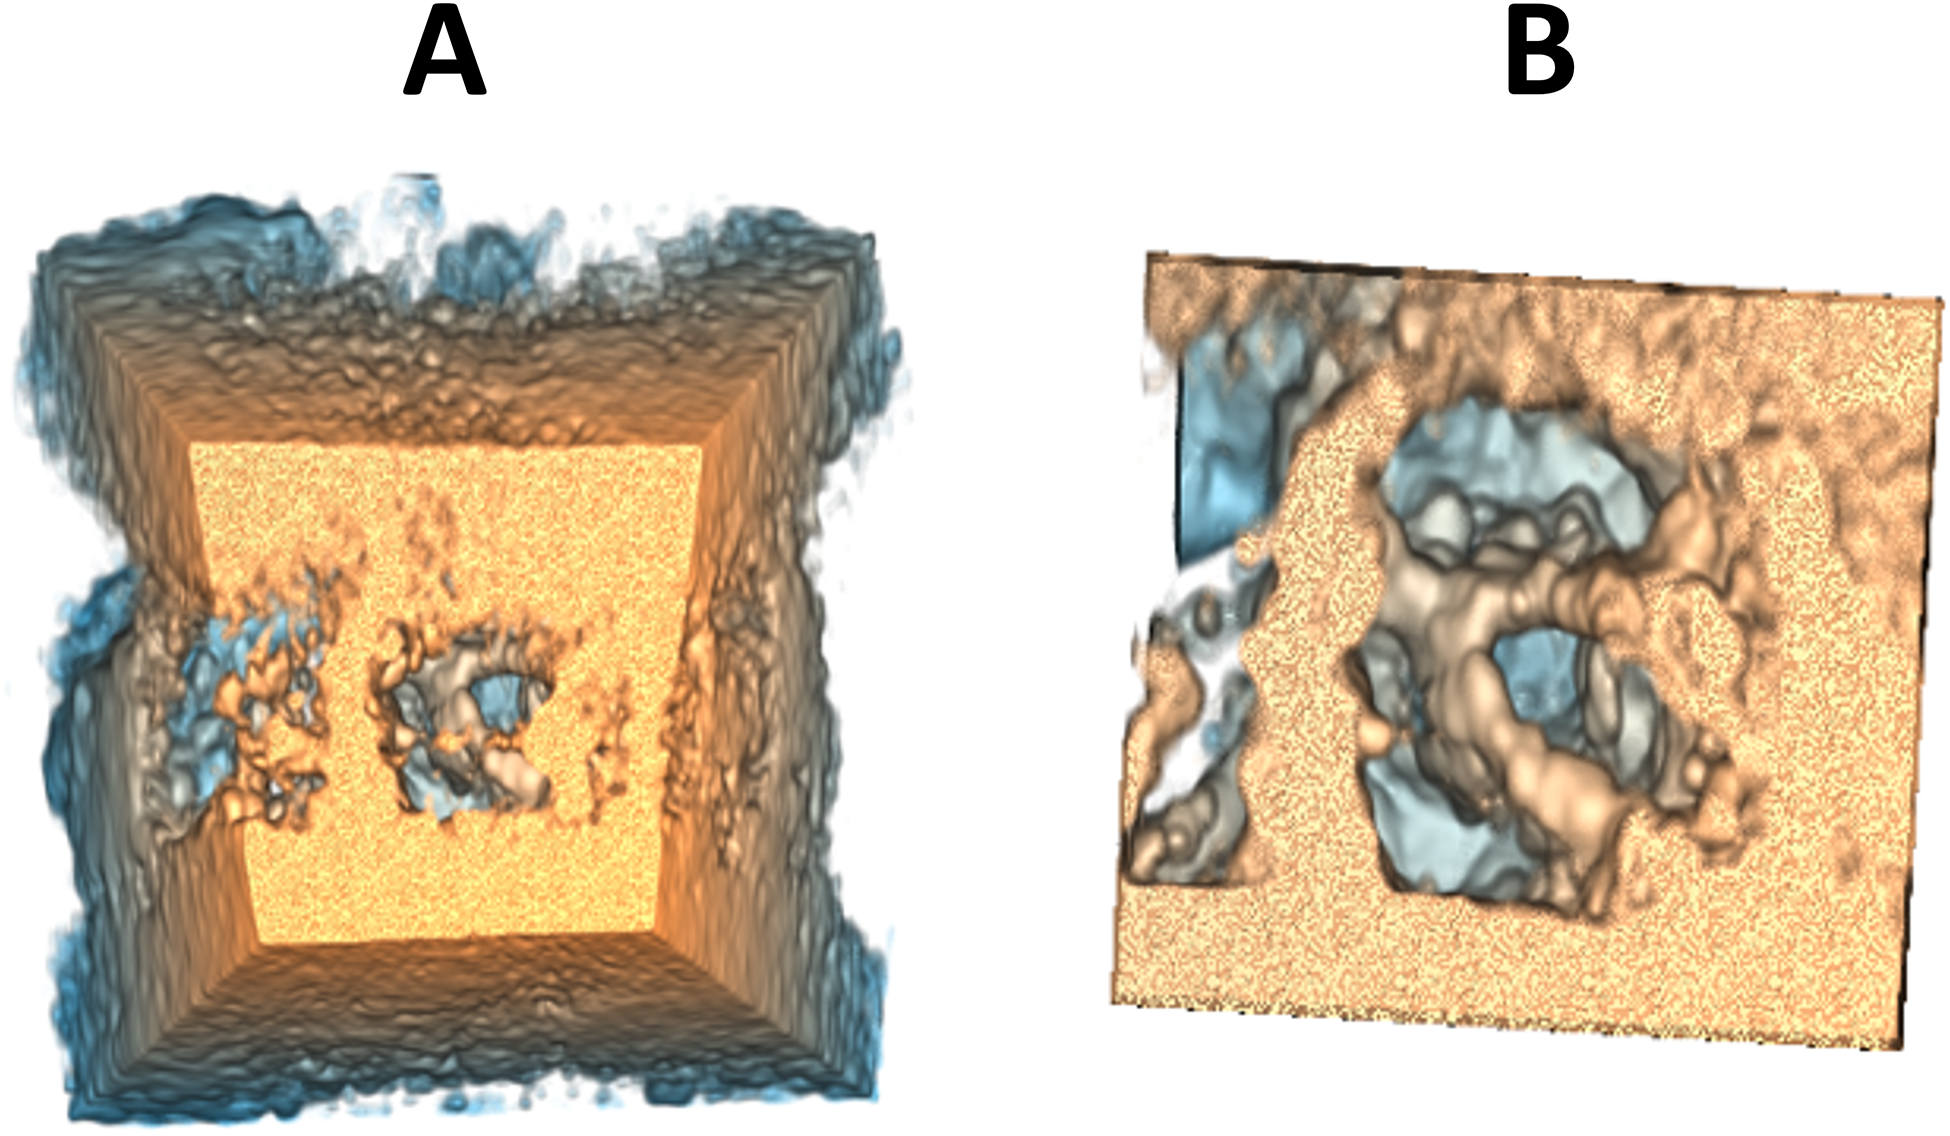
Example of before (A) and after (B) cropping.
The challenge of primary interest for this work was to develop a method for 3DE visualization allowing to clearly visualize components of interest, such as the valve, without them being occluded by contextual anatomy, while nevertheless preserving as much context as possible to provide clinical users with an adequate overview of the surrounding anatomy. The goal of this new visualization method is to propose a better alternative to cropping, allowing to reduce the quantity of contextual information rather than removing it completely.
2.3. Pilot study with clinical experts
A pilot study was conducted among clinical experts at the Children’s Hospital of Philadelphia to determine user preferences for 3DE parameter adjustment. The hypothesis was that there would be consensus in parameter adjustment among different experts for the parameters that are considered as being the most important to adjust the 3DE visualization. During this pilot study, six clinical experts (4 female, 2 male) adjusted parameters for five different 3DE. Among the clinical experts, half were sonographers, and the other half were cardiology fellows. Clinical users had, on average, 10 years of experience in their current job position, ranging from 10 months to 26 years. Age varied from 34 to 58, with an average of 43. All clinical users had a normal vision, or a vision corrected to normal by lenses such as glasses or contact lenses and none were colorblind. During this pilot study, clinical experts adjusted the smoothing, gain, compression, and depth range parameters for five different 3DE until they achieved the best visualization possible according to their expertise.
According to the results, clinical experts were, for the most part, in agreement for the optimal gain parameter values. A multifactor ANOVA confirmed this, where no significant difference in gain values were observed from one clinical expert to another (p-value = 0.1848). As for the other parameters, chosen values significantly differed from one expert to another (smoothing factor: p-value = 0.0167; compression: p-value = 0.0009; depth range: p-value < 0.00005). Following the parameter adjustment task, clinical experts were asked to enumerate the parameters that they considered as being the most important for 3DE visualization adjustment. Results showed that smoothing and gain were considered among the most useful parameters by 83% of participants, where compression and depth range were noted as most useful by 50% of participants.
Considering the importance given by the clinical experts to the gain parameter during the pilot study, it was deemed necessary to include this parameter in the development of a new method for 3DE parameter adjustment. More specifically, the proposed method described in the following sections aimed to provide more flexibility regarding gain adjustment, given its importance for 3DE visualization.
2.4. A 3DE volume rendering method based on “focus + context”
“Focus + context” (F+C) is a visualization concept which aims to present a detailed region of interest while preserving an overview of the context in lesser detail. The usefulness of such a concept has been demonstrated in several medical imaging applications, such as augmented reality to help maintain an adequate level of context from the reality surrounding virtual objects [2], [3]. Other previous work demonstrated an interest in F+C in blood vessel visualization [8] as well as for quantifying blood flow inside brain aneurysms [9]. The work of Schulte zu Berge et al. [6] proposes a new F+C-based method for ultrasound volume rendering classification, which aims to overcome current shortcomings such as the difficulty to differentiate anatomical components given the homogeneity of intensity values inside these images. However, to our knowledge, no previous work has explored the usefulness of a F+C-based method for 3DE visualization.
In this work, we present a new visualization method that was developed to overcome the occlusion problem described above, based on the F+C concept. The new method has been developed inside of the Echo Volume Render module from the SlicerHeart platform [5]. This new version of the module based on F+C provides the user with an additional set of parameters that enables the adjustment of gain and compression parameters inside a user-defined spherical region of interest (ROI), which we will refer to as the focus region. In the background, these additional parameters modify a second OTF that has been added to the module, thus enabling the adjustment of gain and compression parameters independently in two different regions: the focus region and the context region (Figure 5).
Figure 5.
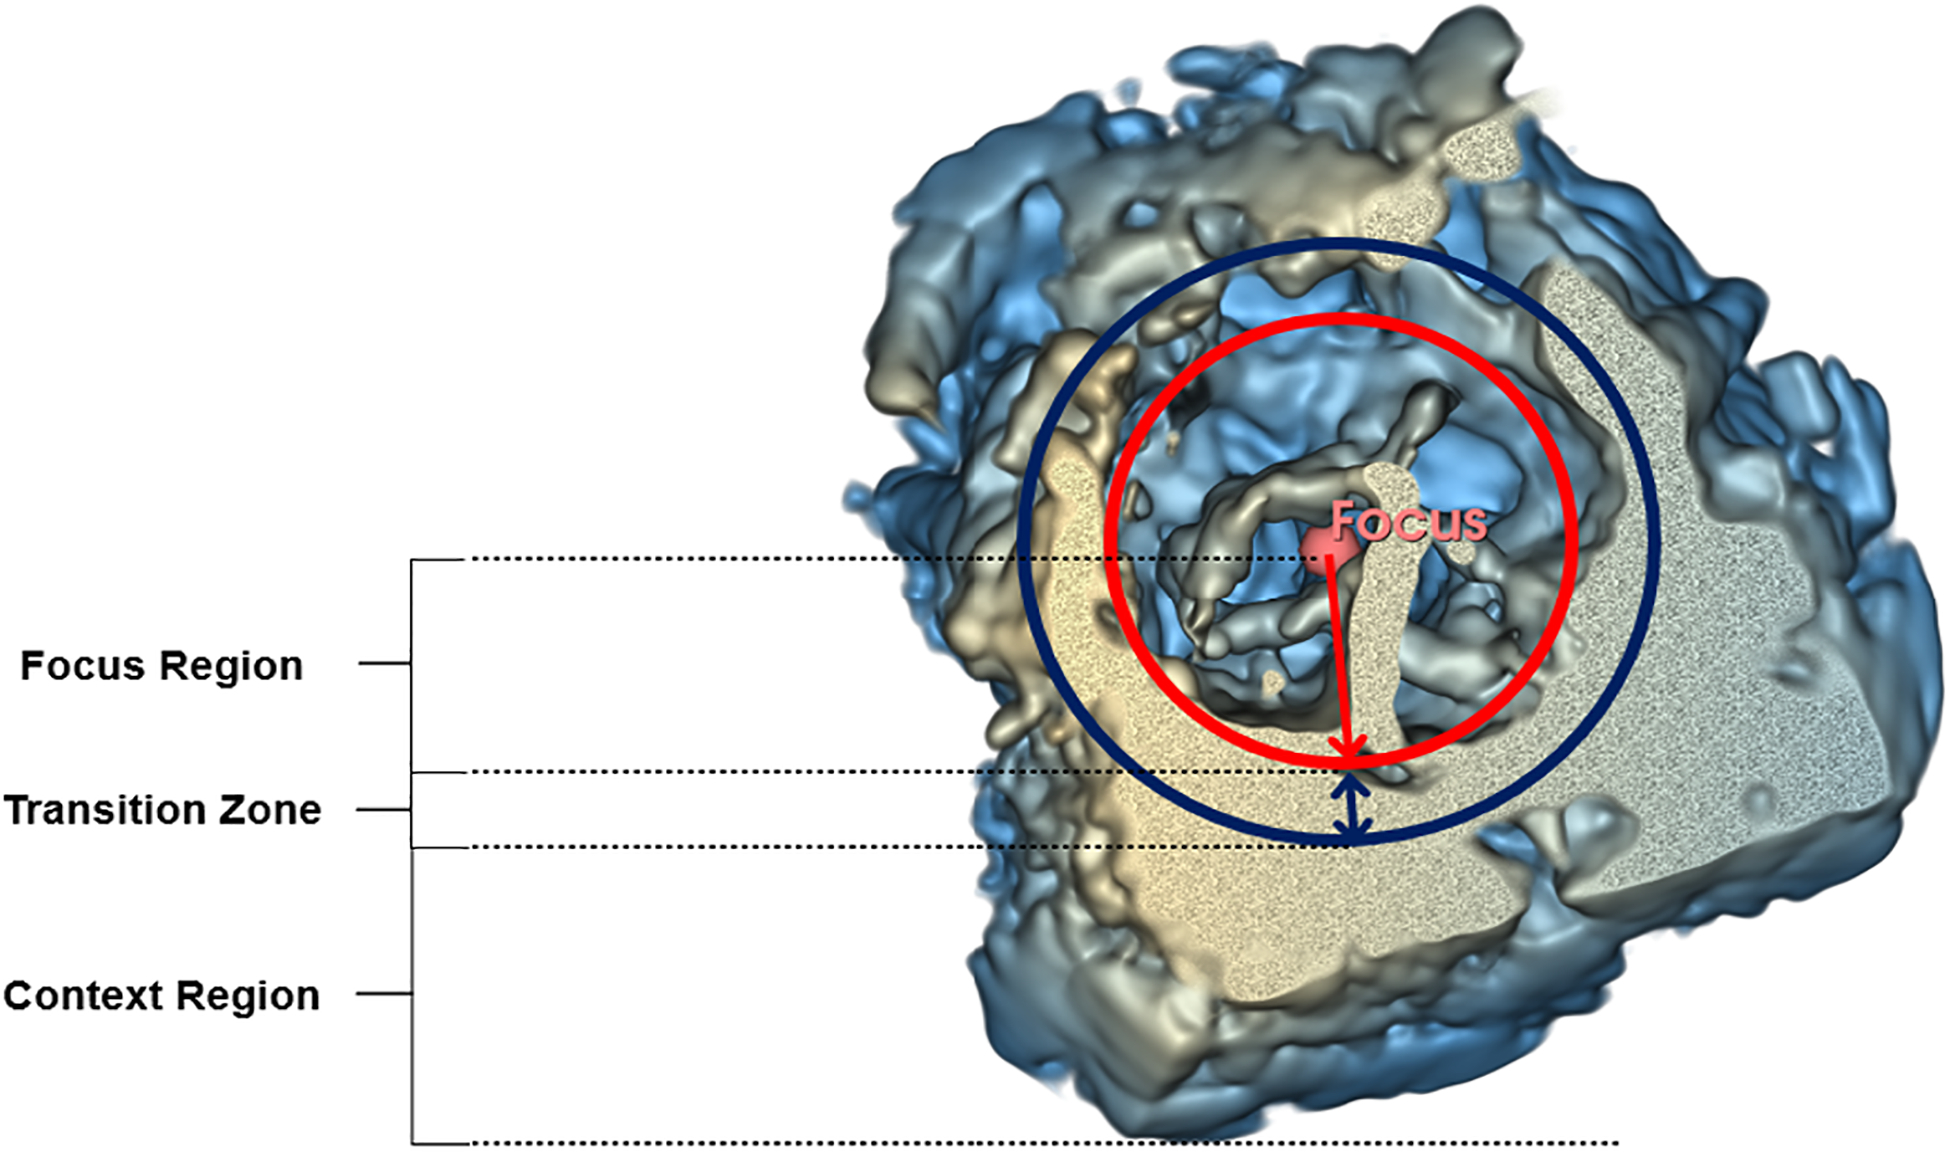
Focus and context regions for parameter adjustment with the F+C-based method.
In the proposed version of the Echo Volume Render module with F+C, the radius of the spherical focus region can be modified by the user with a slider button. The position of the focus sphere center can also be modified by the user by directly inside the 3D space or in any of the three 2D views that are shown on the interface.
To avoid an abrupt transition between the focus and context regions, a transition zone has been added to interpolate between the parameter values of the two regions. An interpolation distance of 10% of the focus sphere radius was chosen since it was found to be adequate in providing a hardly perceptible transition. Figure 6(B) shows an example of a volume-rendered 3DE using the F+C-based method, compared to the state-of-the-art (SOTA) method shown in Figure 6 (A).
Figure 6.
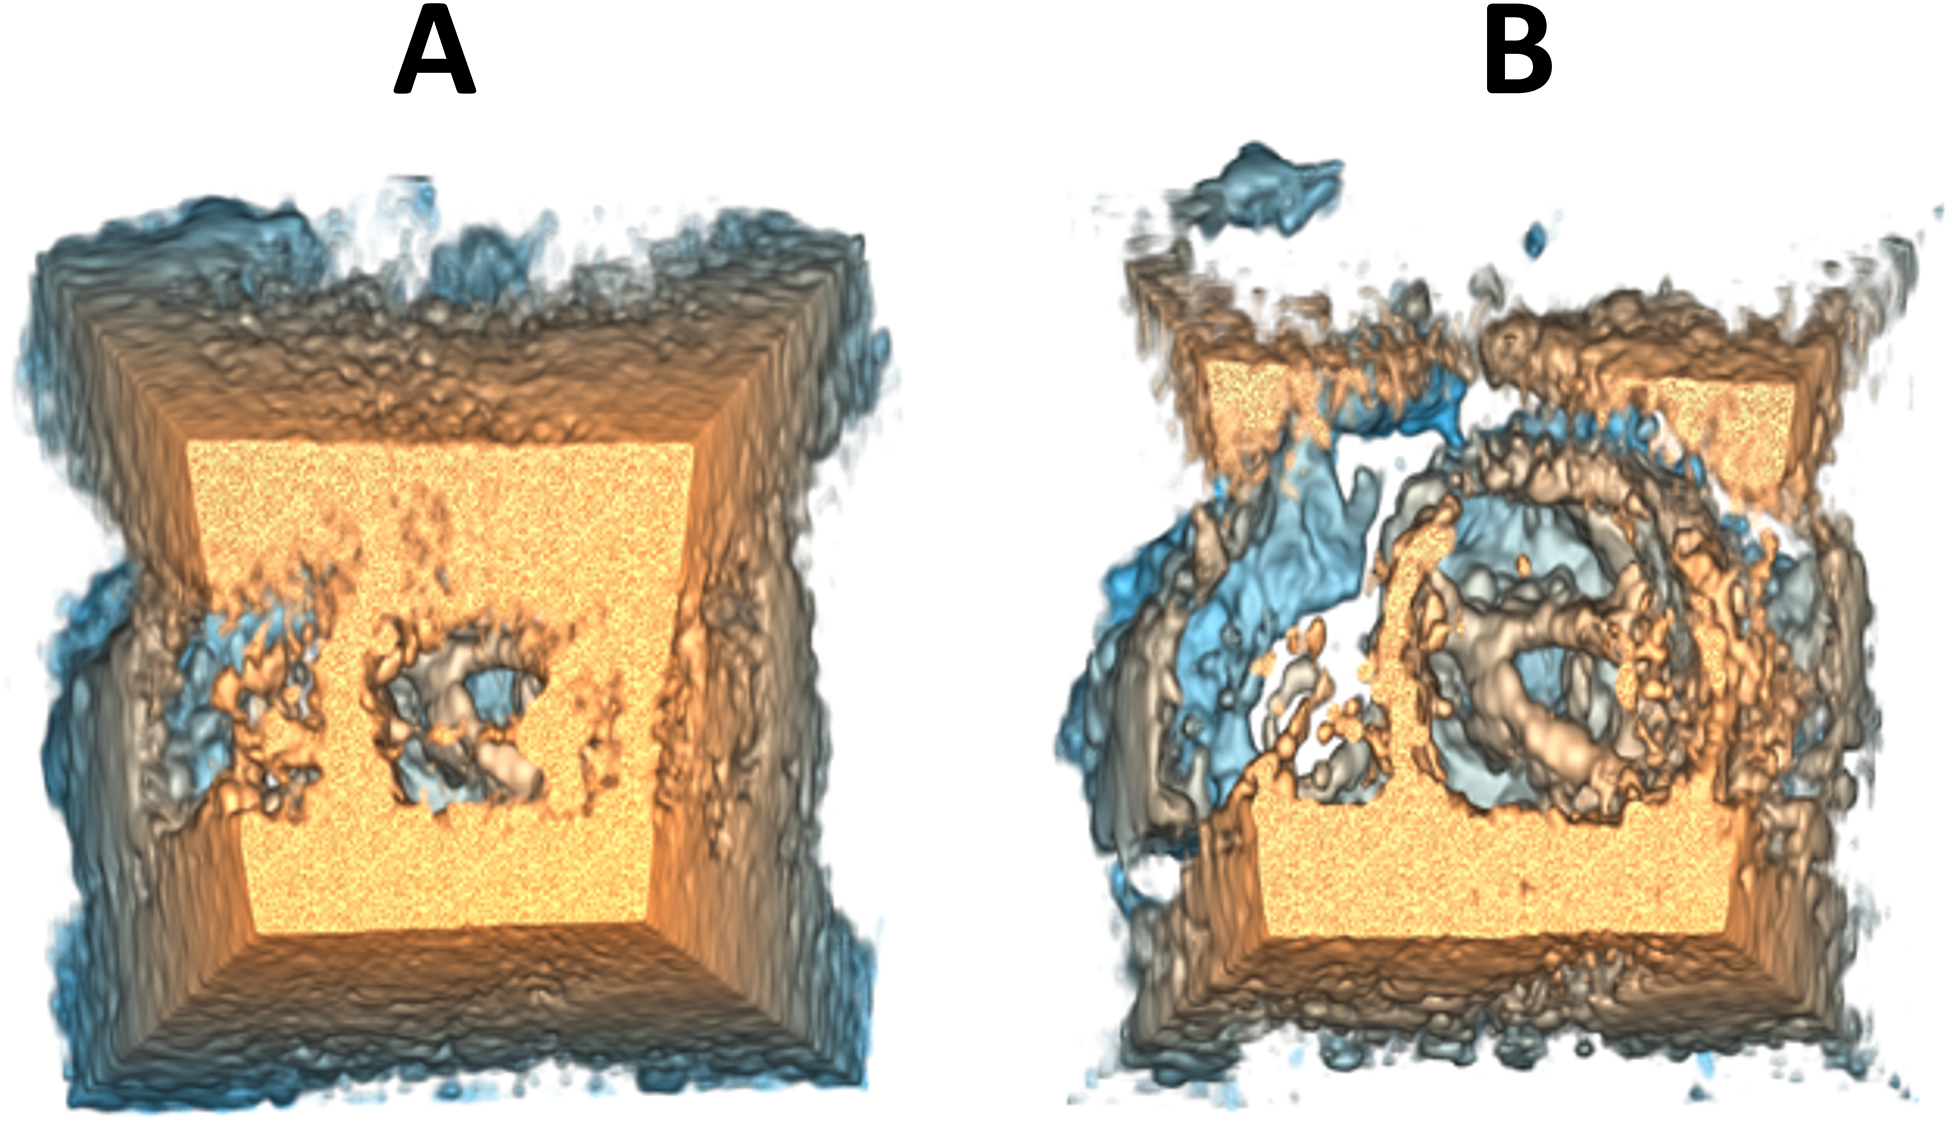
Example of 3DE volume rendering parameter adjustment in SlicerHeart using (A) the state-of-the-art method and (B) the F+C-based method.
2.5. User study with clinical experts
To validate the usefulness of the new visualization method based on the F+C concept, a user study has been conducted amongst clinical experts working daily with 3DE visualization and manipulation. To participate, clinical experts had to currently hold a job position requiring the manipulation and visualization of echocardiograms, either as a physician, cardiologist, cardiac surgeon, sonographer, or clinically trained research assistant. Subjects needed to have a normal vision, or a vision corrected to normal by lenses such as glasses or contact glasses and not be colorblind.
To limit the duration of the tasks required by the clinical experts, the user study was limited to the adjustment of three parameters, i.e., gain, compression and cropping. Because the F+C-based method offers gain and compression parameters for both the focus and context regions, it was essential to choose these two parameters as variables for the study. Furthermore, since the F+C-based method allows the amount of contextual information to be adjusted independently from the focus region, it was plausible that clinical users would retain a larger amount of context with this method, since the opacity of the context could be reduced with the gain and compression parameters without relying solely on the cropping parameter. More specifically, we suspected that the F+C-based method would offer more control over context adjustment and would therefore result in users preserving a larger cropping volume. For this reason, we chose to study the cropping parameter as a variable in this study, with the aim of determining whether there would be a difference in the use of the cropping parameter for the two methods. To limit the number of variables in the study and to make it easier to compare one method to another, the rotation angles of the cropping box were fixed beforehand by a clinical research assistant experienced with 3DE visualization so that the cropping box was parallel to the valve annulus. Thus, during the study, only the dimensions in the three axes of the cropping box could be adjusted. The values for the other parameters, such as smoothing and depth range, were also adjusted by a clinical research assistant experienced with 3DE visualization prior to the study.
Participants were first asked to answer a pre-questionnaire to gather general information, such as their age, sex and current job position. Then, participants were asked to adjust gain, compression and cropping parameters using the SOTA method. Parameters were adjusted for a total of five 3DE plus one practice 3DE to get familiar with the platform. The instructions were to adjust the parameters until the best visualization was obtained, according to the participants’ clinical expertise. For each 3DE, participants were asked to rate their level of satisfaction with the final visualization achieved using a Likert scale (1 = Very dissatisfied, 2 = Dissatisfied, 3 = Neither satisfied nor dissatisfied, 4 = Satisfied, 5 = Very satisfied). Participants repeated the parameter adjustment task with the F+C-based method, with the same 3DE and practice as the previous task with the SOTA method. Following parameter adjustment, participants were asked to answer a post-questionnaire to get feedback on the two visualization methods.
To limit variability between the adjustment of different 3DE, the selected 3DE came from six patients having received the same diagnosis, i.e. complete atrioventricular canal defect (CAVC), a pathology characterized by holes in the septum between the atria and the ventricles often resulting in one common atrioventricular valve not closing properly. Patients with CAVC usually require surgery in the first six months of life to avoid complications such as pulmonary hypertension and heart failure [10], [11]. For these surgical interventions, the use of 3DE is essential not only for planning but also for post-operative evaluation. Although a low mortality risk is associated with CAVC repair, these surgical interventions often have less than optimal outcomes, where post-operative atrioventricular regurgitation is present in nearly 40% of cases [12]. For the user study, the chosen 3DE data came from six different patients with CAVC defects having undergone valve repair surgery. All six 3DE had been acquired since 2018 and were classified as being good quality.
3. RESULTS
3.1. Participant demographics
The participant sample was composed of 20 clinical experts (13 female, 7 male) working daily with echocardiogram visualization and manipulation. 65% were recruited at the Children’s Hospital of Philadelphia (Philadelphia, U.S.A.), 20% at the Sainte-Justine University Hospital Center (Montréal, Canada) and 15% at the Centre Hospitalier de l’Université de Montréal (Montréal, Canada). 30% of participants were licensed cardiologists, 25% licensed cardiac sonographers, 15% cardiology fellows, 5% cardiology residents and 25% clinical research assistants working daily with 3DE in a hospital research setting. Experts were aged between 23 and 59 years (mean = 40, median = 38, std = 13) and had between 4 months and 30 years of experience in their current job position (mean = 8 years, median = 2, std = 10). All experts had a normal vision, or a vision corrected to normal by lenses such as glasses or contact lenses. None were colorblind.
3.2. Parameter adjustment
For each clinical expert, values for the gain, compression and cropping parameters have been recorded for all five 3DE plus the practice 3DE, with the SOTA method as well as the F+C-based method (Figure 7). The gain and compression adjustment from the SOTA method will be referred to as the global gain and global compression, whereas the terms focus gain, focus compression, context gain and context compression will be used to define the parameter adjustment for the focus and context regions with the F+C-based method.
Figure 7.
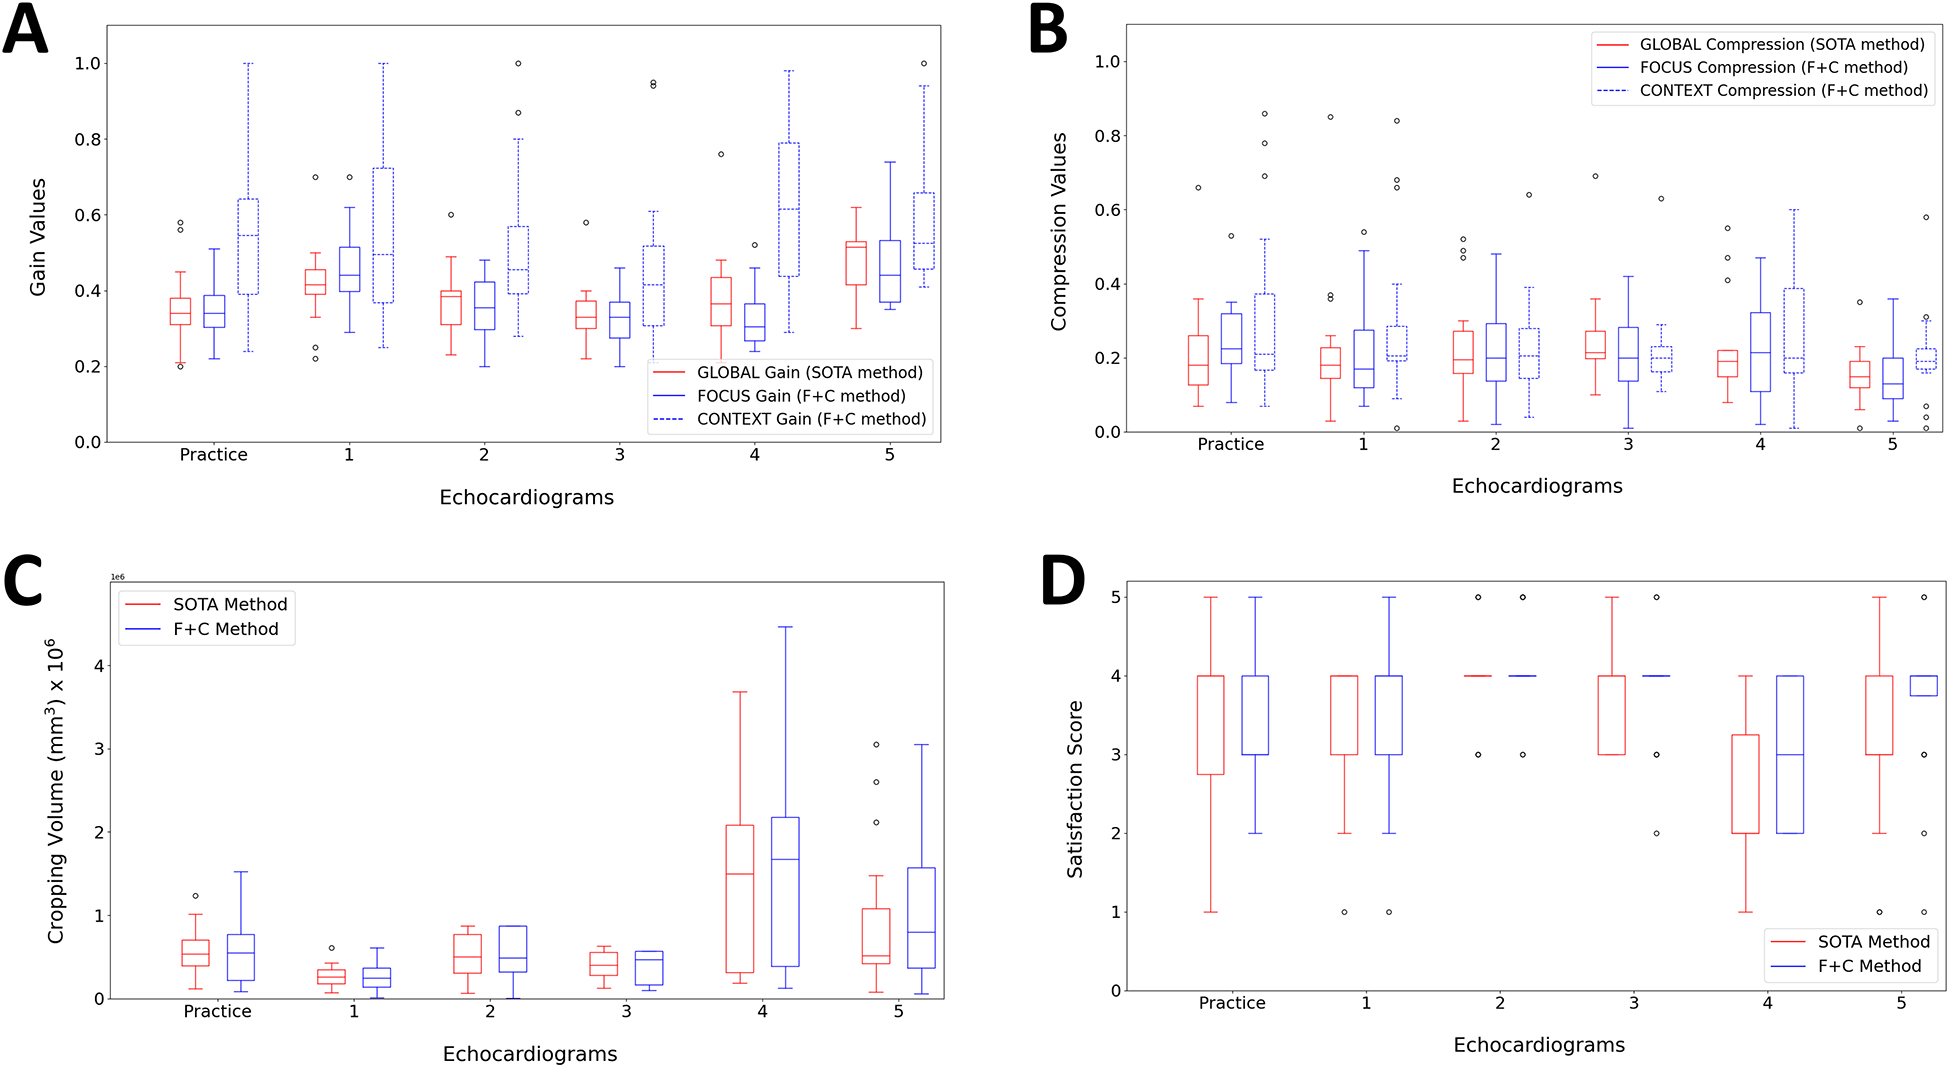
Chosen values by clinical experts for the gain (A), compression (B), cropping volume (C) and satisfaction score (D) for both SOTA and F+C methods during the user study.
Following a multifactor ANOVA, while global gain and focus gain values were similar (p-value = 0.8917), significantly different gain values were observed for the context gain (p-value < 0.00005) (Figure 7 (A)). The type of gain (global gain, focus gain or context gain) also had a significant effect on the gain value (p-value < 0.00005). Although the echocardiograms also influenced the gain value (p-value < 0.00005), significance of the type of gain on the gain value has been observed when repeating the ANOVA for each echocardiogram separately. These results show that the SOTA method is not optimal for context gain adjustment since clinical experts chose significantly different values for the context region when given the option to do so. For the compression parameter, the effect of the compression type (global compression, focus compression or context compression) on the chosen value has been shown to be significant (p-value = 0.03) (Figure 7 (B)). However, when repeating the multifactor ANOVA for each echocardiogram separately, no significant effect has been shown for the type of compression on the compression value for any of the echocardiograms, which makes it difficult to confirm that the F+C-based method has an impact on chosen compression values. According to results from a multifactor ANOVA, the method (SOTA or F+C) had no significant effect on the cropping volume (p-value = 0.4210) and no significance has been observed when repeating the analysis for each echocardiogram separately (Figure 7 (C)).
Following the parameter adjustment of each 3DE, clinical experts were asked to rate their personal satisfaction with the achieved visualization using a Likert-type scale (1 = Very dissatisfied, 2 = Dissatisfied, 3 = Neither satisfied nor dissatisfied, 4 = Satisfied, 5 = Very satisfied) (Figure 7 (D)). ANOVA results showed a significant effect of the method on the satisfaction score (p-value = 0.0051). However, ANOVA results for each separate 3DE showed significance in one third of the cases (practice: p-value = 07894; 1: p-value = 0.2727; 2: p-value = 0.1599; 3: p-value = 1.0000; 4: p-value = 0.0012; 5 : p-value = 0.0027).
According to 90% of the clinical experts, the F+C-based method allowed to achieve a better visualization of the valve, the contextual anatomy and the overall 3DE compared to the SOTA method (Table 1). Comments noted by these clinical experts include, but are not limited to, a better visualization of the valves or anatomical components of interest, the possibility of removing contextual information that obstructs the valve, a better control and more flexibility in parameter adjustment when using the F+C-based method.
Table 1.
Results from post-questionnaire
| Question | SOTA method | F+C-based method |
|---|---|---|
| In your opinion, which of the two methods allowed a better visualization of the valve? | 2 (10%) | 18 (90%) |
| In your opinion, which of the two methods allowed a better visualization of the contextual information around the valve? | 2 (10%) | 18 (90%) |
| In your opinion, which of the two methods allowed a better overall visualization? | 2 (10%) | 18 (90%) |
4. DISCUSSION
Following the user study, a significant effect was observed between global gain and context gain, as well as between focus gain and context gain. These results suggest that the methods currently employed by commercial platforms are not optimal for the visualization of contextual anatomy. Moreover, the results imply that with commercial platforms, clinical experts tend to choose gain values that prioritize the visualization of components of primary interest, such as the valve, with less consideration of the contextual anatomy. Given the significant difference observed with the adjustment of the context gain when clinical experts used the F+C-based method, it suggests that the proposed method allows a better adjustment of the contextual information compared to methods conventionally used by commercial platforms. These results confirm the hypothesis that commercial platforms require clinical users to make a compromise between the anatomical components of interest and their surrounding context.
A significant effect of the type of compression on the compression value was observed, although this effect has not been observed for any of the echocardiograms separately. Because of this ambiguity, it is not possible to confirm that there is a compromise in the adjustment of compression for the region of interest and the context with commercial platforms. Since the compression parameter does not modify the amount of visible information as the gain parameter does and rather modifies the acuity of the 3DE by controlling the slope of the OTF, it is possible that compression does not have the same importance as the gain for parameter adjustment. This statement agrees with the results from the pilot study, where gain was deemed as being more important compared to compression.
As for cropping, no significant difference has been observed between the SOTA and F+C-based methods. Findings for cropping did not confirm our hypothesis that clinical users would use less cropping with the F+C-based method than with the SOTA method. However, post-questionnaire feedback showed that some clinical experts thought the use of cropping was less necessary with the F+C method and that this method made it possible to retain a greater volume of the 3DE. It is possible that the effect of the F+C-based method on cropping is present, although it has not been observed in the present study. This will have to be verified in future work, with a larger set of 3DE data and with participants having had more experience with the F+C-based method.
Furthermore, results showed a significantly higher satisfaction score for the F+C-based method in a third of cases, which means the proposed method could improve 3DE visualization in some cases. Although a significant difference was not observed for the majority of the 3DE used in this study, it is still relevant to note that it could improve visualization on some echocardiograms, which could contribute to a better interpretation of the anatomy of these patients. Since the dataset in this study was limited to post-repair CAVC patients, a greater satisfaction may be observed with other pathologies or with 3DE that are more difficult to adjust with conventional methods; however, subsequent work is needed to confirm this hypothesis. It is also important to note that the F+C-based method does not prevent users from recreating the same visualization as conventional methods by simply assigning the same values to parameters in both regions. Therefore, the F+C-based method does not take away from the conventional method; it only offers more options for parameter adjustment. According to post-questionnaire results, 90% of the clinical experts chose the F+C-based method as being superior for achieving the best overall 3DE visualization, thus demonstrating the potential of such a method for 3DE visualization in the clinical setting.
5. CONCLUSION
The main objective of the present work was to propose a new method for 3DE visualization based on the “focus + context” (F+C) concept, thus allowing clinical users to adjust contextual anatomy independently from a region of interest such as the heart valves. The potential of this new 3DE visualization method, which was implemented inside the Echo Volume Render module from the SlicerHeart platform, has been validated following a user study conducted with clinical experts such as cardiologists, cardiac sonographers and other clinical users working daily with 3DE visualization. During this study, 20 clinical experts adjusted gain, compression and cropping parameters for 3DE acquired on post-repair CAVC patients until achieving the best visualization according to their expertise. Results showed significantly different values for gain in the contextual region when the F+C-based method was used. From this result, it can be concluded that methods currently used by commercial platforms are not optimal for gain adjustment. Although compression and cropping did not show significant results, most participants thought the F+C-based method provided a better visualization, and a significantly higher satisfaction score was observed in a third of cases.
Despite having observed a relevance for an F+C-based method in the context of 3DE visualization, recommendations can be made for future studies to overcome some limitations. Firstly, it is important to state that the results found in the present study are only valid for post-repair CAVC patients. The relevance of F+C for other pathologies will thus need to be verified in future work by conducting a similar user study using a more diverse 3DE dataset. Moreover, the study will need to be repeated with a larger number of clinical experts. Since it was difficult to recruit a larger number of participants given the required expertise to participate, the study could be installed on a cloud server to make participation accessible anywhere. In addition, it would be interesting to systematically use the F+C-based method in parallel with commercial platforms and gather cases where the F+C-based method is identified by clinical experts as improving the interpretation of the patient’s anatomy or having made it possible to make a certain decision as to diagnosis or surgical planning. It would also be relevant to verify the usefulness of F+C-based methods in other cardiac imaging modalities, such as CT and MRI.
Footnotes
DISCLOSURE
Two of the 20 clinical experts that participated in the user study are co-authors of this paper. However, since these authors did not directly participate in the implementation of the F+C-based method and given that their contribution prior to their participation was to offer a clinical perspective to understand current platform limitations, it was deemed appropriate to consult them as clinical experts to participate in the study. Furthermore, these authors were unaware of the initial hypotheses before participating. We have also confirmed statistically that the results collected from these two participants did not significantly differ from the other clinical experts who participated.
REFERENCES
- [1].Deng B et al. , “Assessment of atrial septal defect using 2D or real-time 3D transesophageal echocardiography and outcomes following transcatheter closure,” Ann. Transl. Med, vol. 9, no. 16, p. 1309, Aug. 2021, doi: 10.21037/atm-21-3206. [DOI] [PMC free article] [PubMed] [Google Scholar]
- [2].Kalkofen D, Mendez E, and Schmalstieg D, “Interactive Focus and Context Visualization for Augmented Reality,” in 2007 6th IEEE and ACM International Symposium on Mixed and Augmented Reality, Nov. 2007, pp. 191–201. doi: 10.1109/ISMAR.2007.4538846. [DOI] [Google Scholar]
- [3].Macedo MCF and Apolinário AL, “Focus plus context visualization based on volume clipping for markerless on-patient medical data visualization,” Comput. Graph, vol. 53, pp. 196–209, Dec. 2015, doi: 10.1016/j.cag.2015.09.007. [DOI] [Google Scholar]
- [4].Drouin S and Collins DL, “PRISM: An open source framework for the interactive design of GPU volume rendering shaders,” PLOS ONE, vol. 13, no. 3, p. e0193636, Mar. 2018, doi: 10.1371/journal.pone.0193636. [DOI] [PMC free article] [PubMed] [Google Scholar]
- [5].Lasso A et al. , “SlicerHeart: An open-source computing platform for cardiac image analysis and modeling,” Front. Cardiovasc. Med, vol. 9, 2022, Accessed: Sep. 06, 2022. [Online]. Available: https://www.frontiersin.org/articles/10.3389/fcvm.2022.886549 [DOI] [PMC free article] [PubMed] [Google Scholar]
- [6].Schulte zu Berge C, Baust M, Kapoor A, and Navab N, “Predicate-Based Focus-and-Context Visualization for 3D Ultrasound,” IEEE Trans. Vis. Comput. Graph, vol. 20, no. 12, pp. 2379–2387, Dec. 2014, doi: 10.1109/TVCG.2014.2346317. [DOI] [PubMed] [Google Scholar]
- [7].Finn S, Glavin M, and Jones E, “Echocardiographic speckle reduction comparison,” IEEE Trans. Ultrason. Ferroelectr. Freq. Control, vol. 58, no. 1, pp. 82–101, Jan. 2011, doi: 10.1109/TUFFC.2011.1776. [DOI] [PubMed] [Google Scholar]
- [8].Straka M et al. , “The VesselGlyph: focus & context visualization in CT-angiography,” in IEEE Visualization 2004, Oct. 2004, pp. 385–392. doi: 10.1109/VISUAL.2004.104. [DOI] [Google Scholar]
- [9].Gasteiger R, Neugebauer M, Beuing O, and Preim B, “The FLOWLENS: A Focus-and-Context Visualization Approach for Exploration of Blood Flow in Cerebral Aneurysms,” IEEE Trans. Vis. Comput. Graph, vol. 17, no. 12, pp. 2183–2192, Dec. 2011, doi: 10.1109/TVCG.2011.243. [DOI] [PubMed] [Google Scholar]
- [10].Umapathi KK and Agasthi P, Atrioventricular Canal Defects. StatPearls Publishing, 2022. Accessed: Mar. 16, 2023. [Online]. Available: https://www.ncbi.nlm.nih.gov/books/NBK557511/ [PubMed] [Google Scholar]
- [11].Olariu I-C et al. , “Challenges in the Surgical Treatment of Atrioventricular Septal Defect in Children With and Without Down Syndrome in Romania-A Developing Country,” Front. Pediatr, vol. 9, 2021, Accessed: Mar. 16, 2023. [Online]. Available: https://www.frontiersin.org/articles/10.3389/fped.2021.612644 [DOI] [PMC free article] [PubMed] [Google Scholar]
- [12].Nam HH et al. , “Simulation of Transcatheter Atrial and Ventricular Septal Defect Device Closure Within Three-Dimensional Echocardiography–Derived Heart Models on Screen and in Virtual Reality,” J. Am. Soc. Echocardiogr, vol. 33, no. 5, Art. no. 5, May 2020, doi: 10.1016/j.echo.2020.01.011. [DOI] [PMC free article] [PubMed] [Google Scholar]


