

Abstract
The availability of computerized knowledge on biochemical pathways in the KEGG database opens new opportunities for developing computational methods to characterize and understand higher level functions of complete genomes. Our approach is based on the concept of graphs; for example, the genome is a graph with genes as nodes and the pathway is another graph with gene products as nodes. We have developed a simple method for graph comparison to identify local similarities, termed correlated clusters, between two graphs, which allows gaps and mismatches of nodes and edges and is especially suitable for detecting biological features. The method was applied to a comparison of the complete genomes of 10 microorganisms and the KEGG metabolic pathways, which revealed, not surprisingly, a tendency for formation of correlated clusters called FRECs (functionally related enzyme clusters). However, this tendency varied considerably depending on the organism. The relative number of enzymes in FRECs was close to 50% for Bacillus subtilis and Escherichia coli, but was <10% for Synechocystis and Saccharomyces cerevisiae. The FRECs collection is reorganized into a collection of ortholog group tables in KEGG, which represents conserved pathway motifs with the information about gene clusters in all the completely sequenced genomes.
INTRODUCTION
The biological function of a nucleic acid or protein molecule is encoded in the linear arrangement of nucleotide or amino acid units. With the accumulation of sequence data in the publicly available databases and with the sophistication of various computational methods, sequence analysis has become an extremely powerful tool to uncover functional properties of these molecules. In general, however, the biological function is a result of many interacting molecules; it cannot be attributed to just a single molecule. The information about molecular interactions is at least as important as the information about individual molecules for the understanding of any biological function. This is especially true for the analysis of complete genome sequences, which requires concurrent prediction of how a set of genes and proteins are networked to make up a functioning biological system.
Although not explicitly stated, traditional molecular biology contains such a systemic view of biological function. In order to understand a specific functional aspect, say metabolism, signal transduction, cell cycle or apoptosis, experiments have been performed not simply to isolate genes and proteins that play key roles, but rather to uncover biological processes —reactions and pathways—involving those genes and proteins. The problem here is that such experimental data and accumulated knowledge are not well computerized and consequently very few computational methods have been developed to analyze reactions and pathways. The sequence databases, such as SWISS-PROT (1), may occasionally contain comments on cellular processes or links to bibliographic databases, but this is in no way comprehensive. Besides, there is a problem of ontology; a function is inherently an attribute of a single sequence or a single molecule. Sequence databases are not suitable for analyzing higher level function, which should be attributed to a network of interacting molecules.
We have been computerizing current knowledge on cellular processes in KEGG (2,3), whose primary objective is to link genomic information with higher level functional information: a functional reconstruction for each genome that has been sequenced. KEGG contains three main databases: PATHWAY for representation of higher order functions in terms of the network of interacting molecules; GENES for the collection of gene catalogs of all the completely sequenced genomes and some partial genomes; and LIGAND (4) for information about chemical compounds, enzyme molecules and enzymatic reactions. Currently the best organized part of the KEGG/PATHWAY database is metabolism, which is represented by about 90 metabolic pathway diagrams. While there have been similar attempts to computerize metabolic pathways, such as in EcoCyc (5) and MPW/WIT (6), the KEGG databases are intended not only for searches and browsing but also for computation of network data.
It is well known that a set of genes for enzymes catalyzing successive reactions in a specific metabolic pathway is sometimes found in an operon in bacterial genomes (7). Although such gene clusters on the chromosome imply common mechanisms of gene regulation, it is still unclear to what extent the correlation is conserved or diversified among different organisms with a wide variety of physiology. In this paper an automatic procedure is presented to extract ‘functionally related enzyme clusters’ (FRECs) based on a new graph comparison algorithm that analyzes physical distance of enzyme genes in the genome and functional relatedness of enzymes in the metabolic pathways. In addition to such a genome–pathway comparison, the algorithm can be applied to other types of comparisons, especially genome–genome comparisons (8). Here we report a comparative analysis of FRECs in 10 microorganisms with complete genome sequences, and the development of KEGG ortholog group tables that extend the FRECs collection to include additional complete genome sequences.
MATERIALS AND METHODS
Databases
The complete genomes were analyzed for 10 microorganisms: the bacteria Escherichia coli (9), Haemophilus influenzae (10), Helicobacter pylori (11), Bacillus subtilis (12), Mycoplasma genitalium (13), Mycoplasma pneumoniae (14) and Synechocystis PCC6803 (15), the archaea Methanococcus jannaschii (16) and Methanobacterium thermoautotrophicum (17) and the eukaryote Saccharomyces cerevisiae (18) (Table 1). They are part of the GENES database in KEGG (http://www.genome.ad.jp/kegg/kegg2.html ). The sequence data and the catalog of genes were taken from the complete genomes section of GenBank (19). The annotation of each gene is maintained in KEGG in a relational database, which contains composite information taken from the original database of each genome project, from the GenBank database and from the SWISS-PROT database (1), as well as additional annotation by KEGG, especially the EC number assignment. The specific organism metabolic pathways are automatically generated in KEGG by matching the EC numbers for the enzyme genes in the genome and the EC numbers for the enzymes in the KEGG reference metabolic pathway diagrams.
Table 1. The numbers of data used for genome–pathway comparisons.
| Category | Species (abbreviation) | Genome |
Pathway |
||
|---|---|---|---|---|---|
| Proteins | Enzymesa | Reactions | Binary relations | ||
| Bacteria | E.coli (Eco) | 4289 | 665 | 761 | 1223 |
| H.influenzae (Hin) | 1709 | 332 | 476 | 690 | |
| H.pylori (Hpy) | 1566 | 220 | 326 | 404 | |
| B.subtilis (Bsu) | 4100 | 466 | 607 | 869 | |
| M.genitalium (Mge) | 480 | 66 | 109 | 116 | |
| M.pneumoniae (Mpn) | 677 | 80 | 118 | 131 | |
| Synechocystis (Syn) | 3168 | 402 | 513 | 697 | |
| Archaea | M.jannaschii (Mja) | 1770 | 257 | 278 | 345 |
| M.thermoautotrophicum (Mth) | 1869 | 330 | 250 | 282 | |
| Eukaryote | S.cerevisiae (Sce) | 6241 | 617 | 574 | 851 |
aThe number of genes coding for the enzymes that appear in the KEGG metabolic pathways.
In KEGG the reference pathway diagrams were first collected from two printed sources (20,21) and continuously modified and updated according to other literature. In addition to such graphical diagrams, an extensive collection of KEGG metabolic pathways is represented in a computable form called the binary relation (22). A binary relation of two enzymes represents two successive reaction steps. In this study, the E.coli metabolic pathway data were examined in detail also using EcoCyc (4) and other references (23–25). The E.coli operon data were taken from the compilation by Blattner et al. (9), which included experimentally confirmed operons as well as predicted ones. We used an enzyme-related subset of their data totaling 118 operons, each of which contains two or more enzyme genes that appear in the E.coli metabolic pathways.
Graph representation
An essential procedure in our analysis is to extract a set of enzymes that catalyze successive reactions in the metabolic pathway and that are encoded in close locations on the chromosome. Such a set of enzymes is termed a FREC. The extraction of FRECs thus requires a comparison of the ordering of genes in the genome and the clustering of enzymes (gene products) in the pathway, which is formulated here as a comparison of two graphs.
Let us consider a labeled, undirected graph G(V,E), where V is a series of named vertices (nodes) and E is a set of edges. In a standard view the metabolic pathway is a graph with chemical compounds as vertices and reactions (enzymes) as edges. Here an alternative view is taken; the metabolic pathway is treated as a graph with enzymes (gene products) as vertices and chemical compounds as edges. Thus, two adjacent vertices representing successive enzymes or reaction steps in the pathway are connected by at least one edge representing a specific chemical compound which is both a substrate of one reaction and a product of the other reaction. For simplicity, all reactions are considered to be reversible; therefore, the metabolic pathway is an undirected graph.
The genome is a one-dimensionally connected graph whose vertices correspond to genes. The sequential order of the genes is defined by the first nucleotide positions of the genes in one strand and the last nucleotide positions of the genes on the complementary strand. Then two adjacent genes on the chromosome are considered to be connected by a single edge, ignoring the direction of transcription. Thus, a double-stranded circular DNA genome is represented as a connected graph in a circular form and a eukaryotic genome with several linear chromosomes is represented as a graph comprised of separately connected subgraphs.
Graph comparison algorithm
To compare two graphs it is necessary to identify corresponding vertices. The correspondences between genes in the genome and gene products (enzymes) in the metabolic pathway are given by matching EC numbers. Then, a list of correspondences between the vertices of the genome and those of the pathway can be regarded as a set of virtual edges that connect the vertices across the two different graphs under consideration. In general, the correspondences can be many-to-many, because an enzyme may catalyze different reactions in the metabolic pathway and a reaction may be catalyzed by a multi-component enzyme complex. Given newly introduced virtual edges (correspondences of nodes), the extraction of a FREC becomes a problem of detecting a cluster of virtual edges formed by clusters of corresponding vertices on both of the graphs, as illustrated in Figure 1. Thus, a FREC is a typical example of a correlated cluster. In order to implement this notion of FRECs, we have developed a heuristic algorithm that compares two graphs with a list of corresponding vertices.
Figure 1.
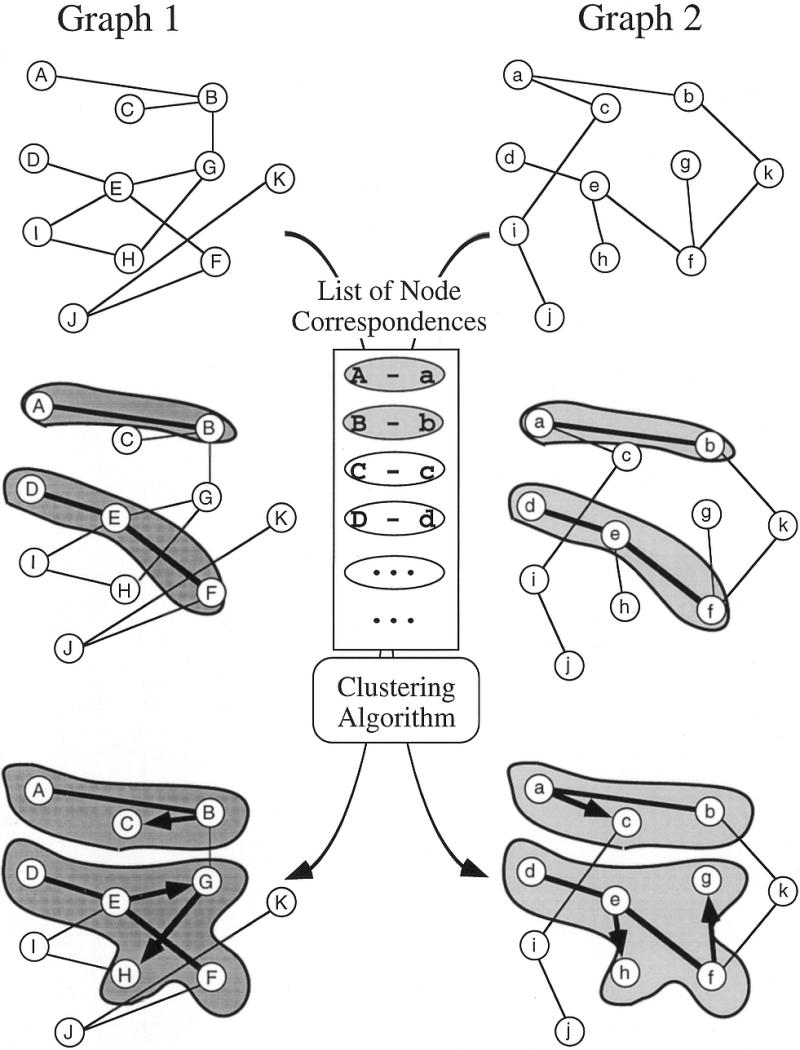
A schematic representation of the graph comparison algorithm to detect correlated clusters or local similarities in two graphs, given a list of correspondences between vertices (nodes) from the two graphs. Initially, each pair of corresponding vertices is a separate cluster. Then similar clusters (shaded) are merged progressively by single linkage with a given measure of similarity.
Consider two graphs, G1(V1,E1) and G2(V2,E2), and a matrix representing the correspondences between V1 and V2. Here V and E denote sets of vertices and edges, respectively, in graph G and n is the number of one-to-one correspondences between V1 and V2. Many-to-many correspondences are decomposed into one-to-one correspondences and stored in different rows of the matrix. Let us first regard each row of the matrix as an individual cluster. Then we obtain n initial clusters. Since an initial cluster i (i = 1, ..., n) is associated with one vertex in one graph, v1i ε V1, and one vertex in the other graph, v2i ε V2, we utilize two measures for the distance between the initial clusters i and j. One, denoted by d1(i,j), is defined as the length of the shortest path between v1i and v1j in graph G1 and the other, denoted by d2(i,j), is defined in the same way in graph G2. Detection of FRECs is achieved by adopting a single linkage clustering algorithm using the following function δ(i,j).
1 if minr,s{d1(r,s)$frac12;r ε Ci,s ε Cj} ≤ 1 + Gap1
and
δ(i,j) = ![]() minr′,s′{d2(r′,s′)$frac12;r′ ε Ci,s′ ε Cj} ≤ 1 + Gap2
minr′,s′{d2(r′,s′)$frac12;r′ ε Ci,s′ ε Cj} ≤ 1 + Gap2
0 otherwise
This represents whether a larger cluster is to be formed by merging clusters Ci and Cj, δ = 1 and 0 representing promotion and prohibition of the merging process, respectively. Here the gap parameters, Gap1 and Gap2, are non-negative integers. For efficiency of computation, the distances d1 and d2 are pre-computed for the two graphs (genome and pathway) from the sets of binary relations. However, it is not necessary to compute the shortest paths for all the pairs of vertices in each graph. A minor modification of the dynamic programming formulation known as the Floyd–Warshall algorithm (26) enables us to compute all pairwise shortest paths that are shorter than or equal to the gap parameter. Our algorithm is implemented in a computer program written in Perl 5.0. The source code, the data used in this study and the results are available at http://kanehisa.kuicr.kyoto-u.ac.jp/Paper/fclust/
Gap parameters and statistical significance
When the genome of a given organism and the entire KEGG metabolic pathway are compared by this algorithm, the resulting clusters that contain two or more enzyme genes are reported as FRECs. The sizes and numbers of FRECs vary depending on the gap parameters utilized. To determine an appropriate set of gap parameters, we examined 15 combinations with values of 0, 1 and 2 for the genome and 0, 1, 2, 3 and 4 for the metabolic pathway. By comparing the obtained FRECs with the E.coli operon data, we empirically chose 1 and 3 for the gap parameters for the genome and pathway, respectively.
The statistical significance of the extracted number of FRECs, N, is examined by comparison against the numbers of FRECs extracted from randomized graphs. The randomization of the graph is carried out by shuffling the vertices without changing the topology (edges) of the graph. The shuffling is performed 100 times to calculate the mean (µ) and the standard deviation (σ) of the number of FRECs. The P value according to Chebyshev’s inequality
P ≤ 1/[($frac12;N – µ$frac12;)/σ]2
is used to estimate the statistical significance of the number of FRECs.
RESULTS
Correspondence of FRECs and operons in E.coli
An example of a FREC in E.coli is shown in Figure 2. Seven enzymes associated with the peptidoglycan biosynthesis pathway are found to be encoded in a gene cluster on the chromosome. The order of the genes on the chromosome does not necessarily correspond to the order of the enzymatic reaction steps in the pathway. Because gaps are allowed in our graph comparison algorithm, a single stretch of a genomic segment is detected containing seven enzyme genes and a non-enzyme gene, ftsW, which is a cell division protein. The genomic segment is likely to be transcribed in a long mRNA which carries 12 genes, including four genes upstream of murE (9).
Figure 2.

An example of E.coli FRECs. Seven enzymes catalyzing successive reaction steps in the peptidoglycan biosynthesis pathway are located in close positions along the E.coli chromosome. Open arrows with dotted lines indicate the correspondences between the enzymes and their genes. While the figure shows a part of the genome that was detected as a FREC, a larger gene cluster associated with membrane structure and cell division proteins is found at this chromosomal location. It consists of 14 genes: the seven enzyme genes and ftsW shown here, two upstream genes (ftsL–ftsI) and four downstream genes (ftsQ–ftsA–ftsZ–lpxC).
The total number of FRECs detected in E.coli was 100, including this example. This number was considerably higher than the expected value estimated by random shuffling experiments (P < 0.005), demonstrating well-organized dispositions of enzyme genes along the E.coli chromosome. The size distribution of FRECs ranges from 2 to 13, as shown in Figure 3, where the size is measured by the number of enzyme genes in a FREC. When each FREC is compared with the assignment of operons by Blattner et al. (9), 89 (89%) out of the 100 FRECs shared at least two enzyme genes with the operons. On the other hand, among the 118 operons that contain two or more enzyme genes, 89 (75.4%) were at least partially detected as FRECs. The number of complete correspondences between the FRECs and known operons was 39. Thus, most of the FRECs found in E.coli contain multiple enzyme genes that are likely to be co-regulated by polycistronic transcription, namely as operons.
Figure 3.

The size distribution of E.coli FRECs. The number of FRECs is plotted against the number of enzyme genes in a FREC for the cases where a FREC is identical to a known or predicted operon (filled bar), a FREC partially overlaps with an operon sharing at least two enzyme genes (shaded bar) and a FREC shares just one gene or does not correspond at all to an operon (open bar).
Tendency for FREC formation in 10 microorganisms
The numbers of FRECs found in 10 microorganisms, including E.coli, are shown in Table 2. All of these numbers exceeded the expected numbers calculated by shuffling experiments. For E.coli, H.influenzae, B.subtilis, M.jannashii and M.thermoautotrophicum the deviations from the expected values were statistically highly significant (P < 0.05). The direction of genes was well conserved within each FREC except for yeast. The ratio of the FRECs comprised of genes all encoded in the same strand was, on average, 93% for bacteria and archaea, ranging from 83% in M.jannaschii to 100% in the two mycoplasmas. In contrast, the ratio for yeast was 44%, which was about the same as the random level (50%).
Table 2. The numbers of FRECs and enzyme genes.
| Species | No. of FRECs | Expected value (mean ± SD) | No. of FRECs on the same strand | No. of enzyme genes in FRECs | Ratio to total no. of enzyme genes |
|---|---|---|---|---|---|
| E.coli | 100 | 23.2 ± 4.5 | 91 | 278 | 0.42 |
| H.influenzae | 46 | 12.9 ± 3.2 | 45 | 117 | 0.35 |
| H.pylori | 13 | 5.4 ± 2.4 | 11 | 39 | 0.18 |
| B.subtilis | 82 | 12 ± 3.2 | 79 | 230 | 0.49 |
| M.genitalium | 7 | 3.4 ± 1.5 | 7 | 17 | 0.26 |
| M.pneumoniae | 11 | 3.5 ± 1.7 | 11 | 27 | 0.34 |
| Synechocystis | 15 | 9.8 ± 3.5 | 14 | 32 | 0.08 |
| M.jannaschii | 23 | 7.4 ± 2.8 | 19 | 72 | 0.28 |
| M.thermoautotrophicum | 41 | 9.7 ± 3.0 | 39 | 207 | 0.37 |
| S.cerevisiae | 16 | 10.9 ± 2.9 | 7 | 34 | 0.06 |
Although it is likely that the number of FRECs reflects the tendency for operon formation in each genome, the number is obviously dependent on the size of the genome and the amount of metabolic pathway data available. For the purpose of excluding the latter effect, we examined the relative abundance of FRECs, which is defined by the ratio of the number of enzyme genes in the FRECs to the total number of enzyme genes that appear in the known metabolic pathway in each organism. As shown in the last column of Table 2, the ratio exhibits considerable variation among organisms; from a smallest value of 6% for yeast, which is expected, to a largest value of 49% for B.subtilis. This variation is also shown in Figure 4.
Figure 4.

The number of enzyme genes in FRECs (filled bar) and the total number of enzyme genes (open bar), together with the ratio of the two, in 10 organisms (see Table 1 for abbreviations).
The smallest value obtained for bacteria and archaea was that of Synechocystis (8%). Since the Synechocystis genome contains a normal proportion of homologous sequences to other bacterial and archaeal sequences (15), the implication of the scarcity of operon structures is intriguing. Tomii and Kanehisa (27) also observed the same tendency based on an analysis of the ATP binding cassette (ABC) transporter family. More than half of the genes for the ATP binding protein components do not form operon structures with the membrane protein components in Synechocystis. The distribution of non-coding spacer regions seems to be consistent with these observations. The proportions of non-coding regions in the E.coli, B.subtilis and Synechocystis genomes are roughly the same: 11, 12 and 13%, respectively. However, the proportion of genes that are separated by more than 100 bases from adjacent genes on the same strand was 43% in Synechocystis, while it was 31 and 32% in E.coli and B.subtilis, respectively. Thus, more genes are likely to be individually regulated in Synechocystis, suggesting the possibility of the existence of regulatory mechanisms that compensate for the dispersion of functionally related genes on the genome. Further computer analyses on regulatory sequences and experimental studies of transcripts and expression profiles are necessary to elucidate regulatory mechanisms in Synechocystis.
Ortholog grouping of enzyme gene clusters
The 10 genome–pathway comparisons identified a total of 354 FRECs (Table 2), which corresponded to a total of 213 metabolic pathway segments, because multiple genomes often share common pathway segments. By taking each of these segments as a reference, it was then possible to superimpose multiple genome–pathway alignments and to obtain a multiple alignment of up to 10 genomes. Such computationally derived alignments were manually refined with additional analyses of sequence similarities and gene orders. Figure 5 shows an example of the resulting alignment for the peptidoglycan biosynthesis pathway, to which nine more complete genomes were manually added. It is interesting to observe that the gene cluster in E.coli (Fig. 2) is completely conserved in H.influenzae and partially conserved in most bacterial species. Note that mycoplasmas do not have this pathway. Furthermore, two adjacent genes in E.coli and H.influenzae are fused into a single gene in Chlamydia trachomatis and Chlamydia pneumoniae. In contrast, the genes are totally dispersed in Synechocystis and Aquifex aeolicus, which is consistent with the observation made in Figure 4.
Figure 5.

The ortholog group table for peptidoglycan biosynthesis. Abbreviations (see also Table 1): Rpr, Rickettsia prowazekii; Mtu, Mycobacterium tuberculosis; Ctr, Chlamydia trachomatis; Cpn, Chlamydia pneumoniae; Bbu, Borrelia burgdorferi; Tpa, Treponema pallidum; Dra, Deinococcus radiodurans; Aae, Aquifex aeolicus; Tma, Thermotoga maritima.
The compilation of related genes in different organisms in the form of Figure 5 is called the ortholog group table in KEGG; examples are listed in Table 3. The ortholog group table often represents a set of genes for a functional unit in various cellular processes, such as a set of enzymes that are required for a specific biosynthetic pathway or a set of subunits that form an enzyme complex (8). Each row of the table shows whether genes are present for the components of the unit and, if they are, whether they are adjacent on the chromosome, which is indicated by the coloring of cells in the table. Each column represents a set of orthologous genes, where the orthologous relation is based not simply on sequence similarity but also on positional correlation of genes on the chromosome. The FRECs alignments for the 10 genomes were extremely useful in organizing the KEGG ortholog group tables for the metabolic pathway. Note, however, that computational alignments based on the matching of EC numbers had to be refined manually by inspecting sequence similarities and gene order alignments (8), because multiple genes often corresponded to the same EC number in an enzyme complex and because the same EC number did not necessarily mean an orthologous relationship. The KEGG ortholog group tables thus obtained generally contain conserved portions of the metabolic pathway, which may be called pathway motifs, and which are likely to be co-regulated at the gene expression level because of the possible operon organization in the genome.
Table 3. Examples of ortholog group tables that correspond to the KEGG metabolic pathway.
| Ortholog group | URL |
|---|---|
| Glycolysis/gluconeogenesis | http://www.genome.ad.jp/kegg/ortholog/tab00010.html |
| Citrate cycle (TCA cycle) | http://www.genome.ad.jp/kegg/ortholog/tab00020.html |
| Fatty acid biosynthesis (path 1) | http://www.genome.ad.jp/kegg/ortholog/tab00061.html |
| Purine metabolism | http://www.genome.ad.jp/kegg/ortholog/tab00230.html |
| Glycine, serine and threonine metabolism | http://www.genome.ad.jp/kegg/ortholog/tab00260.html |
| Valine, leucine and isoleucine biosynthesis | http://www.genome.ad.jp/kegg/ortholog/tab00290.html |
| Lysine biosynthesis | http://www.genome.ad.jp/kegg/ortholog/tab00300.html |
| Histidine metabolism | http://www.genome.ad.jp/kegg/ortholog/tab00340.html |
| Phenylalanine, tyrosine and tryptophan biosynthesis | http://www.genome.ad.jp/kegg/ortholog/tab00400.html |
| Lipopolysaccharide biosynthesis | http://www.genome.ad.jp/kegg/ortholog/tab00540.html |
| Peptidoglycan biosynthesis | http://www.genome.ad.jp/kegg/ortholog/tab00550.html |
| Porphyrin and chlorophyll metabolism | http://www.genome.ad.jp/kegg/ortholog/tab00860.html |
DISCUSSION
As sequence comparison is the most fundamental method for understanding molecular functions encoded in sequence data, graph comparison is expected to become most useful for understanding higher order cellular functions encoded in the network of interacting molecules (28). Sequence comparison identifies the maximal common subsequences, while graph comparison can identify the maximal common subgraphs. The concept of subgraph isomorphism has been applied to protein docking and other problems and is known to be solvable by a clique-finding algorithm (29). However, subgraph isomorphism is, in a sense, a perfect match between two graphs, which may not be of biological relevance. In fact, the power of sequence comparison methods lies in their ability to detect subtle similarities containing mismatches and gaps. Thus, instead of pursuing a rigorous clique-finding algorithm whose computational complexity would be enormous, we have taken a heuristic approach with a different concept of graph similarity.
This is the concept of the correlated cluster, which represents a more relaxed condition of graph similarity and which we think is biologically more relevant than isomorphic subgraphs. In Figure 1, for example, the subgraph with nodes A, B and C is not isomorphic to the subgraph with nodes a, b and c because the edges are different. However, they are identified as a correlated cluster by our graph comparison algorithm, which allows mismatches of edges and gaps in nodes. Because correlated clusters are identified with a less stringent condition, isomorphic subgraphs may then be selected if necessary.
Table 4 shows examples of correlated clusters that can be identified by biological graph comparisons. The genome–pathway comparison detects the correlation of positional coupling of genes on the chromosome and functional coupling of gene products in the pathway, such as FRECs, as reported here. Positional coupling of genes is likely to represent co-regulation of genes, which can be measured directly by gene expression profiling experiments with cDNA microarrays or other methods. Gene expression profile data can be interpreted as a network of expression similarity or a set of co-regulated genes and another type of graph comparison will detect clusters of co-regulated genes that appear as functional clusters in the pathway. In another example, a network of sequence similarity may be compared against the pathway, which will detect possible gene duplication events in the formation of pathways. While these graph comparisons require reference knowledge of pathways, the genome–genome comparison is able to detect conserved clusters of unknown function (8).
Table 4. Correlated clusters that can be identified by biological graph comparisons.
| Graph 1 | Graph 2 | Correspondence of nodes | Correlated cluster |
|---|---|---|---|
| Genome | Pathway | Gene and its product | Genes in an operon coding for functionally correlated proteins (eg. a FREC) |
| Set of expression similarities | Pathway | Gene and its product | Co-regulated genes coding for functionally correlated proteins |
| Set of sequence similarities | Pathway | Same protein | Duplicated genes coding for functionally correlated proteins |
| Set of sequence similarities | Genome | Protein and its gene | Paralogous proteins encoded in nearby positions on the chromosome |
| Genome | Genome | Sequence similarity | Conserved gene cluster |
| Pathway | Pathway | Sequence similarity | Conserved subpathway |
In the standard biochemistry textbooks the metabolic pathway is considered to be a network of chemical compounds. The pathway is drawn as a graph with chemical compounds as nodes and enzymes (reactions) as edges. In contrast, the KEGG metabolic pathway, such as shown in Figure 2, should be viewed as a network of indirect protein–protein interactions, where nodes are proteins (enzymes) and edges are common chemical compounds shared by two successive reactions. This view can be generalized to include other types of protein–protein interactions: direct protein–protein interactions, such as binding and phosphorylation in the signal transduction pathway, and so-called gene regulatory networks, which consist of another class of indirect protein–protein interactions, namely the relations of transcription factors and transcribed proteins. Thus, the generalized protein–protein interaction network (28) consists of direct protein–protein interactions, enzyme–enzyme relations and gene expression relations and it is the basis for computerizing knowledge of metabolic and various regulatory pathways in KEGG.
The correlated clusters detected by graph comparisons represent biological features, or empirical rules, that relate different types of data and knowledge. The generalized protein–protein interaction network is actually an abstract network of gene products, which is especially suited to integrating genomic information with pathway information because direct correspondences of nodes, genes versus gene products, can be made (Table 4). We are currently developing a method for multiple graph comparison to integrate different types of data and knowledge in knowledge-based prediction of cellular functions from the complete genome sequence.
Acknowledgments
ACKNOWLEDGEMENTS
We thank Dr Tatsuya Akutsu for helpful discussions. This work was supported by a Grant-in-Aid for Scientific Research on the Priority Area ‘Genome Science’ from the Ministry of Education, Science, Sports and Culture of Japan and the Genome Frontier Project ‘Genetic and Molecular Networks’ from the Science and Technology Agency of Japan. The computational resource was provided by the Supercomputer Laboratory, Institute for Chemical Research, Kyoto University.
REFERENCES
- 1.Bairoch A. and Apweiler,R. (2000) Nucleic Acids Res., 28, 45–48. [DOI] [PMC free article] [PubMed] [Google Scholar]
- 2.Kanehisa M. (1997) Trends Genet., 13, 375–376. [DOI] [PubMed] [Google Scholar]
- 3.Kanehisa M. and Goto,S. (2000) Nucleic Acids Res., 28, 27–30. [DOI] [PMC free article] [PubMed] [Google Scholar]
- 4.Goto S., Nishioka,T. and Kanehisa,M. (2000) Nucleic Acids Res., 28, 380–382. [DOI] [PMC free article] [PubMed] [Google Scholar]
- 5.Karp P.D., Riley,M., Paley,S.M. and Pelligrini-Toole,A. (1996) Nucleic Acids Res., 24, 32–39. [DOI] [PMC free article] [PubMed] [Google Scholar]
- 6.Selkov E., Galimova,M., Goryanin,I., Gretchkin,Y., Ivanova,N., Komarov,Y., Maltsev,N., Mikhailova,N., Nenashev,V., Overbeek,R., Panyushkina,E., Pronevitch,L. and Selkov,E.,Jr (1997) Nucleic Acids Res., 25, 37–38. [DOI] [PMC free article] [PubMed] [Google Scholar]
- 7.Tamames J., Casari,G., Ouzounis,C. and Valencia,A. (1997) J. Mol. Evol., 44, 66–73. [DOI] [PubMed] [Google Scholar]
- 8.Fujibuchi W., Ogata,H., Matsuda,H. and Kanehisa,M. (2000) Nucleic Acids Res., 28, 4029–4036. [DOI] [PMC free article] [PubMed] [Google Scholar]
- 9.Blattner F.R., Plunkett,G., Bloch,C.A., Perna,N.T., Burland,V., Riley,M., Collado-Vides.J., Glasner,J.D., Rode,C.K., Mayhew,G.F. et al. (1997) Science, 277, 1453–1474. [DOI] [PubMed] [Google Scholar]
- 10.Fleischmann R.D., Adams,M.D., White,O., Clayton,R.A., Kirkness,E.F., Kerlavage,A.R., Bult,C.J., Tomb,J.-F., Dougherty,B.A., Merrick,J.M. et al. (1995) Science, 269, 496–512. [DOI] [PubMed] [Google Scholar]
- 11.Tomb J.-F., White,O., Kerlavage,A.R., Clayton,R.A., Sutton,G.G., Fleischmann,R.D., Ketchum,K.A., Klenk H.P., Gill,S., Dougherty,B.A. et al. (1997) Nature, 388, 539–547. [DOI] [PubMed] [Google Scholar]
- 12.Kunst F., Ogasawara,N., Moszer,I., Albertin,A.M., Alloni,G., Azevedo,V., Bertero,M.G., Bessieres,P., Bolotin,A., Borchert,S. et al. (1997) Nature, 390, 249–256. [DOI] [PubMed] [Google Scholar]
- 13.Fraser C.M., Gocayne,J.D., White,O., Adams,M.D., Clayton,R.A., Fleischmann,R.D., Bult,C.J., Kerlavage,A.R., Sutton,G.G., Kelley,J.M. et al. (1995) Science, 270, 397–403. [DOI] [PubMed] [Google Scholar]
- 14.Himmelreich R., Hilbert,H., Plagens,H., Pirkl,E., Li,B.-C. and Herrmann,R. (1996) Nucleic Acids Res., 24, 4420–4449. [DOI] [PMC free article] [PubMed] [Google Scholar]
- 15.Kaneko T., Sato,S., Kotani,H., Tanaka,A., Asamizu,E., Nakamura,Y., Miyajima,N., Hirosawa,M., Sugiura,M., Sasamoto,S. et al. (1996) DNA Res., 3, 109–136. [DOI] [PubMed] [Google Scholar]
- 16.Bult C.J., White,O., Olsen,G.J., Zhou,L., Fleischmann,R.D., Sutton,G., Blake,J.A., FitzGerald,L.M., Clayton,R.A., Gocayne,J.D. et al. (1996) Science, 273, 1058–1073. [DOI] [PubMed] [Google Scholar]
- 17.Smith D.R., Doucette-Stamm,L.A., Deloughery,C., Lee,H., Dubois,J., Aldredge,T., Bashirzadeh,R., Blakely,D., Cook,R., Gilbert,K. et al. (1997) J. Bacteriol., 179, 7135–7155. [DOI] [PMC free article] [PubMed] [Google Scholar]
- 18.Goffeau A., Aert,R., Agostini-Carbone,M.L., Ahmed,A., Aigle,M., Alberghina,L., Albermann,K., Albers,M., Aldea,M., Alexandraki,D. et al. (1997) Nature, 387 (suppl.), 1–105. [Google Scholar]
- 19.Benson D.A., Boguski,M.S., Lipman,D.J., Ostell,J. and Ouellette,B.F. (1998) Nucleic Acids Res., 26, 1–7. [DOI] [PMC free article] [PubMed] [Google Scholar]
- 20.Nishizuka T. (ed.) (1980) Metabolic Maps (in Japanese). Biochemical Society of Japan, Tokyo, Japan.
- 21.Gerhard M. (ed.) (1992) Biochemical Pathways, 3rd Edn. Boehringer Mannheim, Mannheim, Germany.
- 22.Goto S., Bono,H., Ogata,H., Fujibuchi,W., Nishioka,T. and Kanehisa,M. (1996) Pacific Symposium on Biocomputing ’97. World Scientific, Singapore, Singapore, pp. 175–186. [PubMed]
- 23.Neidhardt F.C., Curtiss,R., Ingraham,J.L., Lin,E.C.C., Low,K.B., Magasanik,B., Rezinkoff,W.S., Riley,M., Schaechter,M. and Umbarger,H.E. (eds) (1996) Escherichia coli and Salmonella: Cellular and Molecular Biology, 2nd Edn. ASM Press, Washington, DC.
- 24.Riley M. (1993) Microbiol. Rev., 57, 862–952. [DOI] [PMC free article] [PubMed] [Google Scholar]
- 25.Riley M. (1997) Nucleic Acids Res., 25, 51–52. [DOI] [PMC free article] [PubMed] [Google Scholar]
- 26.Cormen T.H., Leiserson,C.E., and Rivest,R.L. (eds) (1990) Intrduction to Algorithms. MIT Press, Cambridge, MA.
- 27.Tomii K. and Kanehisa,M. (1998) Genome Res., 8, 1048–1059. [DOI] [PubMed] [Google Scholar]
- 28.Kanehisa M. (2000) Post-genome Informatics. Oxford University Press, Oxford, UK.
- 29.Kuhl F.S., Crippen,G.M. and Friesen,D.K. (1984) J. Comput. Chem., 5, 24–34. [Google Scholar]