

Abstract
Purpose
To describe a summary of the clinical commissioning of the discrete spot scanning proton beam at the Proton Therapy Center, Houston (PTC‐H).
Methods
Discrete spot scanning system is composed of a delivery system (Hitachi ProBeat), an electronic medical record (Mosaiq V 1.5), and a treatment planning system (TPS) (Eclipse V 8.1). Discrete proton pencil beams (spots) are used to deposit dose spot by spot and layer by layer for the proton distal ranges spanning from and over a maximum scan area at the isocenter of . An arbitrarily chosen reference calibration condition has been selected to define the monitor units (MUs). Using radiochromic film and ion chambers, the authors have measured spot positions, the spot sizes in air, depth dose curves, and profiles for proton beams with various energies in water, and studied the linearity of the dose monitors. In addition to dosimetric measurements and TPS modeling, significant efforts were spent in testing information flow and recovery of the delivery system from treatment interruptions.
Results
The main dose monitors have been adjusted such that a specific amount of charge is collected in the monitor chamber corresponding to a single MU, following the IAEA TRS 398 protocol under a specific reference condition. The dose monitor calibration method is based on the absolute dose per MU, which is equivalent to the absolute dose per particle, the approach used by other scanning beam institutions. The full width at half maximum for the spot size in air varies from approximately for for . The measured versus requested 90% depth dose in water agrees to within over ranges of . The beam delivery interlocks perform as expected, guarantying the safe and accurate delivery of the planned dose.
Conclusions
The dosimetric parameters of the discrete spot scanning proton beam have been measured as part of the clinical commissioning program, and the machine is found to function in a safe manner, making it suitable for patient treatment.
Keywords: Radiation therapy equipment, Conformal radiation treatment, Dose‐volume analysis
Keywords: dosimetry, ionisation chambers, proton beams, radiation therapy
Keywords: spot scanning proton beam, clinical commissioning
Keywords: Protons, Calibration, Dosimetry, Magnets, Optical microcavities, Synchrotrons, Medical treatment planning, Magnetic fields, Ionization chambers, Medical imaging
I. INTRODUCTION
Proton pencil beam scanning, with its capability to deliver intensity modulated proton therapy, is a rapidly developing technology. 1 Scanning proton beams offer better conformation of dose without the need for collimators and compensators and possibly lower neutron contamination compared to the passive scattering beam technique. 2 Proton scanning beams can be delivered using different approaches, including dynamic spot scanning, raster scanning, and discrete spot scanning. 3 , 4 , 5 , 6 In dynamic scanning, the beam is scanned continuously across the target volume, while in discrete scanning, the beam is turned off during the change of parameters for the delivery of next spot to a new location. 3
Until recently, proton scanning technology has only been available at one facility, namely, the Paul Scherrer Institute (PSI), in Switzerland. 4 The spot scanning beam at PSI moves only along the lateral direction and is combined with a moving couch. Recently, the clinical characterization of a proton beam continuous uniform scanning system at the Indiana University cyclotron at the Midwest Proton Research Institute (MPRI) in Bloomington, IN, has been described. 5 The MPRI system uses scanning magnets and a range modulator to obtain a uniform field laterally and spread out Bragg peak (SOBP) in depth. The shaping of the beam is achieved using patient specific apertures and range compensators. The development and verification of the Uppsala pulsed scanned proton beam have also been recently reported. 6 This synchrocyclotron based system has a movable second scanning magnet and uses the raster scanning technique.
Proton therapy with discrete spot beam scanning is now being provided at the University of Texas M.D. Anderson Cancer Center Proton Therapy Center, Houston (PTC‐H). A spot can be defined as a burst of monoenergetic protons in a short time segment, as shown in Fig. 1. This delivery system utilizes a rapid change in the proton beam energy (94 different energies total, 64 energies maximum in any one field), which permits dose delivery up to in water. Two dimensional spot scanning in the beam transverse plane enables proton dose deposition in any desired area. Treatments can be delivered without patient specific hardware, namely, apertures, compensators and range shifters, and/or couch motion.
Figure 1.
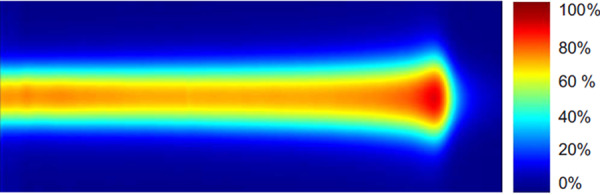
A spot, defined as a burst of monoenergetic protons in a short time segment, deposits dose nonuniformly in a narrow region.
The PTC‐H uses a synchrotron and the Hitachi ProBeat delivery System (Hitachi, Ltd., Tokyo, Japan) with three gantries and two fixed beamlines. 7 One gantry is dedicated to discrete spot beam scanning. Treatment planning is performed using the Varian Eclipse system (Varian Medical Systems, Inc., Palo Alto, CA), while the electronic medical record (EMR) system for spot scanning is provided by Mosaiq (IMPAC Medical Systems, Inc., Sunnyvale, CA). The treatment planning system (TPS), the EMR, and the delivery system must function in a compatible and integrated fashion in order to ensure a safe delivery environment for discrete spot scanning with energies ranging from .
This report describes the clinical commissioning activities of the delivery system. Acceptance testing, the process in which the vendor performs a series of tests to demonstrate that their product meets the contractual specifications, was performed together by personnel from Hitachi and PTC‐H. Clinical commissioning, the process by which a treatment delivery system is characterized to ensure that it will provide safe and accurate treatments, began after the acceptance tests were completed.
II. MATERIALS AND METHODS
The PTC‐H discrete spot scanning delivery system consists of a synchrotron accelerator and scanning beam nozzle, the TPS, and the EMR. In addition, there is an in‐house developed conversion software package, which translates one interpretation of digital imaging and communication in medicine (DICOM) to another interpretation of this standard. In order to deliver treatment plans generated by the TPS, it must be uploaded to the EMR and then downloaded to the scanning beam accelerator control system (ACS), as shown in Fig. 2.
Figure 2.
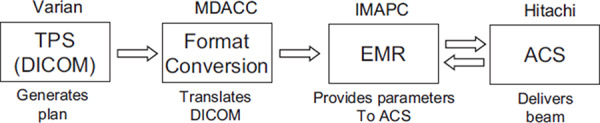
Data flow for patient treatments using discrete spot scanning proton beam at PTC‐H.
Discrete spot scanning is a treatment technique in which the dose is delivered spot by spot in a separate and distinct pattern on a three dimensional grid. In the direction of beam travel, the dose grid is populated by changing the energy of the protons, which requires a new spill from the synchrotron. For the same energy, the location of the spot is controlled by changing the magnetic field strength of the X and Y scanning magnets. In the X‐Y plane, the spot positions can be defined by the user, either using the TPS for clinical cases or creating files manually for physics testing.
Basic issues in the delivery of the discrete spot scanning treatment fields include the confirmation or verification of the range (i.e., the proton energy) of the spot, the location of the spot, and the dose delivered per spot. In addition, in the multivendor environment, it is necessary to ensure that information is transferred with integrity. The commissioning of these aspects is described in the following sections.
II.A. The accelerator system
The synchrotron has been configured to produce 94 separate beam energies for the purposes of spot scanning. Each of the beam energies requires a different spill of the beam from the synchrotron such that there is only one proton energy available with each acceleration cycle. After the protons have been accelerated to the desired energy, they are “spilled” from the synchrotron. The maximum length of time per spill is . After each spill, the beam in the synchrotron is accelerated to the maximum energy and is then decelerated. The deceleration process requires approximately . The accelerating process begins again until the protons reach the required energy. The time between spills is approximately . Before extraction of the beam from the synchrotron, the beam energy is checked by measuring the revolution frequency and the orbit position. Hitachi has determined that the measurement of the beam orbit position in the synchrotron to within assures the proton range uncertainty of less than . In addition, the bending magnet field strength is different for each energy choice. The bending magnet field strength of the final bending magnet in the beam gantry is measured by a Hall probe, which is positioned in the magnetic field. The tolerance for the difference in the actual bending magnet field strength and the expected value before an interlock is activated is , which corresponds to an energy value of approximately .
Each spot is extracted by adding an RF signal to an RF kicker, which “kicks out” protons from the orbit in the synchrotron. Duration of the RF signal is determined by the planned number of monitor units (MUs) for the spot. The RF signal is terminated after the main dose monitor counter reaches the planned number of MUs for the spot. A typical duration time for a spot with the maximum MUs (this limit will be described later) of 0.04, is .
The scanning beam nozzle contains four beam monitors, as shown in Fig. 3. The profile monitor is positioned at the beginning of the nozzle, which is the most upstream location. The beam then passes through the subdose monitor, the main dose monitor and then the spot position monitor. The profile monitor and the spot position monitor are multiwired ionization chambers in which gold coated tungsten wires are used as the signal electrodes. The subdose and main dose monitors are open, air filled parallel plate chambers that use copper coated plastic polymers for the chamber windows, with a bias voltage of .
Figure 3.
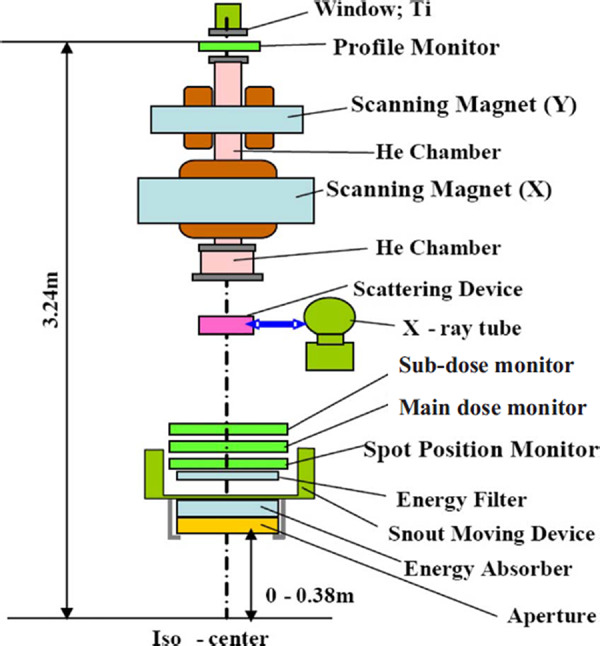
Schematic of the scanning proton beam nozzle of the Hitachi ProBeat machine at PTC‐H.
These same windows, as used in the chambers, are used to seal the helium chamber. The purpose of the helium chamber is to reduce the scattering of the protons, as compared to air. The total water equivalent thickness (WET) of the scanning nozzle is approximately , with the largest contributing component being the almost of air drift space.
II.B. Interlocks
II.B.1. Dose monitor interlocks
A series of tests was performed with the main dose monitor and the subdose monitor. The triax cable of the main dose monitor was disconnected. Next, this test was reversed, namely, the main dose monitor was connected, while subdose monitor was disconnected. Next, the triax cables for both monitors were connected, but there was no high voltage on the main dose monitor. Then the test was reversed, that is, HV was restored to the main dose monitor, but removed from the subdose monitor.
II.B.2. Spot position and profile monitor interlocks
Tests were performed to check spot position monitors. The X and Y channels from the spot position monitor were separately disconnected. Similar tests were performed with the profile monitor.
II.B.3. The minimum and maximum MU interlocks
The minimum value of the MU for any one spot is , while the maximum value is . The upper limit of the spot MUs was established as the maximum dose to be delivered before the location and size of the spot are determined. The upper limit of spot MUs was also necessary to achieve a precise measurement of the spot position and size with the spot position monitor, as the gain setting for the spot position monitor is fixed for each energy layer and too large a dynamic range of the spot dose (MUs) in a layer causes the saturation of output. The minimum MU was established such that the spot dose would be greater than the expected delayed dose, which is the amount dose delivered after the beam spot termination signal sent by the main dose monitor to the RF kicker. Dose at the Bragg peak delivered by a single spot with the maximum MUs per spot of 0.04 is approximately , depending on the energy. The maximum Bragg peak dose occurs approximately at the energy of . The number of protons required for each MU increases with the proton energy increase because the stopping power in air decreases with the proton energy increase. On the other hand, the dose at the pristine Bragg peak for a given number of protons decreases as proton energy increases. Combining these two competing factors, the maximum Bragg peak dose occurs at a specific energy for a given MUs. The minimum and maximum MU interlocks were tested by delivering a series of 2000 spots with MUs per spot from 0.0045 to 0.005 and 250 spots with MUs per spot from 0.040 to 0.044, respectively.
II.B.4. Bending magnetic field interlock
A simple test including two separate runs each containing two energies was performed in the treatment mode (see Sec. II A) to test if the bending magnetic field strength was properly checked by the delivery system. For the first run, normal values of the bending magnet were used. For the second run, a change in the bending magnet field strength was introduced for the second energy.
II.C. Calibration
II.C.1. Definition of charge per MU
The interaction of the protons with the air in the monitor chamber results in the production of ionic charges, which are collected by the chamber. For the scanning nozzle, after have been collected, a count is created by an analog to digital converter in the main dose monitor. The precision of this converter is 1%. The system has been designed such that approximately 10 000 counts are set to be equal to one MU.
A single MU merely represents a certain amount of charge collected by the main dose monitor; its relation to dose distribution depends on the energies and locations of spots. The amount of charge in the main dose monitor, in terms of the number of counts defining a MU, was arbitrarily defined by using the reference conditions for the International Atomic Energy Agency (IAEA) TRS 398 protocol: 8 uniform dose delivered to a volume of water centered at the isocenter using pencil beams with 18 energies between 178.6 and (corresponding to the proton ranges of and a nominal SOBP width of ), a field size, and a total of . Measurements were performed using a water proof Farmer type chamber (PTW‐Freiburg, Freiburg, Germany; model 30013) with an Accredited Dosimetry Calibration Laboratory (ADCL) absorbed dose to water calibration factor for Co‐60 beam. The chamber was positioned both at the isocenter and at a reference depth of leading to a residual range of . The MU must be defined early in the commissioning process as the input depth doses for our treatment planning system are integral depth doses of single spots in units of (see Sec. II G).
II.C.2. Cross calibration of the Bragg peak chamber
To determine the response of the dose monitor for each proton beam energy, we used an 8.2 cm diameter parallel plate chamber, Bragg peak chamber (PTW‐Freiburg, Freiburg, Germany; model 34070) to measure the integral doses of single spots. The Bragg peak chamber has a nominal sensitive volume of (an effective radius of and a thickness of ). The WET of the Bragg peak chamber's front window is . The chamber was designed to measure the location of the Bragg peak in proton beams. This large diameter chamber was intended to capture the complete spot including the scattered protons. The required calibration factor to convert the ionization chamber reading to dose was obtained by performing the cross calibration of this chamber with an ADCL calibrated Farmer type chamber by exposing them to a known dose at the center of SOBP at a residual range of in water from a broad passively scattered proton beam with a range of , a SOBP of , and a field size of .
II.C.3. Dose monitor calibration
The Bragg peak chamber was positioned at a depth of from top of the front surface of a water equivalent phantom. The total effective depth, therefore, is in water. The depth of was chosen to ensure that measurements were made in a low dose gradient region of the pristine Bragg Peak curve for all energies. 21 out of 94 energies were measured using 1250 spots with 0.04 MU per spot (50 MU total) for each energy, spots being centered along the central axis. The measured values in units of at the depth of were interpolated for the other energies that were not measured. The integral depth doses per MU at depths other than were obtained by scaling the integral depth dose generated by Monte Carlo simulation (MCS) using the measured values at the depth of . This measurement established the dose monitor calibration for proton spot beams with different energies. However, it was found that the size of the Bragg peak chamber was not large enough to capture the entire spot even at the depth of , especially for the low energy beams. Correction factors were derived from MCS generated ratios of integral depth doses tallied with a virtual Bragg peak chamber with a radius of to that of .
Our approach of dose monitor calibration based on the absolute dose per MU is different from, but equivalent to, the approach of absolute dose per particle used by other centers for their scanning proton beam. 9 , 10 Their approach relates the collected charge or MUs in the main dose monitor to the number of protons passing through the monitors using Faraday‐cup measurements. In our approach, the number of particles per MU is implicitly determined by the integral dose measurement in depth. Using the mass stopping power at the depth of , the integral dose could be converted into the number of particles.
II.C.4. Validation of dose distribution
The point doses within the volume of the reference condition described in Sec. ??? were measured first to validate the calibration. The ion chamber was positioned at eight different depths, including the center of the volume, along the central axis, ranging from approximately proximal to the center of the volume to distal to the center of the volume, keeping isocenter at the center of the volume. The chamber was also positioned at nine different locations over a range of in a direction perpendicular to the beam. These measurements have been repeated on multiple occasions.
The doses delivered by the treatment fields designed by the TPS for conformal irradiation of prostate target volumes of actual patients are also being measured by ion chamber measurements in a water phantom as part of our patient specific quality assurance (QA) program.
II.D. Dose monitor linearity
The Bragg peak ion chamber was used to study the linearity of the main and subdose monitors together with their electronics for a single spot with MU ranging from the minimum of 0.005 to the maximum of 0.04, at a depth of in a solid water phantom. This test was performed for the minimum and maximum proton energies by varying the MU by a factor of 8. In addition, the same total MUs were delivered using 250 spots, each with , 1000 spots with per spot, and 2000 spots with 0.005 MU per spot to find any difference in measured doses in a phantom.
II.E. Energies, depth doses, and ranges
In order to achieve a “uniform” dose to a volume, it is important to have an appropriately spaced energy selection. In the ranges of , there are 29 different energies available with a layer interval of . The layer interval then increases gradually to different values ranging from with the increase in the spot beam energy. There are 12 different energies, which cover the ranges from . The energy selection reflects the physics of pristine Bragg peaks. The spread of the pristine peak in the depth direction increases as the proton energy increases, as is shown in Fig. 4.
Figure 4.
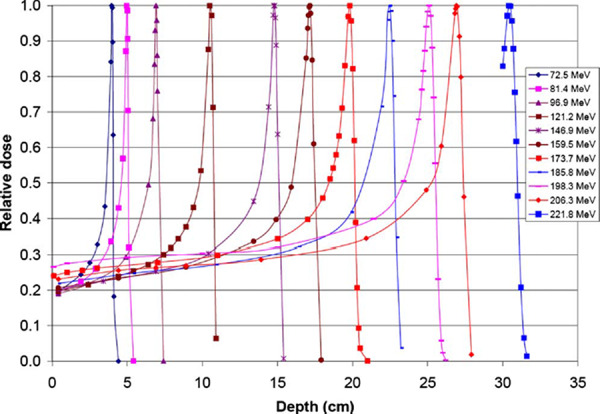
Selected pristine Bragg peaks measured in water using a point by point approach.
The range defined by the 90% isodose distal to the Bragg peak was measured for 11 out of the 94 energies using the Bragg Peak chamber and a point by point measurement technique for a set number of MUs per point. The depth doses and ranges of the following energies (in MeV) were measured: 72.5, 81.4, 96.9, 121.2, 146.9, 159.5, 173.7, 185.8, 198.3, 206.3, and 221.8.
II.F. Spot size and position
The X and Y scanning magnets are located 230.5 and above the isocenter, respectively. Clinical specifications for scanning magnets include precision of the spot location at the isocenter and the time required to travel from one spot location to another location up to a maximum distance of approximately , as the maximum field size is at the isocenter plane. The variation in the magnetic field strength during beam on is within of the maximum current. This is equivalent to within beam position stability at the isocenter. For the higher energy protons, the product of the effective magnet pole length of the scanning magnet times the magnetic field strength results in a velocity. No specific tests were performed to determine the length of time required for the spot to move from one location to another in a layer or plane.
After an individual spot is delivered, the beam is interrupted and the location of that spot is calculated from signals from the profile monitor and the spot position monitor. The spot can then move to the next planned position. The time required to deliver one spot is between 1 and , depending on the MU prescribed for the spot among other variables. The beam off time to calculate the spot position and to set the scanning magnets for the next spot is typically . The tolerance limit for spot location discrepancy is for energies higher than and is increased to up to for energies less than . If the difference between the measured and programmed locations of the center of the spot is more than the tolerance limit, the ACS terminates the treatment.
Due to beam optics and accelerator characteristics, the spot is neither circular nor symmetric in the transverse XY plane. A spot can be characterized, at least in part, by measuring its full width at half maximum (FWHM) in air and at various depths in water. Such measurements were performed using both radiochromic film (Gafchromic EBT Film, International Specialty Products, Wayne, NJ) and a diameter pin point ion chamber (PTW‐Freiberg, Freiberg, Germany; model 31014). These measurements were made at least at two different gantry angles for a wide range of beam energies.
The precision and stability of beam position were established using radiochromic films irradiated by different spot patterns as a part of clinical commissioning. A five‐spot pattern with one spot located at the central ray and other four at lateral to the central ray was studied with the gantry at five different angles, which were approximately at 45° apart.
II.G. Treatment planning system
Varian Eclipse, version V.8.1 was the TPS during commissioning. The details regarding the commissioning of the spot scanning beam in the TPS will be reported in a forthcoming publication. Only a brief description is presented here. The required input data include in‐air single spot lateral profiles in the in‐plane and cross‐plane directions at typically five positions above and below the isocenter plane and the integral depth dose in of a single spot for each of the available proton energies.
The input data were obtained using validated MCS (mcnpx 2.5.0). The MCS was validated both by matching the simulated and measured lateral profiles in air and in water and by comparing the depth doses for 11 different energies in water. The details of Monte Carlo validation will be published elsewhere. The lateral profiles at the nozzle entrance ( upstream of the isocenter) were used to achieve agreement to within 2% between MCS and measurements at the isocenter. The worst distance to agreement between MCS and measurements was . To validate the MCS generated integral depth doses, we used a virtual Bragg peak chamber with the radius of , matching the effective radius of the physical Bragg peak chamber. For TPS input data, the integral depth doses were generated by MCS using the virtual Bragg peak chamber with radius and normalized by the measured values in units of , corrected by MCS generated correction factors at the depth of .
For the delivery of required dose to a volume using the scanning beam, the TPS determines the number of energies, the spot locations, and MUs per spot. The patient specific treatment plan is exported from the TPS in DICOM format and uploaded to the EMR through an in‐house conversion software module. This software is necessary because of an important difference in the interpretation of the number of control points in the DICOM standard used in the TPS and the delivery systems: The TPS provides a control point before and after each energy change and the delivery system is expecting a control point only at the beginning of each energy change. The conversion software was developed to edit out the second control point for each energy change and to renumber all of the remaining control points. This software module was tested to ensure that the TPS planned irradiations could be delivered as expected.
For a typical prostate plan, spots of approximately 20 different energies are used, which require at least 20 different spills to deliver approximately 1600 spots. The highest energy beam in a prostate plan generally delivers a small number of spots, e.g., 10, to a very limited number of locations, e.g., 2–3. Depending on the patient, the third or fourth highest energy beam delivers the largest number of spots, e.g., 150, to a modest number of locations, e.g., 14. Thus, the planned dose is delivered spot by spot to the target volume.
II.H. Electronic medical record
IMPAC's Mosaiq, Version 1.5, is the EMR system which interfaces with both the spot scanning and the passively scattering proton beam lines. Prior to the first treatment, the patient specific fields must first be delivered in the quality assurance mode of EMR with the ACS in the treatment mode. This action not only permits QA measurements to be performed but also results in the required bending magnet field strengths, which are not provided by the TPS, being uploaded from the ACS to the EMR. When the ACS is in treatment mode for the scanning beam, the treatment parameters are downloaded from the EMR, the treatment is delivered, and the number of MUs and number of spots delivered is uploaded from the ACS to the EMR for record keeping and verification.
An important feature of the EMR is its ability to recover and to deliver the remaining treatment in the event of a failure of either the treatment delivery system or the EMR system, as the entire spot pattern must be delivered to treat the target with the prescribed dose. This recovery was tested by deliberately causing failures both in the delivery system and in the EMR. After a failure, the number of spots delivered was verified. The number of remaining spots was determined and these spots were then delivered. One test is to exposure three films sequentially. The first film was irradiated with a normal complete treatment. The second and third films were exposed together to the first part of treatment, followed by a beam abortion. The second film was then removed, while the third film remains in place. After recovery, the remainder of the treatment is then delivered to the third film. The films were then scanned and the dose distributions were compared.
Patient images are managed by the EMR with an option for acquisition of “setup” x‐ray images to locate the isocenter in the patient before beam delivery. There are three different x‐ray systems with flat panel detectors available for on the treatment table patient imaging, namely, one is located in the nozzle, one is in the gantry located 90° from the nozzle, and the third one is stationary, which can image along the axis of rotation of the gantry. Setup images are acquired daily to compare against digitally reconstructed radiographs generated by the TPS for precise patient positioning. Apertures are not used. Thus, there are no portal images, which are usually acquired to display the treatment field shape on the patient's anatomy.
II.I. Scanning beam delivery
The ProBeat delivery system can be operated in three different modes, namely, treatment, physics, and service. Treatment mode is generally run in conjunction with the EMR system, which supplies the specific values for individual parameters required by the scanning beam control system. Physics mode is used to perform physics program development, machine QA, and patient specific QA activities. In physics mode, the user must load a control point file, a different control point is required for each energy selection, and a spot position file, which contains information on all of the spots with different energies to be delivered. Among other parameters, the control point file contains the control point number, the number of spots to be delivered at this control point, the proton beam energy (one energy per control point), the relative weight for this control point (the sum of the relative weights must be 1.0 when summed over all control points and is used only for reference), and the value of the magnetic field strength of the final bending magnet. The spot position file contains the spot number for each spot, the X and Y position of each spot at the isocenter plane, and the relative weight for that spot (the sum of the relative weights must be 1.0 when summed over all spots). In addition, the spot position files contain the MUs for each spot, but these are not used directly and are only used for reference. The total number of MUs is entered at the treatment console in the physics and service modes, whereas it is supplied by the EMR in the treatment mode. The MU for each spot is the product of the total MU times the relative weight for that spot. In the physics mode, dose for a treatment plan can be scaled as long as the spots are within the deliverable constraints plus the tolerance (see Sec. ???). In the treatment mode, this scaling is not allowed. Service mode is only available to service personnel and has a substantially reduced number of interlocks.
The system is designed to provide patient safety by limiting the maximum MUs that can be delivered by any one spot to a very small value, namely, . It is possible, however, to deliver a large number of spots to the same physical location, one spot at a time (repeated spots). To treat a volume, the spots with highest proton energy are delivered first. Then the spots with the second highest energy are delivered next and the beam delivery continues in this order to the spots with the lowest energy. For each beam energy selection, it is possible to repeat (repaint) the spots or the spot pattern, as required by the desired dose distribution. For a uniform dose pattern, the highest energy is repeated, the largest number of times with the number of repeats decreasing to a single painting as the energy decreases to its lowest value.
Commissioning a discrete spot scanning beam treatment delivery system involves measuring discrete spots of protons both in air and in water. Measurements include single spot measurements, single plane measurements of various field sizes (which involve single energy spots), and volume measurements (which involve spots with multiple energies). Control point files and spot position files need to be generated for every measurement. The user cannot manually enter the parameters for a measurement in the control system. For physics Mode, such files can be generated manually and read from digital memory. For treatment Mode, such files must be calculated in the TPS, uploaded to the EMR, and then downloaded to the ACS.
III. RESULTS
III.A. Interlocks
III.A.1. Dose monitor interlocks
Dose monitor interlock tests revealed that only one spot with would be delivered when the main or subdose monitor was not functioning properly, either being disconnected or has no HV bias.
III.A.2. Spot position and profile monitor interlocks
When there was a problem in spot position or profile monitor, only one spot with would be delivered before the system paused due to the activation of the spot position and size interlocks.
III.A.3. The minimum and maximum and minimum MU interlocks
The unit delivered dose when programmed for greater than 0.00465 and less than per spot. For MUs less than 0.00466 or greater than or more per spot, an error message was received stating that the spot main dose value was out of range and the data could not be sent to the controller indicating the proper activation of MUs per spot interlock with a tolerance of 0.00035 and for the minimum and maximum MU interlocks, respectively. The TPS is configured to the vendor stated limits of 0.005 and as the minimum and maximum MU per spot, respectively.
III.A.4. Bending magnetic field interlock
A simple two energy and two separate run test was performed in the treatment mode. For the first run, the system completed the delivery as expected. The beam position for the second energy was then modified by slightly changing the bending magnet field strength. For the second run, the first energy was delivered, but after the first spot of the second energy was delivered, the system paused with an interlock. The system registered and displayed an error message indicating that the difference between the programmed position of the spot and the actual position of the spot is outside the acceptable tolerance.
III.B. Calibration
III.B.1. Definition of charge per MU
Under the reference condition used to define the charge per MU for the main dose monitor, the dose at the center of the volume at the isocenter was found to be within of the expected value of .
III.B.2. Cross calibration of the Bragg peak chamber
The calibration factor was determined through three separate intercomparison measurements to be, , where is the product of colablt‐60 calibration factor in water and the beam quality factor.
III.B.3. Dose monitor calibration
Shown in Fig. 5 is the measured integral dose of single spots using the Bragg peak chamber at the depth of as a function of energy. Also displayed in this figure are the correction factors determined by MCS and the corrected integral depth dose. These correction factors range from 1.01 to 1.14.
Figure 5.
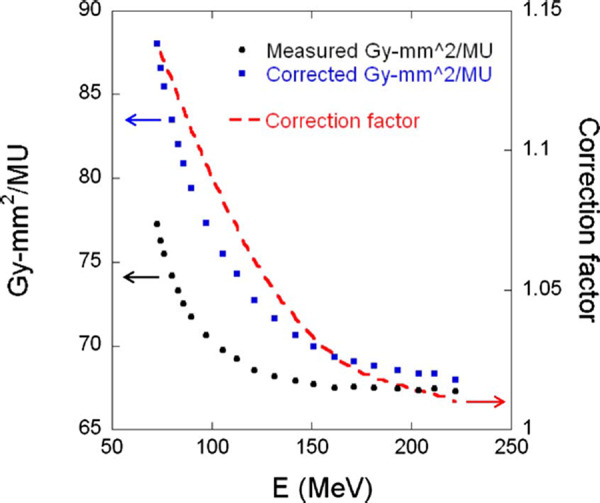
Integral doses in at the depth of as a function of energy. Circles are measured integral doses; squares are corrected integral doses; and dashed line is the correction factors.
III.B.4. Validation of dose distribution
The doses measured at eight different depths in the reference volume along the central axis, were found to be within . The doses measured at nine different locations in a direction perpendicular to the beam were found to be within . It was concluded that the measurements did not have a strong dependence on the position of the chamber within the uniform dose volume. Repeated measurements indicate that the results were within the experimental error. The measured dose has been confirmed by the Radiological Physics Center (RPC) using thermoluminescence dosimeters within .
For prostate patients, the agreement between the planned and the measured dose in the flat region of the depth dose curve (spread out Bragg peak) was found to be within 3% for all the patients treated so far at our facility. The details of our patient specific QA program for the spot scanned beam will be reported in a future publication.
III.C. Dose monitor linearity
The MU linearity measured by the Bragg Peak chamber is displayed in Fig. 6. For , the reading for a single spot is approximately with a standard deviation of 2%–4%. It was found that for the scanning beam, the monitor system is linear and the error introduced by the interruption of the beam after a small MU has been delivered is negligible. For , the interpolated latent charge for the proton beam is , while for the proton beam, it is .
Figure 6.
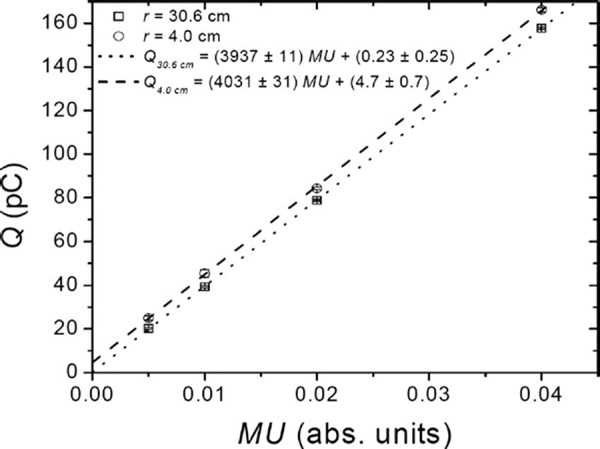
Linearity of the response of the main dose monitor over the range of MUs permitted by the system for 221.8 and proton beams with range of 30.6 and in water, respectively.
Relative to the per spot measurement, the dose delivered was within 0.5% when the per spot was used and within 1.2% when the per spot was used. The conclusion of these measurements is that for a typical treatment the allowed range of MUs per spot will introduce an error of less than 1.0%.
III.D. Energies, depth doses, and ranges
The measured depth dose curves for 11 out of the 94 energies are shown in Fig. 4. The agreement between the measured and the acceptance test values (not shown in the figure), as measured by Hitachi, of the distal 90% ranges was within . The number of depth dose curves measured was limited to 11 due to the required time and due to the fact that the depth curves for all 94 energies have already been measured during the acceptance testing.
III.E. Spot size and position
The spot size in terms of FWHM of the single spot in air varies with proton energy, as shown in Fig. 7, ranging from approximately for the beam to approximately for the beam. The in‐plane half lateral profiles in air for 72.5, 148.8, and beams are shown in Fig. 8. The FWHM of spot profiles in water depends on the depth of the measurement, with a larger FWHM at the Bragg peak depth as compared to an entrance depth due to multiple Coulomb scattering of the protons in the spot. Examples of in‐plane half lateral dose profiles of single spot beams measured in water at different depths for 72.5, 148.8 and are shown in Fig. 9.
Figure 7.
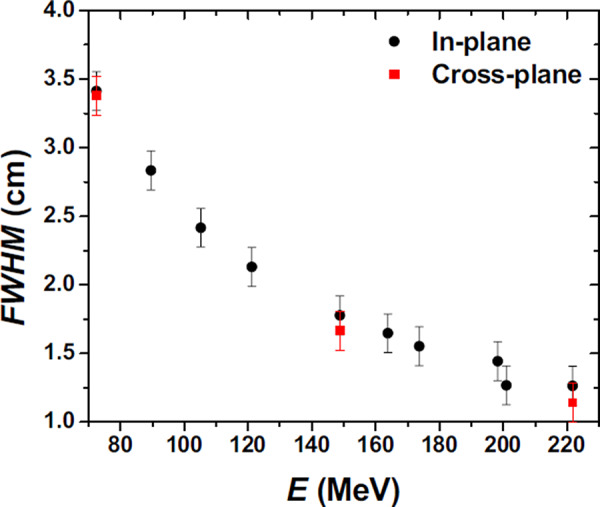
FWHM of lateral profiles in air of single pencil beams at the isocenter plane as function of proton nominal energy .
Figure 8.
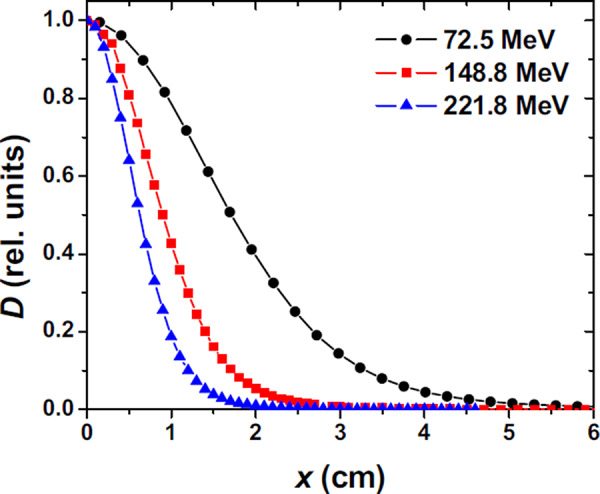
In‐plane half lateral profiles of single pencil beams at isocenter plane in air for 72.5, 148.8, and energies. Measurements were performed with a cylindrical ionization chamber (model 31014, PTW‐Freiburg, Freiburg, Germany).
Figure 9.
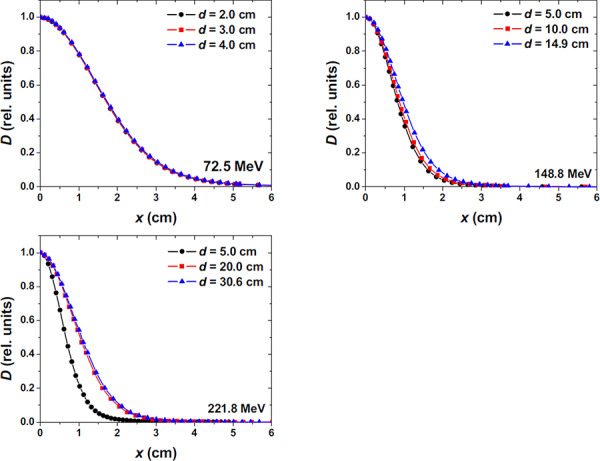
In‐plane half lateral profile of single pencil beams measured in water for 72.5, 148.8, and . The surface of the water was placed at the isocenter plane.
Comparing the spot characteristics (dose and spot shape) between the spot at the central ray and a spot located away laterally from the central ray at one gantry position obtained by using radiochromic films, no differences were observed. It was also found from radiochromic film measurements that the change in the center of the spot positions relative to the central ray over the gantry angles studied was less than . An example of film measurements of spot positions is shown in Fig. 10.
Figure 10.
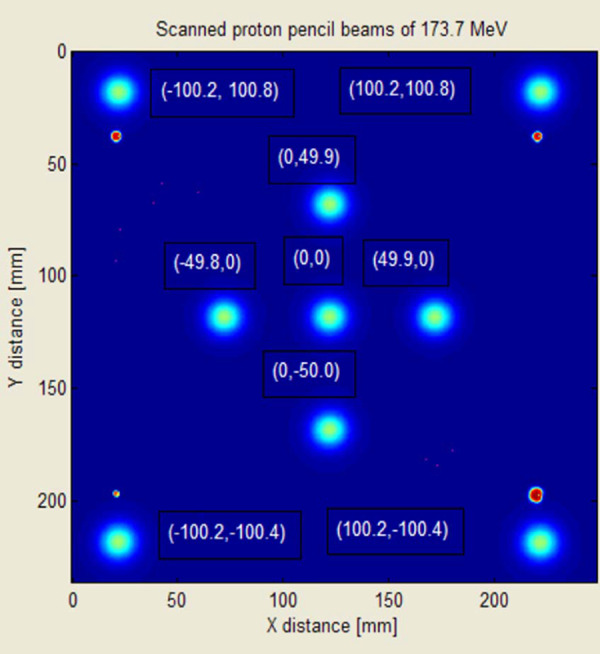
Example of spot position measurements using radiochromic films.
III.F. EMR: Recovery from interruptions during treatment
Tests were run to determine recovery from the EMR when the delivery system fails. It was concluded from these tests that the recovery is correct to within one spot. Tests were also performed to confirm the correct recovery from EMR hardware failure. After the EMR hardware is restored, and the parameters delivered before the failure (MUs and total number of spots) were manually entered into the EMR, the resulting delivered spots were found to be valid to within one spot of the planned treatment. In the three‐film experiment, the second film clearly indicated partial treatment and the difference between the first (normal delivery) and the third (partial delivery plus remaining treatment delivered after recovery) films was minimal, i.e., differences in the dose delivered was less than 1%.
IV. DISCUSSION
The system was functioning as designed, namely, the system would cease treatment delivery after a single spot was delivered if one of the four in‐line monitors discovered an issue.
The process of calibration consists of three major steps, definition of charge per MU, cross calibration of the Bragg peak chamber, and dose monitor calibration. The definition of charge per MU for the main dose monitors merely defines the amount of charges collected by the monitor corresponding to a single MU based on an arbitrary configuration of spots and energies. Since our planning system requires the Bragg curves in terms of dose per MU, the configuration of reference conditions for defining charge per MU needs to be set early in the commissioning process.
The dose monitor calibration for scanning beams is established through the measurements of integral doses with the Bragg peak chamber at the depth of . It is evident that the Bragg peak chamber is not large enough to capture all of the protons, especially for low energy spots. MCS was used to derive the correction factors. Alternative approach without using MCS is being investigated and will be the subject of a forthcoming publication. For the highest energy, the spot size is small and the correction for the detector size is only 1% at the depth of . For the low energies at the depth of , the spot size becomes large and the correction is close to 14%, as shown in Fig. 5. For depths at the pristine Bragg peaks, the correction factors would be much larger than that at . The radial size of the Bragg peak chamber is not large enough for measured integral depth doses to be used as the input data for the TPS. Instead, we used MCS calculated integral depth doses using the virtual Bragg peak chamber with a radius of normalized by the corrected measured integral dose at the depth of . Our approach based on absolute dose per MU is equivalent to the approach based on absolute dose per particle used by other institutes. 9 , 10
The MU constraint in terms of the maximum MU for each spot is one of the important safety features of the delivery system. There is also a constraint in the minimum MU for each spot to be delivered due to the delayed dose. We have confirmed that the linearity of dose delivered within the range of MU limits for each spot is within 1%.
There are interesting limitations to the system, including the choice of 94 energies with defined increments between them. It is not clear that all 94 energies are required to produce a uniform dose volume, especially for the lower proton energies. The fact that only 64 energies can be delivered in one field, due to limitations in memory of the synchrotron magnet pattern controller, is not a major issue because all 94 energies can be delivered using two separate fields. Treatment to shallow depths, i.e., less than , will require the manual installation of a range shifter, also called energy absorber, and possibly the use of higher energy beams, depending on the thickness of the range shifter. The insertion of such a device means that the operator may have to enter the treatment room between fields.
Spot position accuracy is one of the most important parameters to be confirmed for the scanning beam delivery system. An effective QA program to ensure this accuracy is critically important. The delivery system must also have the ability to resume treatment in the event of interruption due to interlocks on the machines and/or EMR system. We have implemented QA procedures to check the spot position accuracy and have verified the recovery of the system from any hardware and software failure to resume the planned treatment.
V. CONCLUSIONS
A multivendor proton discrete spot scanning system, which consists of a TPS, an EMR, and a delivery unit, has been commissioned and is in daily use. Over 150 prostate patients have been treated to date. The delivery system has proven to be stable with respect to the total dose delivered to a volume and spot locations. No significant variation in output or spot pattern as a function of gantry angle has been observed. It is possible to recover when the system aborts and deliver the remaining MUs. This is very important in discrete spot scanning to ensure that the entire treatment volume is treated as planned. In this treatment delivery approach, failure to deliver all the MUs would result in an underdosing of the proximal portion of the target volume.
Significant work remains with this system, as not all treatment options have been commissioned, including energy absorbers and energy filters. In addition, the value of using apertures to improve the penumbra characteristics will be explored. The initial clinical work has been limited to simple pelvic treatments, as experience is gained with this new treatment approach.
0094‐2405/2010/37(1)/154/10/$30.00
REFERENCES
- 1. Lomax A. J., Boehringer T., Coray A., Egger E., Goitein G., Grossmann M., Juelke P., Lin S., Pedroni E., Rohrer B., Roser W., Rossi B., Siegenthaler B., Stadelmann O., Stauble H., Vetter C., and Wisser L., “Intensity modulated proton therapy: A clinical example,” Med. Phys. 28, 317–324 (2001). [DOI] [PubMed] [Google Scholar]
- 2. Koehler A. M., Schneider R. J., and Sisterson J. M., “Range modulators for protons and heavy ions,” Nucl. Instrum. Methods 131, 437–440 (1975). [Google Scholar]
- 3. Paganetti H. and Bortfeld T., in New Technologies in Radiation Oncology, edited by Schlegel T. B. W. and Grosu A. L. (Springer‐Verlag, Berlin, 2006), p. 345. [Google Scholar]
- 4. Pedroni E., Bacher R., Blattmann H., Böhringer T., Coray A., Lomax A. J., Lin S., Munkel G., Scheib S., Schneider U., and Tourovsky A., “The proton therapy project at the Paul Scherrer Institute: Conceptual design and practical realization,” Med. Phys. 22, 37–53 (1995). [DOI] [PubMed] [Google Scholar]
- 5. Farr J. B., Mascia A. E., Hsi W. C., Allgower C. E., Jesseph F., Schreuder A. N., Wolanski M., Nichiporov D. F., and Anferov V., “Clinical characterization of a proton beam continuous uniform scanning system with dose layer stacking,” Med. Phys. 35, 4945–4954 (2008). [DOI] [PMC free article] [PubMed] [Google Scholar]
- 6. Tilly N., Grusell E., Kimstrand P., Lorin S., Gajewski K., Pettersson M., Backlund A., and Glimelius B., “Development and verification of the pulsed scanned proton beam at The Svedbery Laboratory in Uppsala,” Phys. Med. Biol. 52, 2741–2754 (2007). [DOI] [PubMed] [Google Scholar]
- 7. Smith A., Gillin M. T., Bues M., Zhu X. R., Suzuki K., Mohan R., Woo S., Lee A., Komaki R., and Cox J., “The M. D. Anderson proton therapy system,” Med. Phys. 36, 4068–4083 (2009). [DOI] [PubMed] [Google Scholar]
- 8. Andreo P., Burns D. T., Hohfeld K., Huq M. S., Kanai T., Laitano F., Smyth V. G., and Vynckier S., “Absorbed dose determination in external beam radiotherapy: An international code of practice for dosimetry based on standards of absorbed dose to water,” IAEA Technical Report Series No. 398 (IAEA, Vienna, 2000).
- 9. Pedroni E., Scheib S., Böhringer T., Coray A., Grossmann M., Lin S., and Lomax A., “Experimental characterization and physical modeling of the dose distribution of scanned proton pencil beams,” Phys. Med. Biol. 50, 541–561 (2005). [DOI] [PubMed] [Google Scholar]
- 10. Lorin S., Grusell E., Tilly N., and Medin J., “Reference dosimetry in a scanned pulsed proton beam using ionisation chambers and a Faraday cup,” Phys. Med. Biol. 53, 3519–3529 (2008). [DOI] [PubMed] [Google Scholar]