

Error description
In our study (Deist et al. 20181) we collected 12 datasets from previous studies on post‐radiotherapy outcomes (e.g., survival, toxicity etc.). The dataset outcomes were modelled with 6 classifiers using the other dataset parameters. In 1 out of 12 datasets we incorrectly identified the outcome parameter column. The manuscript needs minor updates in text and updates for all figures for correctness, but the overall conclusion remains completely unchanged.
The dataset in question (set E in the published manuscript) concerned non‐small cell lung cancer patients and the correct outcome was 2‐year overall survival. However, we incorrectly built prediction models using vital status at last follow‐up as the outcome.
The effects on the manuscript are described below, followed by an erratum list. Additionally, an updated version of the manuscript (with Track Changes) is provided as a supplementary file.
Effects on manuscript
The effects on the results are negligible and the conclusion remains completely unchanged. However, minor updates throughout the manuscript are necessary for correctness.
The erroneous processing of the dataset (originally set E) has been corrected and the analysis as described in the manuscript has been repeated. For this dataset this means that 500 new models have been generated in the experiment (5 folds * 100 repetitions), resulting in updated performance metrics for this set.
In the manuscript we describe individual and aggregate results over all datasets and therefore several numbers in text and tables, and all figures need updating. Additionally, since we order the anonymized sets based on discrimination performance the erroneously processed set (originally set E) is now labelled set I, consequently causing changes in the labels of the other sets as well.
With the correct outcome being modelled, the Areas Under the Curve (AUCs) drop for all classifiers for the dataset in question. Random forest (rf) remains the best ranking classifier, and elastic net logistic regression (glmnet) still ranks second. The ranking of the other 4 classifiers is now different for this dataset.
In the published manuscript, we reported best classification performance across 12 datasets for rf and glmnet. This conclusion remains unchanged after the corrigendum. No effect on the median ranking of the other classifiers is observed, but the interquartile ranges have changed slightly as illustrated in the updated scatter‐boxplot below.
Furthermore, since we report results on a large number of datasets the effect of the erroneous processing of one dataset is limited, which is a confirmation of the robustness of the analysis performed and reported in the manuscript.
Corrections to article text
| Page number, column (left, abstract, right), full paragraph number | Section | Original | Corrected |
|---|---|---|---|
| 3450, A, 2 | Abstract | We collected 12 datasets (3496 patients) … | We collected 12 datasets (3484 patients) … |
| 3450, A, 3 | … with an average AUC rank improvement of 0.42 and 0.66, respectively. | … with an average AUC rank improvement of 0.52 and 0.65, respectively. | |
| 3451, L, 4 | Material and Methods | Twelve datasets (3496 patients) with treatment outcomes described in previous studies … | Twelve datasets (3484 patients) with treatment outcomes described in previous studies … |
| 3455, L, 1 | Results | … empty decision trees for particular sets (for 34%, 19%, 68%, 35%, 58% of all outer folds for sets D, E, G, K, L, respectively). | … empty decision trees for particular sets (34%, 67%, 35%, 58% of all outer folds for sets D, F, K, L, respectively). |
| 3455, L, 2 | … and the low pairwise comparison percentages (between 57% and 91% in Fig. 3) … | … and the low pairwise comparison percentages (between 57% and 88% in Fig. 3) … | |
| 3455, R, 2 | … e.g., nnet outperforms rf in sets H, J, and K, and svmRadial outperformed glmnet in sets A and C. | … e.g., nnet outperforms rf in sets G, J, and K, and svmRadial outperformed glmnet in sets A and C. | |
| 3455, R, 5 | … the AUC improvement ranges between ‐0.02 and 0.06 with a mean of 0.02. | … the AUC improvement ranges between ‐0.01 and 0.07 with a mean of 0.02. | |
| 3455, R, 5 | The AUC rank improves by 0.42 on average. | The AUC rank improves by 0.52 on average. | |
| 3455, R, 5 | … and improves the rank, on average, by 0.66. | … and improves the rank, on average, by 0.65. | |
| 3457, L, 2 | Discussion | … the average AUC rank for rf is only slightly better than for glmnet (2.28 for rf and 2.43 for glmnet; … | … the average AUC rank for rf is only slightly better than for glmnet (2.29 for rf and 2.45 for glmnet; … |
| 3457, L, 2 | A similar behavior is observed for sets C and E but not in sets D, F, I, … | A similar behavior is observed for set I but not in sets C, D, E, H, … |
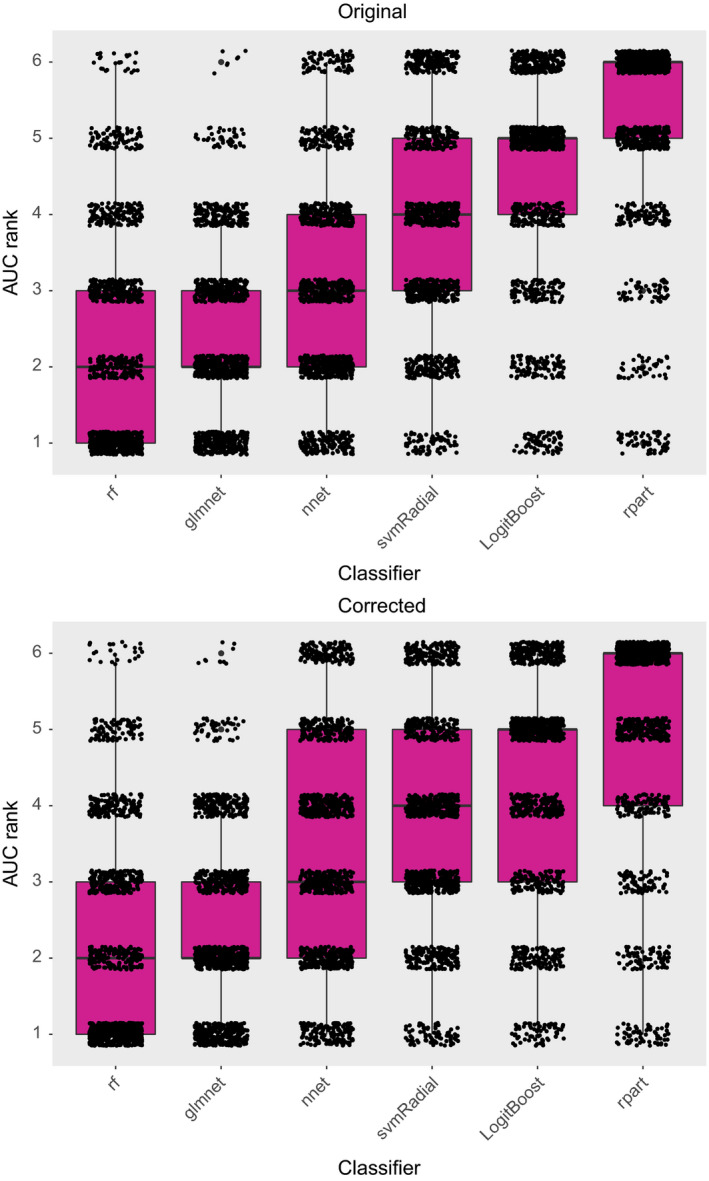
Figure 2. [Color figure can be viewed at wileyonlinelibrary.com]
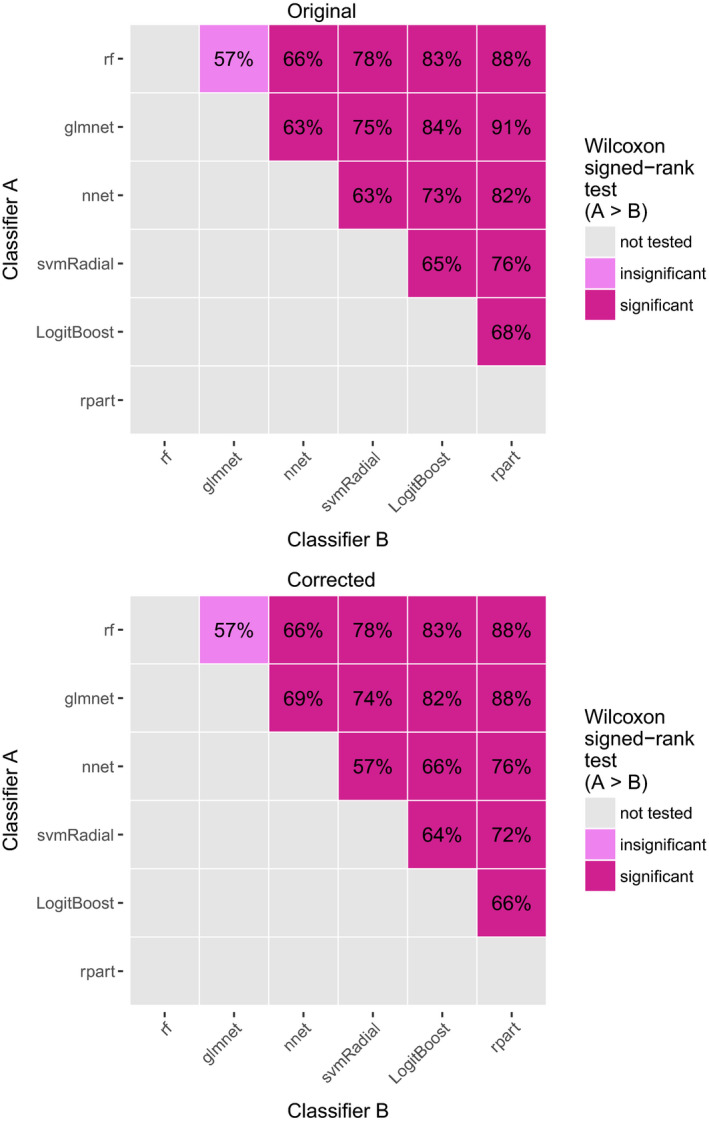
Figure 3. Original [Color figure can be viewed at wileyonlinelibrary.com]
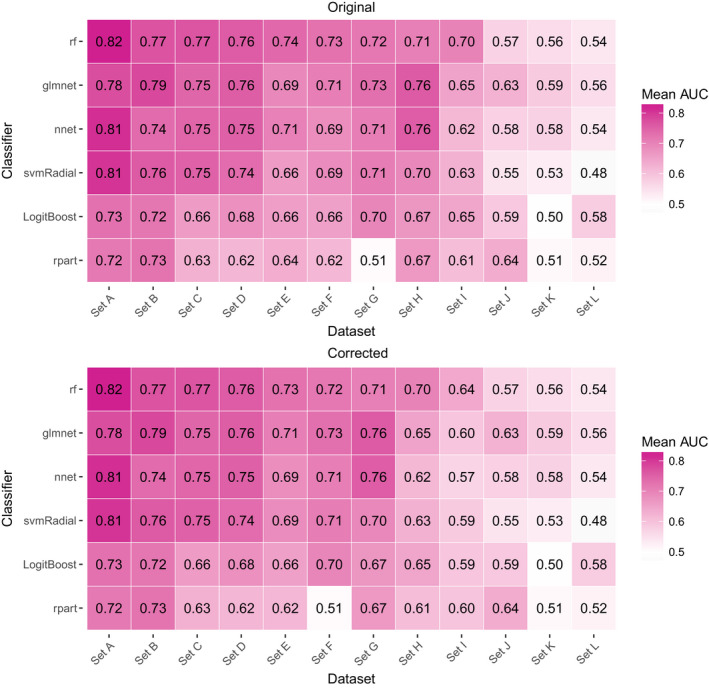
Figure 4*. [Color figure can be viewed at wileyonlinelibrary.com]
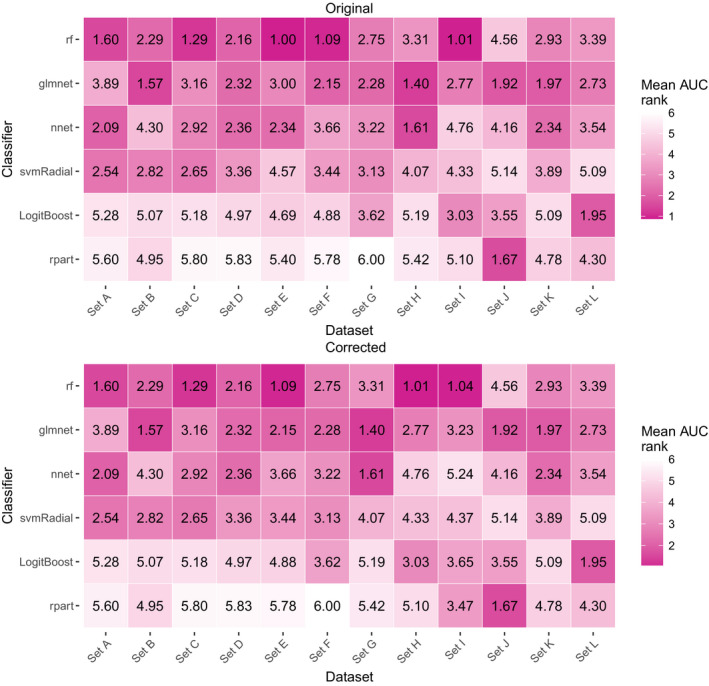
Figure. 5*. [Color figure can be viewed at wileyonlinelibrary.com]
*Since we order the anonymized sets based on discrimination performance the erroneously processed set (originally set E) is now labelled set I, consequently causing changes in the labels of the other sets as well.
Table I. Corrected
| Dataset | Disease | Outcome | Prevalence (in %) | Patients | Features | Feature types | Source |
|---|---|---|---|---|---|---|---|
| … | |||||||
| Oberije et al. (2015)18 | Non‐small cell lung cancer | 2‐year overall survival | 1736 | 548536 | 20 | Clinical, dosimetric | Public19 |
| … |
Table III. Original
| Dataset | Random classifier | Pre‐selected classifier | Set‐specific classifier | |||||
|---|---|---|---|---|---|---|---|---|
| Rank | Name | Rank | AUC | Rank | AUC | |||
| Mean | Mean | Increase | Increase | Mean | Increase | Increase | ||
| Set A | 3.59 | glmnet | 3.64 | −0.05 | 0.00 | 3.10 | 0.49 | 0.02 |
| Set B | 3.48 | rf | 2.92 | 0.56 | 0.02 | 3.31 | 0.17 | 0.01 |
| Set C | 3.50 | glmnet | 3.12 | 0.37 | 0.03 | 2.78 | 0.72 | 0.03 |
| Set D | 3.57 | rf | 2.60 | 0.97 | 0.04 | 3.31 | 0.26 | 0.02 |
| Set E | 3.53 | glmnet | 3.35 | 0.18 | 0.01 | 1.75 | 1.78 | 0.05 |
| Set F | 3.39 | rf | 1.89 | 1.50 | 0.04 | 2.58 | 0.81 | 0.03 |
| Set G | 3.47 | rf | 2.99 | 0.47 | 0.04 | 3.52 | ‐0.06 | 0.01 |
| Set H | 3.44 | rf | 3.81 | ‐0.37 | 0.00 | 1.70 | 1.74 | 0.05 |
| Set I | 3.45 | rf | 1.59 | 1.86 | 0.06 | 1.72 | 1.73 | 0.05 |
| Set J | 3.52 | rf | 4.18 | −0.66 | ‐0.02 | 3.41 | 0.11 | 0.00 |
| Set K | 3.50 | rf | 3.33 | 0.16 | 0.01 | 3.20 | 0.30 | 0.01 |
| Set L | 3.58 | rf | 3.50 | 0.08 | 0.01 | 3.66 | ‐0.08 | 0.00 |
| Mean | 3.50 | 3.08 | 0.42 | 0.02* | 2.84 | 0.66 | 0.02* | |
Table III. Corrected
| Dataset | Random classifier | Pre‐selected classifier | Set‐specific classifier | |||||
|---|---|---|---|---|---|---|---|---|
| Rank | Name | Rank | AUC | Rank | AUC | |||
| Mean | Mean | Increase | Increase | Mean | Increase | Increase | ||
| Set A | 3.43 | glmnet | 3.64 | −0.21 | 0.00 | 3.10 | 0.33 | 0.02 |
| Set B | 3.44 | rf | 2.92 | 0.52 | 0.02 | 3.31 | 0.13 | 0.00 |
| Set C | 3.49 | rf | 1.94 | 1.55 | 0.05 | 2.78 | 0.71 | 0.03 |
| Set D | 3.59 | rf | 2.60 | 0.99 | 0.05 | 3.31 | 0.28 | 0.02 |
| Set E | 3.53 | rf | 1.89 | 1.63 | 0.05 | 2.58 | 0.94 | 0.03 |
| Set F | 3.57 | rf | 2.99 | 0.58 | 0.04 | 3.52 | 0.05 | 0.01 |
| Set G | 3.43 | rf | 3.81 | −0.39 | 0.00 | 1.70 | 1.73 | 0.05 |
| Set H | 3.65 | rf | 1.59 | 2.06 | 0.07 | 1.71 | 1.93 | 0.06 |
| Set I | 3.49 | glmnet | 3.50 | 0.00 | 0.00 | 2.08 | 1.42 | 0.03 |
| Set J | 3.52 | rf | 4.18 | −0.67 | −0.01 | 3.41 | 0.11 | 0.01 |
| Set K | 3.59 | rf | 3.33 | 0.26 | 0.02 | 3.20 | 0.39 | 0.02 |
| Set L | 3.44 | rf | 3.50 | −0.06 | 0.00 | 3.66 | −0.22 | −0.01 |
| Mean | 3.51 | 2.99 | 0.52 | 0.02* | 2.86 | 0.65 | 0.02* | |
Table AI. Original
| Classifier | AUC | Brier score | Accuracy | Cohen's kappa | Calibration intercept error | Calibration slope error |
|---|---|---|---|---|---|---|
| rf | 0.72 | 0.17 | 0.72 | 0.10 | 0.12 | 0.37 |
| glmnet | 0.72 | 0.18 | 0.72 | 0.14 | 0.26 | 0.68 |
| nnet | 0.71 | 0.21 | 0.69 | 0.11 | 0.36 | 0.96 |
| svmRadial | 0.69 | 0.18 | 0.72 | 0.06 | 0.26 | 0.86 |
| LogitBoost | 0.66 | 0.23 | 0.68 | 0.18 | 0.22 | 0.60 |
| rpart | 0.63 | 0.20 | 0.71 | 0.16 | 0.21 | 0.56 |
Table AI. Corrected
| Classifier | AUC | Brier score | Accuracy | Cohen's kappa | Calibration intercept error | Calibration slope error |
|---|---|---|---|---|---|---|
| rf | 0.71 | 0.19 | 0.70 | 0.14 | 0.12 | 0.38 |
| glmnet | 0.71 | 0.20 | 0.70 | 0.14 | 0.26 | 0.66 |
| nnet | 0.69 | 0.22 | 0.67 | 0.11 | 0.31 | 0.87 |
| svmRadial | 0.69 | 0.19 | 0.70 | 0.06 | 0.32 | 0.82 |
| LogitBoost | 0.66 | 0.24 | 0.66 | 0.18 | 0.24 | 0.60 |
| rpart | 0.62 | 0.23 | 0.67 | 0.17 | 0.22 | 0.55 |
Supporting information
Data S1. Updated manuscript with Track Changes.
Note
Abbreviations: L = left column, A = abstract column, R = right column.
References
- 1. Deist TM, Dankers FJWM, Valdes G, et al. Machine learning algorithms for outcome prediction in (chemo)radiotherapy: an empirical comparison of classifiers. Med Phys. 2018;45:3449–3459. [DOI] [PMC free article] [PubMed] [Google Scholar]
Associated Data
This section collects any data citations, data availability statements, or supplementary materials included in this article.
Supplementary Materials
Data S1. Updated manuscript with Track Changes.