

Abstract
Background
In the era of modern medicine, where high‐throughput sequencing techniques are readily available, it is desirable to elucidate the role of genetic background in patients with Parkinson's Disease (PD) undergoing Deep Brain Stimulation (DBS). Genetic stratification of PD patients undergoing DBS may assist in patient selection and prediction of clinical outcomes and complement existing selection procedures such as levodopa challenge testing.
Objective
To capture a broad spectrum of motor and non‐motor DBS outcomes in genetic PD patients with data from the recently updated literature.
Methods
A multi‐scale meta‐analysis with 380 genetic PD cases was conducted using the Cochrane Review Manager, JASP software and R.
Results
This meta‐analysis revealed that overall, patients with genetic PD are good candidates for DBS but the outcomes might differ depending on the presence of specific mutations. PRKN carriers benefited the most regarding motor function, daily dose medication and motor complications. However, GBA carriers appeared to be more prone to cognitive decline after subthalamic nucleus DBS accompanied by a low quality of life with variable severity depending on genetic variants and concomitant alterations in other genes. Apart from GBA, cognitive worsening was also observed in SNCA carriers. Pre‐operative levodopa responsiveness and a younger age of onset are associated with a favorable motor outcome.
Conclusion
A personalized approach with a variant‐based risk stratification within the emerging field of surgicogenomics is needed. Integration of polygenic risk scores in clinical‐decision making should be encouraged.
Keywords: deep brain stimulation, genetic Parkinson's disease, motor outcome, non‐motor outcome, surgicogenomics
Deep brain stimulation (DBS) has been established in the management of Parkinson's disease (PD) in case of poor response to traditional dopamine‐based therapies. Although pharmacotherapy is the mainstay in the treatment of PD, there are patients suffering from medication‐refractory tremor or debilitating levodopa side effects such as motor fluctuations and dyskinesias. In these instances, DBS represents an alternative therapeutic strategy. Proper patient selection is paramount for successful DBS outcome and necessitates the identification of outcome predictors to refine clinical decision‐making.
Based on the available evidence to date, good candidates for DBS are younger patients with a satisfactory levodopa response but without (or with few) axial symptoms and optimally, without cognitive and psychiatric symptoms. 1 , 2 Albeit useful as a guidance, these criteria are not exhaustive and the surgical indication should be examined on a case‐by‐case basis. In this context, the influence of genetics on DBS outcome has become a topic of intense investigation as genetic markers can potentially be useful to predict the outcome more reliably. In the era of modern medicine, where high‐throughput sequencing techniques are readily available, the need to elucidate the role of genetic background in DBS response is more imperative than ever before.
The most important genes that have been related to genetic forms of PD comprise LRRK2, GBA, PRKN, SNCA, PINK‐1, DJ‐1 and VPS35. 3 , 4 Across genetic PD (gPD) forms, there are differences in terms of pathophysiology as well as clinical manifestations and efforts are being undertaken to establish genotype‐driven therapeutic approaches. 5 , 6 With regard to DBS, it still remains obscure if the genetic make‐up can indeed have an impact on the outcome. Finding the answer is cumbersome due to the low number of mutant carriers, given that gPD comprises 5–10% of total PD cases. 7 Hence, evidence synthesis is of particular importance to address this question.
In preceding reviews a rather descriptive analysis was performed and robust conclusions could not be drawn. 8 , 9 , 10 One study solely implemented a quantitative approach focusing on DBS of the subthalamic nucleus (STN‐DBS) 11 and pointed towards comparable results in carriers of LRRK2, GBA, PRKN and idiopathic PD (iPD) cases. Nevertheless, the gene panel was restricted to these three common genes. Apart from the motor outcome, pharmacological and cognitive sequelae were also addressed. Yet, the quantitative synthesis was only performed with the motor and pharmacological data.
There are also other facets like depression, functional ability and quality of life that have not been adequately discussed previously and it is critical to compare both motor and non‐motor outcomes across a wide‐ranging genetic scope. Here, we sought to examine these points within a meta‐analysis framework with data from the recently updated literature. The objective was to investigate the motor and non‐motor DBS outcomes among carriers of genetic alterations in PD‐related genes and divulge DBS outcome predictors in the gPD population.
Methods
The meta‐analysis was conducted according to the Preferred Reporting Items for Systematic reviews and Meta‐Analyses (PRISMA) 12 and the Meta‐analysis of Observational Studies in Epidemiology (MOOSE) reporting guidelines. 13
Search Strategy
The literature research was performed using the electronic databases PubMed (MEDLINE), CINAHL and Cochrane Library from inception through July 2023. Only papers published in the English language were considered. The detailed search strategy can be found in Fig. S1. The reference lists of relevant articles were screened to identify additional citations.
Eligibility Criteria
The fundamental prerequisite for studies to be eligible for inclusion was reporting of the outcome in patients with gPD that underwent DBS. At least one motor or non‐motor outcome had to be reported. Other device‐aided PD therapies like continuous subcutaneous apomorphine infusion or levodopa‐carbidopa gastrointestinal gel were excluded. Randomized and non‐randomized trials which compared patients with gPD and iPD had to document the outcomes or provide sufficient data so that the mean estimates for the gPD group could be deduced. Case series, case reports and letters to the editors were included, if they provided individual patient data for gPD cases in conjunction with DBS outcomes. Systematic reviews and meta‐analyses were excluded. The follow‐up period after the DBS procedure had to be at least 6 months. Clinical diagnosis of PD was a requirement for inclusion and cases of clinically probable PD or atypical parkinsonism without clinically established PD diagnosis were not eligible. The motor outcome in the Unified Parkinson's Disease Scale (UPDRS) Parts II and III as well as the Hoehn and Yahr stage (HY) had to be reported in the off medication state, both pre‐ and post‐operatively. There were no restrictions in the anatomical target of DBS or the genes and genetic variants examined. Novel genome‐wide association studies (GWAS) variants were also encompassed.
Study Selection and Data Extraction
The study selection was performed by the first author (E.A.) and reviewed by the senior ones (G.X. and C.S.). Duplicate or irrelevant publications were excluded and the full text of relevant papers was reviewed. If multiple publications from the same author or the same institution were identified, the most recent paper was included. The following data were extracted from each study: authors and year of publication, total number of patients, mean age, PD‐associated gene(s), number of mutation carriers and controls, types of genetic alterations and genetic variants, age at disease onset, disease duration until surgery, gender, family history, initial symptom, elapsing time between disease onset and occurrence of dyskinesias, DBS target, scales of assessment for motor and non‐motor DBS outcomes, the corresponding pre‐DBS and post‐DBS scores for each scale, follow‐up period and post‐surgical complications, if available. If the study reported the motor outcome using the MDS‐UPDRS III scale, the conversion to the equivalent UPDRS III value was done with the method suggested by Hentz et al. 14 When individual patient data was provided, Mattis dementia rating scale (MDRS) and Mini‐Mental state examination (MMSE) scores were converted to Montreal Cognitive Assessment (MoCA) scores. 15
Assessment of Risk of Bias and Quality of Evidence
The risk of bias on the outcome level was evaluated using the Newcastle–Ottawa Quality Assessment Scale for non‐randomized studies 16 and the quality assessment tool suggested by Murad et al for case series and case reports. 17 Individual appraisals were afterwards discussed, and the quality assessment was finalized.
Statistical Analysis
Two types of analysis were performed: the first one with group‐level data and the second one with individual patient data. The principal summary measure was the difference in the means between the pre‐ and post‐surgical scores of assessment scales in the group‐data analysis and the difference between the pre‐ and post‐DBS scores for each patient in the individual‐data analysis. For group‐level data, the estimates were synthesized using the Cochrane Review Manager (Revman) software. 18 In all cases, the post‐DBS score was subtracted from the pre‐DBS score. A random‐effects model was applied. Clinical and methodological heterogeneity were appraised both qualitatively and quantitatively by computing the Tau2, Chi2 and I 2 estimates. Publication bias was assessed with funnel plots. The mean differences between the pre‐ and post‐surgical stage were compared and ordered across carriers of genetic mutations.
For individual patient data, gene‐level and variant‐level analyses as well as an outcome predictor analysis through linear regression and correlations were undertaken. The normality of the data was checked with the Shapiro–Wilk test, and Pearson's or Spearman's rank correlation coefficients and corresponding P‐values were calculated. Comparisons between two groups were performed with t‐tests/Mann–Whitney tests for independent samples and with the Wilcoxon singed rank test for paired data. The effect size was given by Cohen's d for normally distributed data and by the rank biserial correlation in case of non‐normal distribution. The 95% Confidence Intervals (95% CI) were also estimated. Equality of variance was checked with Levene's test and multicollinearity with the Variance Inflation Factor (VIF) and Tolerance. Dataset distribution was evaluated with Q‐Q plots. If a study reported the outcome in several follow‐up evaluations, the combined mean and standard deviation of the estimates at different time points was calculated using the formula for combining means, as suggested in the Cochrane Handbook. 19 This formula was applied in all cases when combining means across studies was essential. If a study reported the median values and the interquartile range, they were transformed to the equivalent mean value and standard deviation according to the methodology proposed by Wan et al. 20 Statistical analyses and visualization were performed using the JASP software and the ggplot2, ggpubr, Hmisc and corrplot packages of R. The level of significance was set at 0.05 (two‐tailed). In case of multiple comparisons, the level of significance was adjusted with the Bonferroni correction.
Results
Genetic and Clinical Data
A total of 41 studies with 380 patients with gPD were ultimately included in the meta‐analysis. 21 , 22 , 23 , 24 , 25 , 26 , 27 , 28 , 29 , 30 , 31 , 32 , 33 , 34 , 35 , 36 , 37 , 38 , 39 , 40 , 41 , 42 , 43 , 44 , 45 , 46 , 47 , 48 , 49 , 50 , 51 , 52 , 53 , 54 , 55 , 56 , 57 , 58 , 59 , 60 , 61 Individual patient data was available for 49 mutation carriers. The flow‐chart for study selection can be found in Fig. S1. All included studies with demographic and clinical data are displayed in Table S1 and S2. The mean follow‐up was 2.4 years. Overall, the quality of included studies was satisfactory and no study had high risk of bias (Tables S3 and S4). There were not any indications for publication bias based on inspection of the funnel plots (Fig. S2). Despite the fact that several genes and scales were analyzed, the baseline characteristics did not differ substantially apart from the fact that PRKN carriers had a younger age of disease onset.
Group‐Level Data
Order of the Means across Genetic Groups and Assessment Scales
We first addressed the question, if carriers of distinct PD‐associated genetic alterations differed from one another in terms of DBS outcomes. To this, the cumulative mean difference of the pre‐ and post‐DBS outcomes for each gene, whenever it was possible, was calculated. Because the individual patient values were not available, statistical estimates could not be derived and therefore, the intergroup comparisons were visualized in dot charts (Fig. 1). Although the significance of differences could not be quantified, inspection of the dot charts revealed that patients harboring PRKN mutations had the best motor outcome (UPDRS II, III), the most prominent reduction in the total daily medication (Levodopa equivalent daily dose, LEDD), less severe motor complications (UPDRS IV) and were more independent in their daily life (Schwab and England scale, SE). However, they had the worst outcome in non‐motor aspects of daily living (UPDRS I). The worst motor outcome (UPDRS III) was found in carriers of the GWAS variant rs3802920 in the IGSF9B gene on top of SNCA. Total daily medication was reduced to a lesser extent in SNCA carriers, who had a relatively poor motor outcome (UPDRS II and III) and experienced more motor fluctuations (UPDRS IV). Importantly, GBA carriers had the worst cognitive outcome based on the MDRS, although this was not reflected when cognitive decline was assessed with the MMSE, whereby similar results across three genetic groups were found. GBA carriers had a good motor and pharmacological outcome, but exhibited the worst outcome in terms of quality of life (39‐Item Parkinson's Disease Questionnaire, PDQ‐39). Finally, LRRK2 carriers had favorable outcomes in non‐motor activities of daily life and motor and pharmacological end‐points, the best cognitive outcome and the most prominent improvement of depressive symptoms.
FIG. 1.

Dot charts of intergroup comparisons across assessment scales in gPD patients. The x‐axis depicts the mean change in points (preDBS‐postDBS score) for each assessment scale in different genes. A positive value means that the pre‐DBS score is higher than the post‐DBS score, whereas a negative value means that the preDBS score is lower than the post‐DBS score. Guidance is provided regarding the designation of the mean change as improvement or deterioration with a box under each graph, since in a subset of scales higher values correspond to a worse clinical outcome and vice versa. In particular, in UPDRS (I, II, III, IV), LEDD, HY, MADRS and PDQ‐39, a higher score corresponds to a worse outcome and accordingly, a positive mean difference (preDBS‐postDBS score) indicates improvement. The higher the value of a positive mean difference, the most prominent is the improvement. On the other side, in SE, MMSE and MDRS, a higher score denotes a better outcome. Consequently, a positive mean difference (preDBS‐postDBS score) indicates a deterioration, while a negative mean difference points to an improvement. Higher values of a negative mean difference suggest a more notable improvement. gPD, genetic Parkinson's disease; HY, Hoehn and Yahr stage; LEDD, levodopa equivalent daily dosage; MADRS, montgomery‐asberg depression rating scalel; MDRS, mattis dementia rating scale; MMSE, mini mental state examination; PDQ‐39, 39‐item Parkinson's disease questionnaire; SE, Schwab and England quality of life scale; UPDRS, unified Parkinson's disease rating scale.
Individual patient data
Individual patient data was available for 49 gPD patients. Demographic, genetic and clinical data for those patients are displayed in Table S5.
Gene‐Level Analysis
The pre‐ and post‐surgical scores for each carrier of a genetic mutation across reported scales are charted in the paired line plots in Fig. 2. The overall efficacy of DBS in carriers of PD‐related genes is depicted with box plots (Fig. 3) comparing the mean pre‐ and post‐DBS score to evaluate the extent of improvement or deterioration and its statistical significance. A statistically significant improvement following DBS in gPD patients was observed for UPDRS II (P = 0.0033), UPDRS III (P < 0.001), UPDRS IV (P = 0.014) and LEDD (P < 0.001). Nonetheless, a significant deterioration in the MoCA scale (P = 0.0024) was noted in the individual patient dataset, which was driven by the SNCA carriers.
FIG. 2.

Paired line plots showing the pre‐ and post‐DBS scores in distinct assessment scales. The paired line plots display the direction and the magnitude of the change after DBS for each carrier of a genetic alteration in a gene, whereby each gene is marked with a different color. BDI, beck depression inventory; gPD, monogenic Parkinson's disease; HY, Hoehn and Yahr stage; LEDD, levodopa equivalent daily dosage; MoCA, montreal cognitive assessment; PDQ‐39, 39‐item Parkinson's disease questionnaire; SE, Schwab and England quality of life scale; UPDRS, unified Parkinson's disease rating scale.
FIG. 3.
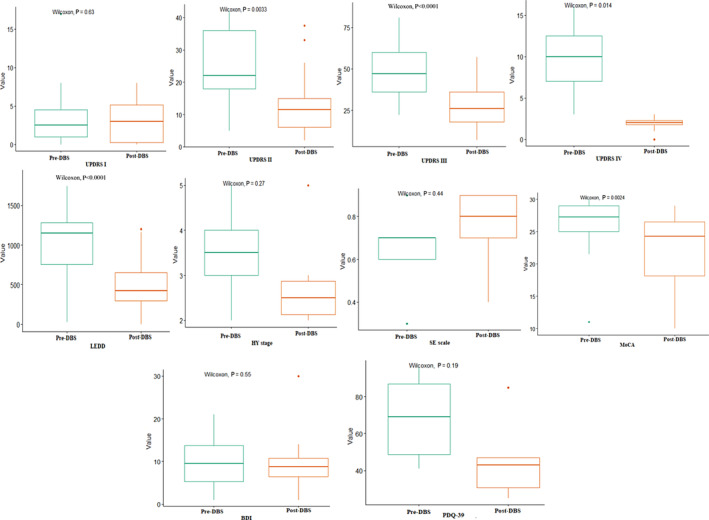
Box plots showing the pre‐ and post‐DBS scores in distinct assessment scales. The box plots depict the mean pre‐DBS and post‐DBS scores for the whole genetic PD cohort based on available individual patient data to examine in which outcomes a statistically significant change (improvement or deterioration) was observed after DBS with Wilcoxon tests. BDI, beck depression inventory; gPD, monogenic Parkinson's disease; HY, Hoehn and Yahr stage; LEDD, levodopa equivalent daily dosage; MoCA, montreal cognitive assessment; PDQ‐39, 39‐item Parkinson's disease questionnaire; SE, Schwab and England quality of life scale; UPDRS, unified Parkinson's disease rating scale.
Variant‐Level Analysis
The gene‐level analysis pointed towards variable results across carriers of mutated genes within the same scale. Then, we queried whether differential effects were in conjunction with distinct underlying genetic variants and structural rearrangements. Since the data for each single variant were insufficient for synthesis, lollipop plots (Fig. 4) were constructed to illustrate the direction (improvement or deterioration) and the magnitude of the outcome for each scale. Collectively, it seems that carriers of different single nucleotide polymorphisms or frameshift mutations mainly differ in the magnitude but not in the direction of the outcome. In other words, in most of the cases, carriers of the same mutated gene had consistently either an improved or worsened outcome but the extent of the improvement or deterioration varied.
FIG. 4.

Lollipop plots illustrating the direction (improvement or deterioration) and the magnitude of the outcome for each scale for each genetic variant or structural rearrangement. The x‐axis depicts the change in points in each assessment scale following DBS (preDBS‐postDBS). Each green dot designates a patient with the specific variant and is outlined with black. Multiple green dots on the same red bar signify that more than one patient carry this variant and the number of the carriers (n) is indicated next to each rod. The position where each dot is located on the red bar indicates the points of change in the scale under examination, as shown on the x‐axis for this specific patient. In UPDRS (I, II, III, IV), LEDD, HY, BDI and PDQ‐39, a higher score corresponds to a worse outcome and accordingly, a positive mean difference (preDBS‐postDBS score) indicates improvement. The higher the value of a positive mean difference, the most prominent is the improvement. On the other side, in SE and MoCA, a higher score denotes a better outcome. Consequently, a positive mean difference (preDBS‐postDBS score) indicates a deterioration, while a negative mean difference points to an improvement. Higher values of a negative mean difference suggest a more notable improvement. Guidance is provided regarding the direction towards the better outcome for each diagram separately. For UPDRS (I, II, III, IV), LEDD, HY, BDI and PDQ‐39, values on the x‐axis higher than 0 indicate improvement while values lower than 0 indicate deterioration. For SE and MoCA, values higher than 0 indicate deterioration, while values lower than 0 improvement. BDI, beck depression inventory; HY, Hoehn and Yahr stage; LEDD, levodopa equivalent daily dosage; MoCA, montreal cognitive assessment; PDQ‐39, 39‐item Parkinson's disease questionnaire; SE, Schwab and England quality of life scale; UPDRS, unified Parkinson's disease rating scale.
Outcome Predictors
The analysis at the variant level implied that the outcome of DBS might differ across carriers of the same mutated gene bearing a different genetic change. Hence, the type of genetic variant can putatively affect the final outcome. We then wanted to investigate, if there are parameters other than the genetic background that influence the DBS outcome. A correlation analysis was performed at a first stage and a correlation matrix can be found in Fig. 5. Statistically significant correlations after the Bonferroni correction were divulged between the age of disease onset and UPDRS III (r = −0.547, P < 0.001) as well as the pre‐operative l‐Dopa response and UPDRS III (r = 0.603, P < 0.001).
FIG. 5.
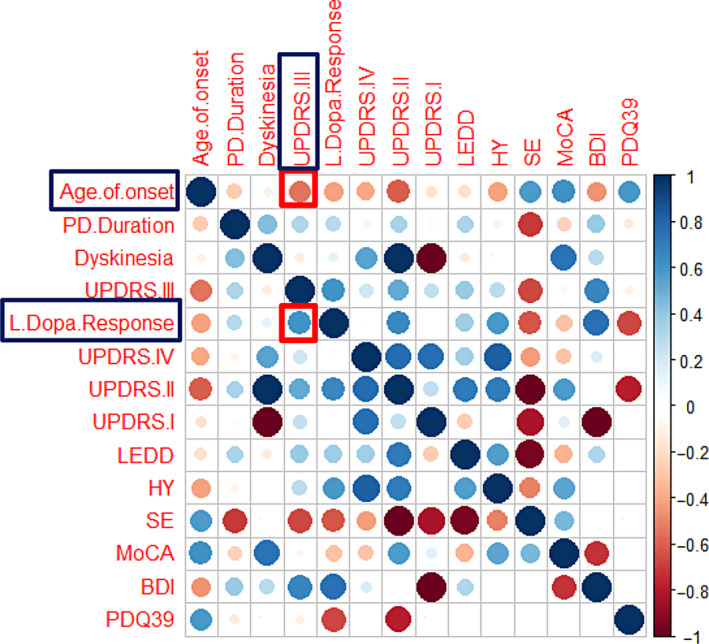
Correlation matrix visualizing the strength of correlation between baseline parameters and DBS outcomes (metric: difference between pre‐DBS and post‐DBS). BDI, beck depression inventory; HY, Hoehn and Yahr stage; LEDD, levodopa equivalent daily dosage; MoCA, montreal cognitive assessment; PD, Parkinson's disease; PDQ‐39, 39‐item Parkinson's disease questionnaire; SE, Schwab and England quality of life scale; UPDRS, unified Parkinson's disease rating scale.
Subsequently, we sought to uncover factors that may serve as outcome predictors. Towards this end, a multiple linear regression analysis was undertaken for linear variables (age of onset, disease duration, levodopa response, elapsing time from disease onset until the occurrence of dyskinesias) (Table S6). When including the years of dyskinesias as a predictor, high VIF and tolerance values (indicators for the presence of multicollinearity) were detected, but when dyskinesia was excluded from the model, this issue was resolved. Among the three predictors after exclusion of dyskinesia, a statistically significant relationship was observed only for pre‐operative levodopa response when the motor outcome (UPDRS III) was assessed (b‐coefficient = 0.462, 95% CI = 0.105–0.818, P = 0.013). Thus, levodopa responsiveness proved to be the most robust predictor for a favorable motor outcome in patients with gPD. To assess if non‐linear baseline variables (gender, family history, presence of tremor as initial symptom) also have an impact on the outcome, we performed group comparisons, but no significant differences were detected (Table S7).
Finally, we aimed to examine if the effect of the genetic background on DBS outcome was influenced by the previously identified outcome predictors and we performed an analysis of covariance (ANCOVA). Based on the available genetic data, the ANCOVA estimates could be computed only for the motor outcome (UPDRS III) including GBA, LRRK2, PRKN, SNCA and VPS35 carriers. Even before adjusting for covariates (ANOVA), a statistically significant difference in the motor outcome among the genetic groups was not found (F‐value = 1.562, P = 0.227). This result did not change after adjusting for the covariates age of onset (F‐value = 1.485, P = 0.248), levodopa response (F‐value = 1.562, P = 0.227) or both (F‐value = 1.684, P = 0.200). The ANCOVA could be conducted only at the gene and not at the variant‐level. Overall, a good pre‐operative levodopa response and a younger age of onset were associated with a better outcome, with levodopa response being the most robust predictor of a favorable motor outcome.
This multi‐scale meta‐analysis is the first to capture motor, pharmacological, cognitive, psychiatric and daily‐life functional outcomes of DBS across the genetic panorama of PD. After pooling data from 41 studies with a total sample of 380 gPD patients, we revisited the question of DBS efficacy in PD patients harboring genetic alterations by merging quantitatively the recently updated literature. Previous reviews and meta‐analyses had mainly focused on motor and pharmacological outcomes but neither did they additionally analyze non‐motor outcomes nor did they dissect the genetic spectrum of Parkinson's Disease in such depth including an analysis at the variant level.
Visualization of the order of the means implied that PRKN patients benefited the most with regard to motor and pharmacological effects and motor complications, which putatively justify the higher level of independence achieved in daily life. PRKN carriers had the youngest age of disease onset (30.4 years, SD 10.7) compared to the age of onset of other gPD and iPD patients that was over 40 years in all cases. A younger age of onset in PRKN carriers has been previously reported. 62 In our correlation analysis, age of onset was negatively correlated with the mean difference of UPDRS III in gPD, meaning that the younger the age of onset the greater the motor improvement. Yet, it should be pointed out that correlation does not imply causation and thus, the observed association does not necessarily mean that a better motor outcome is caused by a younger age of onset. In the orders of the means analysis, whereby PRKN carriers with a younger age of onset than other mutation carriers showed a better motor outcome, correction for age of onset was not plausible. A small‐scale ANCOVA, which was performed only for UPDRS III due to limited individual patient data availability and computational barriers, did not provide any hints that age at disease onset confounds the results. Preceding studies in non‐genetic PD populations showed that patients with a younger age at disease onset indeed have favorable outcomes regarding axial rigidity, dyskinesia and LEDD reduction following DBS, but these results are similar to those observed in patients, who are older at disease onset. 63 , 64 , 65 , 66 In view of these aspects, it is rather unlikely that the better DBS outcomes in PRKN carriers are attributed to their younger age. This remains to be clarified in future studies with larger individual patient datasets, though. It seems that levodopa response is still the best tool to predict motor outcome. Since motor outcomes were similar across genetic PD subtypes in the individual data analysis, the added utility of genetic testing may relate particularly to non‐motor outcomes such as cognition and quality of life. This should also be investigated in more detail in the future.
An aspect that needs to be highlighted is that from the total of 53 PRKN patients, who were included in the analysis of the order of the means, 40 (75.5%) were homozygous or compound heterozygous and 13 (24.5%) were heterozygous. Four patients in the study by Angeli et al 26 were single mutation carriers, but it was stated that despite being reported, they were not taken into account for phenotypic comparisons. Considering that PRKN mutations are linked to autosomal recessive forms of PD, the presence of heterozygous carriers within this subgroup might confound the final result, because heterozygous PRKN mutations are not necessarily pathogenic. A sensitivity analysis after excluding heterozygous carriers was not possible. Nevertheless, a prerequisite for inclusion in our meta‐analysis was that patients in the primary studies had clinically diagnosed PD and consequently, in our patient dataset, heterozygous PRKN mutations were not merely risk variants associated with an increased liability to PD, but they were in fact pathogenic and led to disease. Additionally, the summary effect in this analysis was the mean difference between the pre‐DBS and post‐DBS state, as our meta‐analysis focused on the extent of improvement in phenotypic characteristics rather than the severity of the phenotype. In light of these points and of the fact that the majority of the patients in our study were homozygous or compound heterozygous, the validity of this observation should not be compromised.
The worst motor outcome (UPDRS III) was found in carriers of IGSF9B rs3802920 (GWAS variant) but it should be underscored, that all patients bearing the GWAS variants mentioned in our study emanated from the genetic cohort in the study by Weiss et al, 57 which were also SNCA carriers. Thus, it can be argued that the motor outcome is the worst in PD patients harboring the IGSF9B risk variant rs3802920 on top of the SNCA mutation. Likewise, SNCA carriers in whom a GWAS variant rs11610045 in FBRSL1 was identified had a worse motor outcome. Intriguingly, SNCA carriers with GWAS variants in other genes (MCCC1, SYT17, RAB29, GPR32 and MCTP2) had a better motor response than the carriers of the previous variants. The same trend was noticed when inspecting the dot charts for PDQ‐39. These observations should provide some insights towards a cumulative effect of genetic alterations and suggest that polygenic risk scores represent a more proper approach to presume DBS outcomes. This coincides with a recent preliminary study implying that polygenic risk scores might be more relevant when predicting DBS outcomes, although this study mainly referred to depression. 67 Undoubtedly, our results further enhance this concept, extending it to motor and functional ability outcomes, but they should be interpreted with caution, since our analysis setting did not enable evaluation of statistical significance and was restricted to visualization. In general, SNCA carriers had a relatively worse motor and pharmacological response to DBS.
There has been much debate in the last few years with regard to the cognitive outcome subsequent to DBS in GBA carriers. The question that remains unanswered is if these patients should still be considered for DBS, in particular STN‐DBS. GBA mutations have been associated to a higher burden of non‐motor symptoms and an accelerated cognitive decline. 68 , 69 , 70 On the other hand, DBS itself was found to aggravate cognitive functions such as verbal and phonemic fluency and specific sub‐domains of executive functions. 71 Whether cognitive deterioration represents the natural trajectory in GBA‐associated PD or the consequence of DBS per se, is still ambiguous. Lately, it has been argued that the cognitive impairment in this sub‐group basically stems from the combined effect of GBA mutations and DBS treatment. 44 Our results are in congruence with the prevailing viewpoints, since GBA carriers in our meta‐analysis had a worse cognitive outcome compared to the other genetic groups (Fig. 1) when assessed with the MDRS, although this was not reflected in the MMSE. This discrepancy can be explained by the low sensitivity of MMSE to detect cognitive impairment in PD compared to MDRS, which is a more appropriate screening tool for PD patients, and also by the small sample size. 72 , 73
In the individual patient data analysis, MDRS and MMSE values were converted to MoCA scores to facilitate statistical analysis. MoCA has good psychometric properties and was shown to be superior to MDRS and MMSE as a screening tool for detection of cognitive impairment in PD and as a predictor of conversion to PD dementia. 74 , 75 An overall statistically significant cognitive decline, which was driven by SNCA carriers, was observed. Beyond GBA, the variant analysis pointed towards a more prominent cognitive decline in SNCA cases and in one CHCHD2 carrier. Still, it should be pointed out that the cognitive outcome showed a differential pattern across variants of the same gene. Among GBA carriers, the patient with the mutation GBA: L444P/LRP10: Y116* had the worst cognitive outcome, which is in line with the findings of previous studies, showing an increased liability to dementia in carriers of severe variants like L444P. 76 The better outcome in another carrier of the L444P variant (GBA: L444P/LRRK2:G2019S) is in agreement with the possible protective effect of LRRK2 G2019S mutation among GBA variant carriers in terms of cognitive and psychological outcomes. 77 It becomes apparent that the cognitive outcome in GBA carriers differs in a variant‐dependent manner compromising the generalizability of an expected worse cognitive outcome in GBA carriers. In congruence with this, the cognitive outcome might be influenced by the co‐existence of mutations in other genes. This was also observed for other motor and non‐motor outcomes in genes other than the GBA. Altogether, these aspects highlight the importance of examining the genetic profile on a case‐by‐case basis as well as the value of polygenic scores towards a more reliable risk stratification.
Another point of controversy is the DBS target. In our meta‐analysis, all patients underwent STN‐DBS, except for 10 patients who underwent bilateral GPi‐DBS and 1 patient who had unilateral VIM‐DBS. Yet, the number of patients with DBS targets other than STN was low. When the one patient undergoing VIM‐DBS was excluded from the individual data analysis and the order of the means analysis was performed without the studies, in which at least one patient had DBS in another target region, 21 , 23 , 26 the results remained unaltered. The paucity of data for these patients precluded synthesis and further analyses. It has been demonstrated that, at least in non‐genetic PD populations, GPi‐DBS leads to a better cognitive outcome than STN‐DBS. 78 This disparity has anatomical underpinnings and is attributed to the compact structure of STN, which can result in current spread to adjacent brain regions involved in cognition as opposed to GPi. 79 Recently, it has been reported that two GBA carriers, who underwent GPi‐DBS and whose follow‐up is still ongoing, 80 exhibited a reduction in MDRS after 1 year of only 2 and 4 points, respectively. Hence, GPi appears to be an alternative target but, there is still a big knowledge gap regarding appropriate DBS‐target selection. Studies comparing the GPi and STN‐DBS in gPD are warranted.
Clinical decision‐making in the presence of GBA mutations is a major challenge for practitioners and there are concerns that GBA carriers should not be considered for STN‐DBS. Our study demonstrated that GBA carriers undergoing STN‐DBS had good motor and pharmacological outcomes, but they experienced the worst cognitive outcome and the worst quality of life. To date, the most rational approach would be to detect the presence of GBA variants through sequencing techniques in candidates for DBS and to discuss thoroughly with the patient and the caregiver the potential risks. 81 A personalized approach aided by genetic information and variant‐based risk stratification should be implemented, whenever possible.
Our study has some limitations. Firstly, despite the total sample of 380 gPD patients, individual patient data was available only for 49 patients and the data was not complete in all assessment scales. Therefore, statistical power was diminished. Secondly, in the order of the means and the variant‐level analysis, data was visualized with dot charts and lollipop plots, but statistical comparisons could not be undertaken and statistical significance was not evaluated. For GBA variants, a quantitative sub‐analysis according to the risk variant (mild or severe) was not plausible due to the low number of patients. Thirdly, our results refer to STN‐DBS and cannot be generalized for other DBS targets, mainly GPi. Moreover, although studies which compared iPD with gPD patients were included, pooling the estimates for outcomes of patients carrying mutations in different genes to compare them with the outcomes in iPD patients was not appropriate, since it could lead to masking of some gene‐specific effects. Besides, a comparison with the iPD population would not be representative given that the definition of idiopathic or non‐genetic PD is ambiguous, as genetic testing entails mostly a subset of the known PD‐related genes. Apart from that, it might be that iPD patients harbor genetic alterations that are yet to be discovered, increasing the perplexity of iPD characterization. Future studies should strive to analyze outcomes based on specific genetic mutations to provide more tailored clinical recommendations and more nuanced conclusions regarding DBS outcomes and target selection. Co‐interventions are also important and could affect the overall outcome. It is unclear, if patients in the included studies underwent additional interventions (eg, physiotherapy) post‐DBS, which could influence outcomes. Of course, there could be variation between different centers regarding the exact DBS operational procedure, especially image‐ or micro‐electrode guided, post‐operative care, and stimulation parameters. These variations can impact the outcomes and introduce heterogeneity. Lastly, the mean follow‐up period was 2.4 years, which can be deemed as rather short, principally for cognitive decline to occur. Nonetheless, this mid‐term follow up might be more representative in this setting, since a longer follow‐up would be compromised to a greater extent by the influence of disease natural history. Standardizing the time frame of post‐DBS follow‐up could provide more consistent data across studies and ensure evaluation of all outcomes at the same intervals post‐operation. While the meta‐analysis includes various types of studies, the inclusion of more longitudinal cohort studies could offer a clearer picture of the long‐term effects and evolution of DBS treatment.
Conclusions
In conclusion, gPD patients are overall good candidates for STN‐DBS and show a favorable motor and pharmacological outcome as well as minimization of motor complications. However, the outcomes might differ depending on the presence of specific mutations. PRKN carriers seem to benefit the most from DBS in their motor function, daily dose medication and motor complications, which is ultimately mirrored in a higher level of independency in daily life activities. GBA carriers appear to be more prone to cognitive decline after STN‐DBS accompanied by a low quality of life with variable severity depending on genetic variants and concomitant alterations in other genes. Nevertheless, cognitive decline after DBS, especially in GBA and SNCA carriers, can be observed. A good pre‐operative levodopa response and a younger age of onset are associated with a better motor outcome. A personalized approach with a variant‐based risk stratification within the emerging field of surgicogenomics is needed. Integration of polygenic risk scores in clinical‐decision making is highly promising and should be encouraged.
Author Roles
(1) Research Project: A. Conception, B. Organization, C. Execution; (2) Statistical Analysis: A. Design, B. Execution, C. Review and Critique; (3) Manuscript Preparation: A. Writing of the First Draft, B. Review and Critique.
E.A.: 1B, 1C, 2A, 2B, 3A
G.X.: 2C, 3B
C.S.: 1A, 2C, 3B
Disclosures
Ethical Compliance Statement: The authors confirm that the approval of an institutional review board and patient consent were not required for this work. We confirm that we have read the Journal's position on issues involved in ethical publication and affirm that this work is consistent with those guidelines.
Funding Sources and Conflicts of Interest: The authors declare that there are no conflicts of interest relevant to this work.
Financial Disclosures for Previous 12 Months: The authors declare that there are no additional disclosures to report.
Supporting information
Table S1. Demographic, clinical, genetic and deep‐brain stimulation associated data. Several assessment scales were utilized to assess DBS outcomes and the follow‐up periods were variable. The mean follow‐up was 2.4 years.
Table S2. Demographic, clinical and genetic information for patients included in the meta‐analysis.
Table S3. Risk of bias assessment based on Newcastle‐Ottawa scale.
Table S4. Risk of bias assessment based on the tool provided by Murad et al.
Table S5. Demographic, clinical and genetic information for patients included in the individual patient data analysis.
Table S6. Results of the multiple linear regression analysis with linear baseline variables (age of onset, disease duration, elapsing time until the onset of dyskinesias, pre‐operative levodopa response) as the independent/predictor variables and DBS outcomes across assessment scales as dependent variable. The adjusted P‐value after Bonferroni correction was 0.0018.
Table S7. Results of the group comparison analysis for non‐linear baseline variables (gender, family history, tremor as an initial symptom) for DBS outcomes through independent samples t‐test.
Figure S1. Flow diagram for study selection and search algorithm.
Figure S2. Funnel plots.
References
- 1. Bronstein JM, Tagliati M, Alterman RL, Lozano AM, Volkmann J, Stefani A. Deep brain stimulation for Parkinson disease: an expert consensus and review of key issues. Arch Neurol 2011;68(2):165–171. [DOI] [PMC free article] [PubMed] [Google Scholar]
- 2. Pollak P. Deep brain stimulation for Parkinson's disease–patient selection. Handbook of Clinical Neurology. Vol 116. 1st ed. Amsterdam, Netherlands: Elsevier BV; 2013:97–105. [DOI] [PubMed] [Google Scholar]
- 3. Funayama M, Nishioka K, Li Y, Hattori N. Molecular genetics of Parkinson's disease: contributions and global trends. J Hum Genet 2023;68(3):125–130. [DOI] [PMC free article] [PubMed] [Google Scholar]
- 4. Day JO, Mullin S. The genetics of parkinson's disease and implications for clinical practice. Genes (Basel) 2021;12(7):1006. [DOI] [PMC free article] [PubMed] [Google Scholar]
- 5. Prasuhn J, Brüggemann N. Genotype‐driven therapeutic developments in Parkinson's disease. Mol Med 2021;27(1):42. [DOI] [PMC free article] [PubMed] [Google Scholar]
- 6. Blauwendraat C, Nalls MA, Singleton AB. The genetic architecture of Parkinson's disease. Lancet Neurol 2020;19(2):170–178. [DOI] [PMC free article] [PubMed] [Google Scholar]
- 7. Jia F, Fellner A, Kumar KR. Monogenic Parkinson's disease: genotype, phenotype, pathophysiology, and genetic testing. Genes (Basel) 2022;13:471. [DOI] [PMC free article] [PubMed] [Google Scholar]
- 8. de Oliveira LM, Barbosa ER, Aquino CC, Munhoz RP, Fasano A, Cury RG. Deep brain stimulation in patients with mutations in Parkinson's disease–related genes: a systematic review. Mov Disord Clin Pract 2019;6(5):359–368. [DOI] [PMC free article] [PubMed] [Google Scholar]
- 9. Kuusimäki T, Korpela J, Pekkonen E, Martikainen MH, Antonini A, Kaasinen V. Deep brain stimulation for monogenic Parkinson's disease: a systematic review. J Neurol 2020;267(4):883–897. [DOI] [PMC free article] [PubMed] [Google Scholar]
- 10. Rizzone MG, Martone T, Balestrino R, Lopiano L. Genetic background and outcome of deep brain stimulation in Parkinson's disease. Park Relat Disord 2019;64(64):8–19. [DOI] [PubMed] [Google Scholar]
- 11. Artusi CA, Dwivedi AK, Romagnolo A, et al. Association of subthalamic deep brain stimulation with motor, functional, and pharmacologic outcomes in patients with monogenic Parkinson disease: a systematic review and meta‐analysis. JAMA Netw Open 2019;2(2):e187800. [DOI] [PMC free article] [PubMed] [Google Scholar]
- 12. Moher D, Liberati A, Tetzlaff J, Altman DG. Preferred reporting items for systematic reviews and meta‐analyses: the PRISMA statement. J Clin Epidemiol 2009;62(10):1006–1012. [DOI] [PubMed] [Google Scholar]
- 13. Brooke BS, Schwartz TA, Pawlik TM. MOOSE reporting guidelines for meta‐analyses of observational studies. JAMA Surg 2021;156(8):787–788. [DOI] [PubMed] [Google Scholar]
- 14. Hentz JG, Mehta SH, Shill HA, Driver‐Dunckley E, Beach TG, Adler CH. Simplified conversion method for unified Parkinson's disease rating scale motor examinations. Mov Disord 2015;30(14):1967–1970. [DOI] [PMC free article] [PubMed] [Google Scholar]
- 15. van Steenoven I, Aarsland D, Hurtig H, et al. Conversion between mini‐mental state examination, montreal cognitive assessment, and dementia rating scale‐2 scores in Parkinson's disease. Mov Disord 2014;29(14):1809–1815. [DOI] [PMC free article] [PubMed] [Google Scholar]
- 16. Wells GA, Shea B, O'Connell D, Peterson J, Welch V, Losos M, et al. The Newcastle‐Ottawa Scale (NOS) for assessing the quality of nonrandomised studies in meta‐analyses. Ottawa Hospital Research Institute; 2000. Accessed 2023 July 8.
- 17. Murad MH, Sultan S, Haffar S, Bazerbachi F. Methodological quality and synthesis of case series and case reports. Evid Based Med 2018;23(2):60–63. [DOI] [PMC free article] [PubMed] [Google Scholar]
- 18. Review Manager (RevMan) [Computer Program]. Version 5.4. The Cochrane Collaboration; 2020. Available online: https://training.cochrane.org/system/files/uploads/protected_file/RevMan5.4_user_guide.pdf (Accessed 2023 June 5).
- 19. Higgins JPT, Li T, Deeks JJ. Chapter 6: choosing effect measures and computing estimates of effect. In: Higgins JPT, Thomas J, Chandler J, Cumpston M, Li T, Page MJ, Welch VA, eds. Cochrane Handbook for Systematic Reviews of Interventions Version 6.3. Hoboken, NJ: Wiley‐Blackwell; 2020. [Google Scholar]
- 20. Wan X, Wang W, Liu J, Tong T. Estimating the sample mean and standard deviation from the sample size, median, range and/or interquartile range. BMC Med Res Methodol 2014;14(1):1–13. [DOI] [PMC free article] [PubMed] [Google Scholar]
- 21. Kashyap M, Kola S, Yaranagula SD, Alugolu R, Kandadai RM, Borgohain R. Outcome of deep brain stimulation in autosomal recessive monogenic mutations in young onset Parkinson's disease. Park Relat Disord 2023;112:1–3. [DOI] [PubMed] [Google Scholar]
- 22. Prendes Fernández P, Blázquez Estrada M, Sol Álvarez J, et al. Analysis of deep brain stimulation of the subthalamic nucleus (STN‐DBS) in patients with monogenic PRKN and LRRK2 forms of Parkinson's disease. Park Relat Disord 2023;107(107):10–13. [DOI] [PubMed] [Google Scholar]
- 23. Lythe V, Athauda D, Foley J, et al. GBA‐associated Parkinson's disease: progression in a deep brain stimulation cohort. J Parkinsons Dis 2017;7(4):635–644. [DOI] [PubMed] [Google Scholar]
- 24. Sayad M, Zouambia M, Chaouch M, et al. Greater improvement in LRRK2 G2019S patients undergoing subthalamic nucleus deep brain stimulation compared to non‐mutation carriers. BMC Neurosci 2016;17(1):1–10. [DOI] [PMC free article] [PubMed] [Google Scholar]
- 25. Kim HJ, Yun JY, Kim YE, et al. Parkin mutation and deep brain stimulation outcome. J Clin Neurosci 2014;21(1):107–110. [DOI] [PubMed] [Google Scholar]
- 26. Angeli A, Mencacci NE, Duran R, et al. Genotype and phenotype in Parkinson's disease: lessons in heterogeneity from deep brain stimulation. Mov Disord 2013;28(10):1370–1375. [DOI] [PMC free article] [PubMed] [Google Scholar]
- 27. Fleury V, Wider C, Horvath J, et al. Successful long‐term bilateral subthalamic nucleus deep brain stimulation in VPS35 Parkinson's disease. Park Relat Disord 2013;19(7):707–708. [DOI] [PubMed] [Google Scholar]
- 28. Greenbaum L, Israeli‐Korn SD, Cohen OS, et al. The LRRK2 G2019S mutation status does not affect the outcome of subthalamic stimulation in patients with Parkinson's disease. Park Relat Disord 2013;19(11):1053–1056. [DOI] [PubMed] [Google Scholar]
- 29. Weiss D, Brockmann K, Srulijes K, et al. Long‐term follow‐up of subthalamic nucleus stimulation in glucocerebrosidase‐associated Parkinson's disease. J Neurol 2012;259(9):1970–1972. [DOI] [PubMed] [Google Scholar]
- 30. Johansen KK, Jørgensen JV, White LR, Farrer MJ, Aasly JO. Parkinson‐related genetics in patients treated with deep brain stimulation. Acta Neurol Scand 2011;123(3):201–206. [DOI] [PubMed] [Google Scholar]
- 31. Gómez‐Esteban JC, Lezcano E, Zarranz JJ, González C, Bilbao G, Lambarri I, Rodríguez OGJ. Outcome of bilateral deep brain subthalamic stimulation in patients carrying the R1441G mutation in the LRRK2 dardarin gene. Neurosurgery 2008;62(4):857–862. discussion 862–863. [DOI] [PubMed] [Google Scholar]
- 32. Lohmann E, Welter ML, Fraix V, et al. Are parkin patients particularly suited for deep‐brain stimulation? Mov Disord 2008;23(5):740–743. [DOI] [PubMed] [Google Scholar]
- 33. Krause P, Reimer J, Kaplan J, Borngräber F, Schneider GH, Faust K, Kühn AA. Deep brain stimulation in early onset Parkinson's disease. Front Neurol 2022;13:1041449. [DOI] [PMC free article] [PubMed] [Google Scholar]
- 34. Schüpbach M, Lohmann E, Anheim M, et al. Subthalamic nucleus stimulation is efficacious in patients with parkinsonism and LRRK2 mutations. Mov Disord 2007;22(1):119–122. [DOI] [PubMed] [Google Scholar]
- 35. Romito LMA, Contarino MF, Ghezzi D, Franzini A, Garavaglia B, Albanese A. High frequency stimulation of the subthalamic nucleus is efficacious in Parkin disease. J Neurol 2005;252(2):208–211. [DOI] [PubMed] [Google Scholar]
- 36. Chen S, Zhang H, Zhang J, et al. Motor and non‐motor responses of STN DBS in early onset PLA2G6 related Parkinsonism with compound heterozygous mutation from China. Park Relat Disord 2022;2023(106):2022–2024. [DOI] [PubMed] [Google Scholar]
- 37. Covolo A, Imbalzano G, Artusi CA, et al. 15‐year subthalamic deep brain stimulation outcome in a Parkinson's disease patient with Parkin gene mutation: a case report. Neurol Sci 2023;44(8):2939–2942. [DOI] [PubMed] [Google Scholar]
- 38. Kim YS, Park DG, Kim MS, Yoon JH. Deep brain stimulation in Parkinson disease with valosin‐containing protein gene mutation. Eur J Neurol 2023;30:2583–2586. [DOI] [PubMed] [Google Scholar]
- 39. Kamo H, Oyama G, Nishioka K, Funayama M, Hattori N. Deep brain stimulation for a patient with familial Parkinson's disease harboring CHCHD2 p.T61I. Mov Disord Clin Pract 2022;9(3):407–409. [DOI] [PMC free article] [PubMed] [Google Scholar]
- 40. Kuo MC, Tai CH, Tseng SH, Wu RM. Long‐term efficacy of bilateral subthalamic deep brain stimulation in the parkinsonism of SCA 3: a rare case report. Eur J Neurol 2022;29(8):2544–2547. [DOI] [PubMed] [Google Scholar]
- 41. Ishiguro M, Li Y, Yoshino H, et al. Clinical manifestations of Parkinson's disease harboring VPS35 retromer complex component p.D620N with long‐term follow‐up. Park Relat Disord 2021;84:139–143. [DOI] [PubMed] [Google Scholar]
- 42. Ledda C, Artusi CA, Montanaro E, Martone T, Zibetti M, Lopiano L. G325R GBA mutation in Parkinson's disease: disease course and long‐term DBS outcome. Brain Stimul 2021;14(5):1169–1171. [DOI] [PubMed] [Google Scholar]
- 43. Neri M, Braccia A, Panteghini C, et al. Parkinson's disease‐dementia in trans LRP10 and GBA variants: response to deep brain stimulation. Park Relat Disord 2021;92:72–75. [DOI] [PubMed] [Google Scholar]
- 44. Pal G, Mangone G, Hill EJ, et al. Parkinson disease and subthalamic nucleus deep brain stimulation: cognitive effects in GBA mutation carriers. Ann Neurol 2022;91(3):424–435. [DOI] [PMC free article] [PubMed] [Google Scholar]
- 45. Racki V, Papic E, Almahariq F, Chudy D, Vuletic V. The successful three‐year outcome of deep brain stimulation in Gaucher disease type 1 associated Parkinson's disease: a case report. Mov Disord Clin Pract 2021;8(4):604–606. [DOI] [PMC free article] [PubMed] [Google Scholar]
- 46. Chen YF, Chang YY, Lan MY, Chen PL, Lin CH. Identification of VPS35 p.D620N mutation‐related Parkinson's disease in a Taiwanese family with successful bilateral subthalamic nucleus deep brain stimulation: a case report and literature review. BMC Neurol 2017;17(1):1–6. [DOI] [PMC free article] [PubMed] [Google Scholar]
- 47. Danaila T, Polo G, Klinger H, et al. Efficacy of subthalamic nucleus stimulation in C9ORF72 expansion related parkinsonism. Park Relat Disord 2014;20(10):1104–1105. [DOI] [PubMed] [Google Scholar]
- 48. Nakahara K, Ueda M, Yamada K, et al. Juvenile‐onset Parkinsonism with digenic parkin and PINK1 mutations treated with subthalamic nucleus stimulation at 45 years after disease onset. J Neurol Sci 2014;345(1):276–277. [DOI] [PubMed] [Google Scholar]
- 49. Shimo Y, Natori S, Oyama G, Nakajima M, Ishii H, Arai H, Hattori N. Subthalamic deep brain stimulation for a Parkinson's disease patient with duplication of SNCA. Neuromodulation 2014;17(1):102–103. [DOI] [PubMed] [Google Scholar]
- 50. Elia AE, Petrucci S, Fasano A, et al. Alpha‐synuclein gene duplication: marked intrafamilial variability in two novel pedigrees. Mov Disord 2013;28(6):813–817. [DOI] [PubMed] [Google Scholar]
- 51. Antonini A, Pilleri M, Padoan A, Landi A, Ferla S, Biundo R, D'Avella D. Successful subthalamic stimulation in genetic Parkinson's disease caused by duplication of the α‐synuclein gene. J Neurol 2012;259(1):165–167. [DOI] [PubMed] [Google Scholar]
- 52. Perju‐Dumbrava LD, McDonald M, Kneebone AC, Long R, Thyagarajan D. Sustained response to deep brain stimulation in LRRK2 parkinsonism with the Y1699C mutation. J Parkinsons Dis 2012;2(4):269–271. [DOI] [PubMed] [Google Scholar]
- 53. Breit S, Wächter T, Schmid‐Bielenberg D, et al. Effective long‐term subthalamic stimulation in PARK8 positive Parkinson's disease. J Neurol 2010;257(7):1205–1207. [DOI] [PubMed] [Google Scholar]
- 54. Lefaucheur R, Derrey S, Guyant‐Maréchal L, Chastan N, Maltête D. Whatever the disease duration, stimulation of the subthalamic nucleus improves Parkin disease. Park Relat Disord. 2010;16(7):482–483. [DOI] [PubMed] [Google Scholar]
- 55. Sortwell CE, Hacker ML, Fischer DL, Konrad PE, Davis TL, Neimat JS, et al. BDNF rs6265 genotype influences outcomes of pharmacotherapy and subthalamic nucleus deep brain stimulation in early‐stage Parkinson's disease. Neuromodulation 2022;25(6):846–853. [DOI] [PMC free article] [PubMed] [Google Scholar]
- 56. Capecci M, Passamonti L, Annesi F, Annesi G, Bellesi M, Cirò Candiano IC, et al. Chronic bilateral subthalamic deep brain stimulation in a patient with homozygous deletion in the parkin gene. Mov Disord 2004;19(12):1450–1452. [DOI] [PubMed] [Google Scholar]
- 57. Weiss D, Landoulsi Z, May P, et al. Genetic stratification of motor and QoL outcomes in Parkinson's disease in the EARLYSTIM study. Park Relat Disord 2022;103:169–174. [DOI] [PubMed] [Google Scholar]
- 58. Youn J, Oyama G, Hattori N, et al. Subthalamic deep brain stimulation in Parkinson's disease with SNCA mutations: based on the follow‐up to 10 years. Brain Behav 2022;12(2):e2503. [DOI] [PMC free article] [PubMed] [Google Scholar]
- 59. Fernández‐Pajarín G, Sesar Á, Jiménez‐Martín I, Ares BCA. Progression and treatment of a series of patients with advanced LRRK2‐associated Parkinson's disease. Neurología (Engl Ed) 2020;38(5):350–356. [DOI] [PubMed] [Google Scholar]
- 60. Mangone G, Bekadar S, Cormier‐Dequaire F, et al. Early cognitive decline after bilateral subthalamic deep brain stimulation in Parkinson's disease patients with GBA mutations. Park Relat Disord 2020;76:56–62. [DOI] [PubMed] [Google Scholar]
- 61. Chen S, Liu H, Wu QQ, et al. Effect of LRRK2 G2385R variant on subthalamic deep brain stimulation efficacy in Parkinson's disease in a Han Chinese population. Front Neurol 2019;10:1231. [DOI] [PMC free article] [PubMed] [Google Scholar]
- 62. Lücking CB, Dürr A, Bonifati V, et al. Association between early‐onset Parkinson's disease and mutations in the parkin gene. N Engl J Med 2000;342:1560–1567. [DOI] [PubMed] [Google Scholar]
- 63. Sun M, Ryu H, Won K, Choi N, You S, Kim M, et al. Age‐dependent e ffi cacy of subthalamic nucleus deep brain stimulation in young‐ and late‐onset Parkinson's disease based on a 10 year follow‐up. J Neurol Sci 2020;416:117004. [DOI] [PubMed] [Google Scholar]
- 64. Tsai S, Hung H, Hsieh T, Lin S, Lin S, Chen S. Long‐term outcome of young onset Parkinson's disease after subthalamic stimulation–a cross‐sectional study. Clin Neurol Neurosurg 2013;115(10):2082–2087. [DOI] [PubMed] [Google Scholar]
- 65. Du T, Yuan T, Zhu G, Ma R, Zhang X, Chen Y, et al. The effect of age and disease duration on the efficacy of subthalamic nuclei deep brain stimulation in Parkinson's disease patients. CNS Neurosci Ther 2022;28:2163–2171. [DOI] [PMC free article] [PubMed] [Google Scholar]
- 66. Camerucci E, Stang CD, Turcano P, et al. Deep brain stimulation and treatment outcomes of young‐ and late‐onset (≤55 years) Parkinson's disease: a population‐based study. Front Neurol 2021;12:784398. [DOI] [PMC free article] [PubMed] [Google Scholar]
- 67. Yoon E, Ahmed S, Li R, et al. Association of polygenic risk score with response to deep brain stimulation in Parkinson's disease. BMC Neurol 2023;23(1):1–6. [DOI] [PMC free article] [PubMed] [Google Scholar]
- 68. Sidransky E, Nalls MA, Ph D, Aasly JO, Ph D, Annesi G, et al. Multicenter_GBAmutations_PD. N Engl J Med 2009;361(17):1651–1661. [DOI] [PMC free article] [PubMed] [Google Scholar]
- 69. Brockmann K, Srulijes K, Hauser AK, Schulte C, Csoti I, Gasser T, Berg D. GBA‐associated PD presents with nonmotor characteristics. Neurology 2011;77(3):276–280. [DOI] [PubMed] [Google Scholar]
- 70. Setó‐Salvia N, Pagonabarraga J, Houlden H, et al. Glucocerebrosidase mutations confer a greater risk of dementia during Parkinson's disease course. Mov Disord 2012;27(3):393–399. [DOI] [PubMed] [Google Scholar]
- 71. Bucur M, Papagno C. Deep brain stimulation in parkinson disease: a meta‐analysis of the long‐term neuropsychological outcomes. Neuropsychol Rev 2023;33:307–346. [DOI] [PMC free article] [PubMed] [Google Scholar]
- 72. Mamikonyan E, Moberg PJ, Siderowf A, Duda JE, Ten HT, Hurtig HI, et al. Mild cognitive impairment is common in Parkinson's disease patients with normal mini‐mental state examination (MMSE) scores. Park Relat Disord 2009;15(3):226–231. [DOI] [PMC free article] [PubMed] [Google Scholar]
- 73. Riedel O, Klotsche J, Spottke A, et al. Cognitive impairment in 873 patients with idiopathic Parkinson's disease: results from the German study on epidemiology of Parkinson's disease with dementia (GEPAD). J Neurol 2008;255(2):255–264. [DOI] [PubMed] [Google Scholar]
- 74. Kim HM, Nazor C, Zabetian CP, et al. Clinical Parkinsonism & related disorders prediction of cognitive progression in Parkinson's disease using three cognitive screening measures. Clin Park Relat Disord 2019;1:91–97. [DOI] [PMC free article] [PubMed] [Google Scholar]
- 75. Hoops S, Nazem S, Siderowf AD, Duda JE, Xie SX, Stern MB, Weintraub D. Validity of the MoCA and MMSE in the detection of MCI and dementia in Parkinson disease. Neurology 2009;73(21):1738–1745. [DOI] [PMC free article] [PubMed] [Google Scholar]
- 76. Cilia R, Tunesi S, Marotta G, et al. Survival and dementia in GBA‐associated Parkinson's disease: the mutation matters. Ann Neurol 2016;80(5):662–673. [DOI] [PubMed] [Google Scholar]
- 77. Yahalom G, Greenbaum L, Israeli‐Korn S, et al. Carriers of both GBA and LRRK2 mutations, compared to carriers of either, in Parkinson's disease: risk estimates and genotype‐phenotype correlations. Park Relat Disord 2019;62(62):179–184. [DOI] [PubMed] [Google Scholar]
- 78. Cernera S, Okun MS, Gunduz A. A review of cognitive outcomes across movement disorder patients undergoing deep brain stimulation. Front Neurol 2019;10:419. [DOI] [PMC free article] [PubMed] [Google Scholar]
- 79. Massano J, Garrett C. Deep brain stimulation and cognitive decline in Parkinson's disease: a clinical review. Front Neurol 2012;3:66. [DOI] [PMC free article] [PubMed] [Google Scholar]
- 80. Fung WK, Cohn M, Lang AE, Fasano A. Precision vs. personalized DBS for GBA‐related Parkinson disease. Ann Neurol 2022;92(5):906–908. [DOI] [PubMed] [Google Scholar]
- 81. Artusi CA, Lopiano L. Should we offer deep brain stimulation to Parkinson's disease patients with GBA mutations? Front Neurol 2023;14:1158977. [DOI] [PMC free article] [PubMed] [Google Scholar]
Associated Data
This section collects any data citations, data availability statements, or supplementary materials included in this article.
Supplementary Materials
Table S1. Demographic, clinical, genetic and deep‐brain stimulation associated data. Several assessment scales were utilized to assess DBS outcomes and the follow‐up periods were variable. The mean follow‐up was 2.4 years.
Table S2. Demographic, clinical and genetic information for patients included in the meta‐analysis.
Table S3. Risk of bias assessment based on Newcastle‐Ottawa scale.
Table S4. Risk of bias assessment based on the tool provided by Murad et al.
Table S5. Demographic, clinical and genetic information for patients included in the individual patient data analysis.
Table S6. Results of the multiple linear regression analysis with linear baseline variables (age of onset, disease duration, elapsing time until the onset of dyskinesias, pre‐operative levodopa response) as the independent/predictor variables and DBS outcomes across assessment scales as dependent variable. The adjusted P‐value after Bonferroni correction was 0.0018.
Table S7. Results of the group comparison analysis for non‐linear baseline variables (gender, family history, tremor as an initial symptom) for DBS outcomes through independent samples t‐test.
Figure S1. Flow diagram for study selection and search algorithm.
Figure S2. Funnel plots.