



Summary
Neurons must be made in the correct proportions to communicate with the appropriate synaptic partners and form functional circuits. In the Drosophila visual system, multiple subtypes of Distal medulla (Dm) inhibitory interneurons are made in distinct, reproducible numbers—from 5 to 800 per optic lobe. These neurons are born from a crescent-shaped neuroepithelium called the Outer Proliferation Center (OPC), which can be subdivided into specific domains based on transcription factor and growth factor expression. We fate mapped Dm neurons and found that more abundant neural types are born from larger neuroepithelial subdomains, while less abundant subtypes are born from smaller ones. Additionally, morphogenetic Dpp/BMP signaling provides a second layer of patterning that subdivides the neuroepithelium into smaller domains to provide more granular control of cell proportions. Apoptosis appears to play a minor role in regulating Dm neuron abundance. This work describes an underappreciated mechanism for the regulation of neuronal stoichiometry.
Keywords: Neural development, BMP signaling, optic lobe, Drosophila, cell number, spatial patterning
Graphical Abstract

eTOC blurb:
Malin et al. demonstrate that spatial patterning of the Drosophila optic neuroepithelium produces distinct pools of stem cells, leading to the generation of neurons with precise stoichiometry. Additionally, this study shows that morphogen gradients contribute another layer of spatial patterning, resulting in tighter control of cell fate and cell number.
Introduction
Visual system function relies on a roster of cell types generated with reproducible proportions: Environmental sampling relies on information detected by photoreceptors, and its interpretation requires a specific number of interneurons at each intermediate visual processing layer. Like the ~60 inhibitory amacrine cell types of the mouse retina1, around 20 classes of Drosophila distal medulla (Dm) neurons are produced in distinct proportions (Figure 1A)2–4. The number of these neurons and the size of their arbors are essential for their function as they regulate the flow of visual information.
Figure 1. Anatomy and neuronal specification mechanisms of the optic lobe.

(A) Graphical representation of the optic lobe with the retina and four neuropils: the lamina, medulla, lobula and lobula plate. The medulla contains over 100 cell types, roughly 20 of which are Distal medulla neurons. Some, like Dm8 (green), possess many neurons (~550 cells per optic lobe); others, like Dm11 (red), are less numerous (70 cells per optic lobe). Dm4 has 40 neurons per optic lobe (blue), and Dm12 (purple) has 120. A= Anterior, P= Posterior, M= Medial, L= Lateral. (B) 800 photoreceptor ommatidia (stained by Chaoptin) project their axons into the medulla. Scale bar = 10μm. (C) Dm8 possesses roughly ~550 cells per optic lobe. They are labeled by Multicolor Flip Out (MCFO), in which each neuron stochastically expresses a combination of HA, V5, and FLAG tags to individually label each cell type and their morphology. (D) Dm11 (also stained by MCFO) possesses roughly 70 cells per optic lobe. (E) Neural stem cells called neuroblasts express a series of temporal Transcription Factors (tTFs) as they age, the output of which directs neural patterning. Non= NotchON, GMC= ganglion mother cell (design of this panel was inspired by the original authors, see Konstantinides et al., 202219). (F) Medulla neurons are born from the Outer Proliferation Center (OPC), which is spatially subdivided based on the non-overlapping expression of transcription factors and growth factors13. D= Dorsal, V= Ventral, A= Anterior, P= Posterior, L= Lateral, M= Medial. Carats indicate the direction of neuroblast-producing neurogenic wave. (G) The OPC is dorsoventrally divided by Spalt and Disco expression26. (H) Fate mapping of medulla neurons born from Hth temporal window13. Mi1s (gray), present at a 1:1 ratio of neurons to photoreceptor columns, are born from the entire main OPC. Pm2 (green) and Pm3 (blue) are less abundant and are born from neuroblasts derived from smaller OPC domains. Pm1 (not shown) is generated from the ventral OPC.
Four neuropils comprise the Drosophila visual system: the lamina, the medulla, the lobula, and the lobula plate5,6. Dm neurons represent about one fifth of the 100 cell types in the medulla, the main optic ganglion through which visual information is processed en route to the central brain (Figure 1A). Dm neurons project their dendrites to process visual information from the distal half of the medulla (Figure 1A)2,5. They possess diverse morphologies and functions reflected in their stereotyped numbers, which have been characterized through fluorescence microscopy and electron micrograph reconstruction2,7. For example, highly overlapping Dm8 neurons receive input from R7 color-sensitive photoreceptors and possess around ~550 cells per optic lobe (Figure 1A (green), Figure 1B–C, Supplementary Table S1)2,7–10. In contrast, Dm11, the most transcriptionally similar cell type to Dm8, also receives R7 inputs, but possesses only 70 tiled neurons per optic lobe (Figure 1A (red), Figure 1D)2,9,11. How are these neurons, and others, generated with different proportions to achieve their distinct functions?
Dm neurons (and most medulla neurons) are born from a crescent-shaped neuroepithelium called the Outer Proliferation Center (OPC)12,13. During the third larval instar (L3), a wave of differentiation passes through the neuroepithelium and converts neuroepithelial cells into neural stem cells called neuroblasts14–16. Each neuroblast divides asymmetrically to regenerate a neuroblast and produce an intermediate progenitor (Ganglion Mother Cell, or GMC)17. During successive divisions, neuroblasts pass through a series of temporal windows generated by the overlapping expression of temporal transcription factors (tTFs)—Hth, Opa, Erm, Ey, Hbn, Scro, Slp1/2, D, Bar-H1 and Tll—whose output specifies the fates of each medulla neuron type (Figure 1E)18–22. Further cell fate diversification arises from the asymmetric, Notch-mediated GMC division that generates two distinct daughter cells, one Notchon and one Notchoff (Figure 1E)18,23. All OPC neuroblasts undergo the same tTF series except neuroblasts arising from the Wg spatial domain (i.e., the tips of the OPC, or tOPC), which express a modified tTF series18,23.
The output of the temporal series is modified by additional patterning generated by the expression of spatially restricted neuroepithelial factors, which partitions the OPC into different domains (Figure 1F–G)13. The visual system homeodomain transcription factor Vsx is expressed in the center of the OPC24; the Six3 homeodomain Optix is expressed more posteriorly25, and the retinal homeodomain Rx is expressed at the tips of the OPC (Figure 1F)13. The OPC can be further subdivided along the dorsoventral axis: Spalt/Salm are expressed dorsally while Disco is expressed ventrally (Figure 1G)26. The signaling molecule Hedgehog (Hh) is expressed ventrally earlier in embryogenesis but is not maintained during neurogenesis (Figure 1G)13,27. The Rx domain is further subdivided into subdomains marked by the posterior expression of Wingless (Wg) at the tips of the OPC, with Decapentaplegic (Dpp) expressed closer to Optix (Figure 1F)28,29.
Previous experiments identified neurons born from the earliest Hth temporal window: Mi1, a cell type with a 1:1 ratio of neurons to columns, is born from the entire OPC, while less numerous types, such as Pm2 or Pm3, are born from much smaller neuroepithelial domains (Figure 1H)13. This suggests that spatiotemporal patterning could act not just as a mechanism for cell fate regulation, but to also regulate neuronal abundance. Although the spatial origins of neurons born from the Hth window are known, the spatial origins of later-born Dms are unknown13. It is also unknown how much of a role spatial patterning plays in determining the proportion of different neurons.
We examined the role of spatial patterning in the regulation of Dm neuron number and fate specification using genetic fate mapping tools and single-cell RNA sequencing (scRNAseq) techniques. We find that the relative abundance of a specific Dm subclass is roughly proportional to the size of the neuroepithelium from which it is born. We identify additional spatial factors that pattern medulla neurons: Signaling from the BMP homolog Dpp represses the transcriptional repressor Brinker (Brk)30, whose expression splits the Optix domain into subdomains. Additionally, the overlap of Dpp expression with Optix forms an additional neuroepithelial spatial domain, allowing for more granular regulation of cell number. We also show that apoptosis provides smaller, but significant changes to regulate cell number. Our work suggests that spatial patterning not only promotes cell fate, but that it also regulates cell type proportions.
Results
The number of Dm neurons is proportional to the size of their neuroepithelial domain of origin
As earlier experiments suggested that spatial patterning could regulate neuronal abundance13, we wondered whether the size of the neuroepithelial domain of origin correlated with Dm neuron number. As Dm neurons move during their development13, we could not use cell body position during adulthood as a proxy for birth region. Additionally, as spatial transcription factors are solely expressed in neuroepithelial cells and not in neuroblasts or mature neurons, we used genetic memory labeling techniques to map each Dm neuron’s spatial subdomain of birth.
To permanently mark the neurons born from each domain, we crossed flies expressing an actin::FRT-stop-FRT-nuclear β-Gal cassette to flies expressing UAS-Flp recombinase under the control of a GAL4 line driven by the regulatory region of a spatially restricted factor (e.g. Optix-GAL4, Figure 2A)10. We then crossed our fate mapping lines to Dm-specific GFP reporter lines and looked at adult animals to determine each neuron’s spatial origin. As Rx’s expression pattern is highly dynamic during development, we could not use it for our initial lineage tracing experiments (Supplementary Figure S1A–B). However, Optix and hh memory lines showed consistent expression in their respective domains throughout development; thus, they did not require repression at earlier stages and were used for further study10. As Vsx is expressed outside of its domain in neurons, while Pxb (a gene with the same OPC expression pattern as Vsx) is not, we used pxb-GAL4 to label the Vsx domain10,21. The lineage tracing data and putative origins for each Dm line are presented in Figure 2C–N, Supplementary Figure S1C–II, and Table S1.
Figure 2. Fate mapping of Distal medulla neurons.

(A) Technical approach for genetic fate mapping cassette10: A ubiquitous promoter (actin/ubiquitin) drives an FRT-Stop cassette-FRT-nuclear localized reporter (lacZ or GFP); the stop cassette is excised by expression of Flp recombinase under the control of each spatial factor controlling GAL4. Neurons born from each neuroepithelial domain are thus permanently marked. (B) pxb, Optix, vOptix, dOptix, and hh lines were FACSorted and subjected to scRNAseq to identify the spatial origin for each cell type. Average normalized abundance of the Dm clusters in datasets produced either in the whole optic lobe or from neurons from the FACSed datasets. The error bars represent the minimal and maximal values across all libraries of a dataset. The asterisks indicate when at least 1 library had fewer than 3 cells of a given cell type, or if the annotations were made with low confidence. Below the graph represents the expected cell number and spatial origin of each cell type. This is based on the scRNAseq data as well as inferences made from all other experiments from the paper (see Table S1, Methods). (C-N) Representative example of spatial transcription factor fate mapping experiments. Scale bar = 5μm. Open carat= lack of expression. Filled carat = presence of expression. Animals scored are adults. Dm3 neurons express the Pxb/Vsx lineage trace (C-C’), Optix lineage trace (D-D’) and Hh lineage trace (E-E’). (F) Graphical representation of Dm3 origin (based on information from Fig. 1B–E as well as Table S1). Dm15 neurons express the Pxb/Vsx lineage trace (G-G’), and the Optix lineage trace (H-H’), but not the Hh lineage trace (I-I’). (J) Graphical representation of Dm15 origin (based on information from Fig. 1B, G–I as well as Table S1). Dm4 neurons do not express the Pxb/Vsx lineage trace (K-K’) but do express the Optix (L-L’) and Hh lineage traces (M-M’). (N) Graphical representation of Dm4 origin (based on information from Fig. 1B, K–M as well as Table S1).
Because the lineage tracing lines used GAL4 to express β-Gal, they required crosses to cell-type specific enhancer lines that used a different binary gene expression system (i.e. LexA) to express GFP in specific Dms. Additionally, some Dm neuron classes did not have cell-specific LexA lines, preventing us from fate mapping these cells. To obtain a more exhaustive description of Dm neuron origins, we used fate mapping lines expressing ubiquitin::FRT-stop-FRT-nuclear GFP, which we sorted using FACS and submitted to single-cell RNA sequencing (scRNAseq). To distinguish between dorsal and ventral Optix, we used split-GAL4 lines that intersected Optix with the dorsal factor Spalt (salr-T2A-VP16AD ∩ Optix-T2A-GAL4-DBD) or the ventral factor Disco (disco-T2A-VP16AD ∩ Optix-T2A-GAL4-DBD, Figure 1G)26. For these experiments, we used our existing scRNAseq datasets31 and a neural network classifier31 to accurately identify the medulla neurons originating from each spatial domain (Figure 2B, Supplementary Figure S2A–C’; results for neurons other than Dms are presented in Simon et al., 202432). As our dOptix line was crossed to a construct expressing GFP with a nuclear localization signal (UAS-nls-GFP) and not to our lineage tracing line, we performed scRNAseq on animals who were sufficiently young that GFP perdured in the maturing neurons (before P12). Some of these neurons were too immature to be accurately identified using the neural network classifier (i.e., Dm2, Dm3, Dm15). However, when we constructed single-cell trajectories for immature neurons, we found that the precursors to Dm2, Dm3, and Dm15 were indeed detected in our FACSed dOptix datasets (Supplementary Figure S2A–C’, clusters Im11 and Im12).
Some of the neurons from our spatial origin scRNAseq datasets were matched to unannotated clusters from our reference scRNAseq atlas. To identify which of these unannotated clusters contained Dm neurons, we stained lines expressing reporter genes for our neurons of interest with a panel of cell type-specific transcription factor markers18,19, which we then matched to clusters in our scRNAseq datasets (Supplementary Figure S3A–J’, Table S1). Although some cell types were too scarce to reliably annotate their clusters in the datasets, cluster 124 was identified as Dm15 (Supplementary Figure S4A–E).
Although the spatial domain assignments were consistent between individual fate mapping lines and scRNAseq clusters (Figure 2B, Supplementary Figure S1, S2), they also exhibited a few differences between them (i.e., some Dm11s came from Pxb [Vsx] in the scRNAseq, but we only identified a few of these neurons in our pxb-GAL4 genetic lineage tracing experiment, Figure 2B, Supplementary Figure S1C, Table S1). This could be due to contamination of the sequenced cell suspensions by unlabeled cells during FACSing, or mis-annotation of a single-cell transcriptome by our neural network. These caveats are discussed in Methods, Table S1 and in Simon et al., 202432.
We therefore identified neurons where there was a discrepancy and immunostained them for Dm transcription factor markers identified from our scRNAseq datasets (Table S1, Supplementary Figures S5A–G). The larval position of these neurons relative to their neuroepithelial domains allowed for more precise origin assignments. The reasoning used to assign the spatial origin of each Dm type are explained in Table S1, as is the predicted origin of each subtype, which are also depicted in schematics in Figure 2B, F, J, N, Supplementary Figure S1 and Table S1.
Following these experiments, we found that the cell types represented in the highest number of lineage tracing lines were the most numerous. For instance, Dm2 and Dm3 (~800 neurons per optic lobe) originate from the entire dorsal and ventral main OPC (Figure 2B–F, Supplementary Figure S1C, Supplementary Figure S5E–E’, Table S1). Less abundant neurons (~200–300) were found in fewer domains, e.g., Dm15s (~250 neurons) originate from the dorsal Vsx and Optix domains (Figure 2B, 2G–J, Supplementary Figure S1C, Supplementary Figure S5F, Table S1). Finally, neurons that were scarce, such as Dm4 (40 neurons per optic lobe) were born from single neuroepithelial domains (ventral Optix, Figure 2B, 2K–N, Supplementary Figure S1C, Table S1). The correlation between neuroepithelial domain size and neuron number became more tenuous with the scarcest neuron classes (Figure 2B). For example, there are roughly three times as many Dm12s (120 cells per optic lobe) as there are Dm4s (40 cells); however, according to our immunofluorescence data (see “Additional OPC spatial subdivision is controlled by Brinker”), both appear to be born from the same ventral Optix subdomain (Figure 2B, 2K–N, Supplementary Figure S1C–G, S1X–AA, Table S1). We therefore wondered how cell number was regulated for these types.
We first asked whether differences in neuroblast density across spatial domains could account for neuron number differences. We observed no significant density differences across the OPC, nor did there appear to be variation in cell density among neurons born from the entire OPC (Supplementary Figure S5G (Mi1)–S5I). We therefore hypothesized that differences in cell death levels could promote differences in cell number, or that additional spatial patterning could introduce finer-sized compartments, with the number of each neuron reflecting size differences between these subdomains.
Apoptosis plays a limited role in Dm cell number regulation
Programmed cell death has long been implicated in neuron number regulation across various systems33. In the vertebrate nervous system, neurons are generated in excess, and those that do not receive sufficient neurotrophic support are removed via programmed cell death. In fact, as many as half of all vertebrate central nervous system cells are culled in this manner34. We and others have characterized the scale of programmed cell death across the optic lobe during Drosophila development; ours, Kai Zinn’s and Larry Zipursky’s labs found that roughly 20% of Dm8 and Dm4 neurons die during pupal development, respectively10,35,36. Additionally, TUNEL staining performed by the Tsujimura lab suggests that programmed cell death occurs throughout the optic lobe during development, peaking with ~920 optic lobe cells dying at 24 hours into pupation10,35,37.
To determine the role of apoptosis in Dm cell number regulation, we inhibited programmed cell death by expressing a p35 baculovirus repeat domain protein transgene38 under the control of a pan-neuronal enhancer (elav-GAL4). We then analyzed whether the number of several Dm neurons increased in adult animals: Seven of the nine Dms tested did not show a significant difference in cell number following p35 overexpression, while the change in Dm11/Dm4 number was significant (Figure 3A, see Methods for quantification method). For example, Dm11s increased in number from ~52 to 78 neurons after p35 overexpression (Figure 3A, P=0.01, T-Test), while Dm4s significantly increased from ~35 to 45 (Figure 3A, P=0.005, T-Test). Hara et al., performed similar experiments and reported improper neurite targeting with p35 overexpression; we observed similar defects in our experiments (Supplementary Figure S6A–B)39. To confirm that apoptosis was not the main regulator of Dm cell number, we used other methods to inhibit apoptosis and measured the number of Dm4s: we performed RNAi against the effector caspase dronc40, expressed a dominant negative form of dronc41, and expressed microRNAs targeted to the upstream apoptosis activators hid, reaper and grim42. We also expressed UAS-p35 under the control of a neuroepithelial driver (i.e. Optix-GAL4) to exclude the possibility that cell death was occurring in progenitors; although we saw significant changes in cell number, the average number of neurons generated resembled the number of neurons visualized with Elav-mediated p35 overexpression (Figure 3B, Optix-GAL4 vs. Elav-GAL4). The observation that neuron number increases when preventing apoptosis corroborates the idea that medulla neurons are born in excess and undergo programmed cell death preceding synaptogenesis10,35,37; however, these changes are not sufficient to explain the differences between neurons with the same spatial origin (e.g., Dm4 vs Dm12). Therefore, we suggest that apoptosis is but one facet of cell number regulation, and that the initial setpoint of cell number regulation may occur earlier.
Figure 3. Apoptosis plays a minor role in regulating Dm neuron number.

(A) Inhibition of apoptosis via elav-GAL4; UAS-p35 transgene expression provides limited increases in cell number. Number within bars= number of animals scored, Error bars: standard deviation, T-test. (B) Apoptosis inhibition via miRNA against rpr/hid/grim, dronc RNAi, dronc-DN, or Optix-GAL4; UAS-p35 mutants leads to significant increases in Dm4 number. Error bars: standard deviation, small number within bars= number of animals scored, T-test. ns = not significant.
Additional OPC spatial subdivision is controlled by Brinker
Previous experiments suggested that the OPC is divided into additional subdomains10. For example, Dm8s exist as two distinct subtypes that differ in their connectivity to different classes of R7 color photoreceptors; pale Dm8s (pDm8) connect to pale R7s and are born from the anterior 1/3 of the ventral Optix region (near the Vsx domain), while yellow Dm8s (yDm8) connect to yellow R7s and are born from the central 1/3 of the ventral Optix domain (Figure 4A–B’, Supplementary Figure S6C–C’)10. This suggests that the Optix domain is divided into three subdomains. We sought to identify the neurons born from the posterior 1/3 of the ventral Optix domain (closest to Dpp). We found that SoxN+Tj+ Dm1, Dm4 and Dm12 neurons are born from the posterior 1/3 of the ventral Optix domain (Figure 4A–B’, Supplementary Figure S6D–D”), suggesting that pDm8, yDm8 and Dm1/Dm4/Dm12 are born in at least three distinct spatial domains that cover the entirety of the ventral Optix domain (Figure 4A–B’).
Figure 4. Mutually exclusive brinker and dpp expression delineates a second spatial patterning axis.
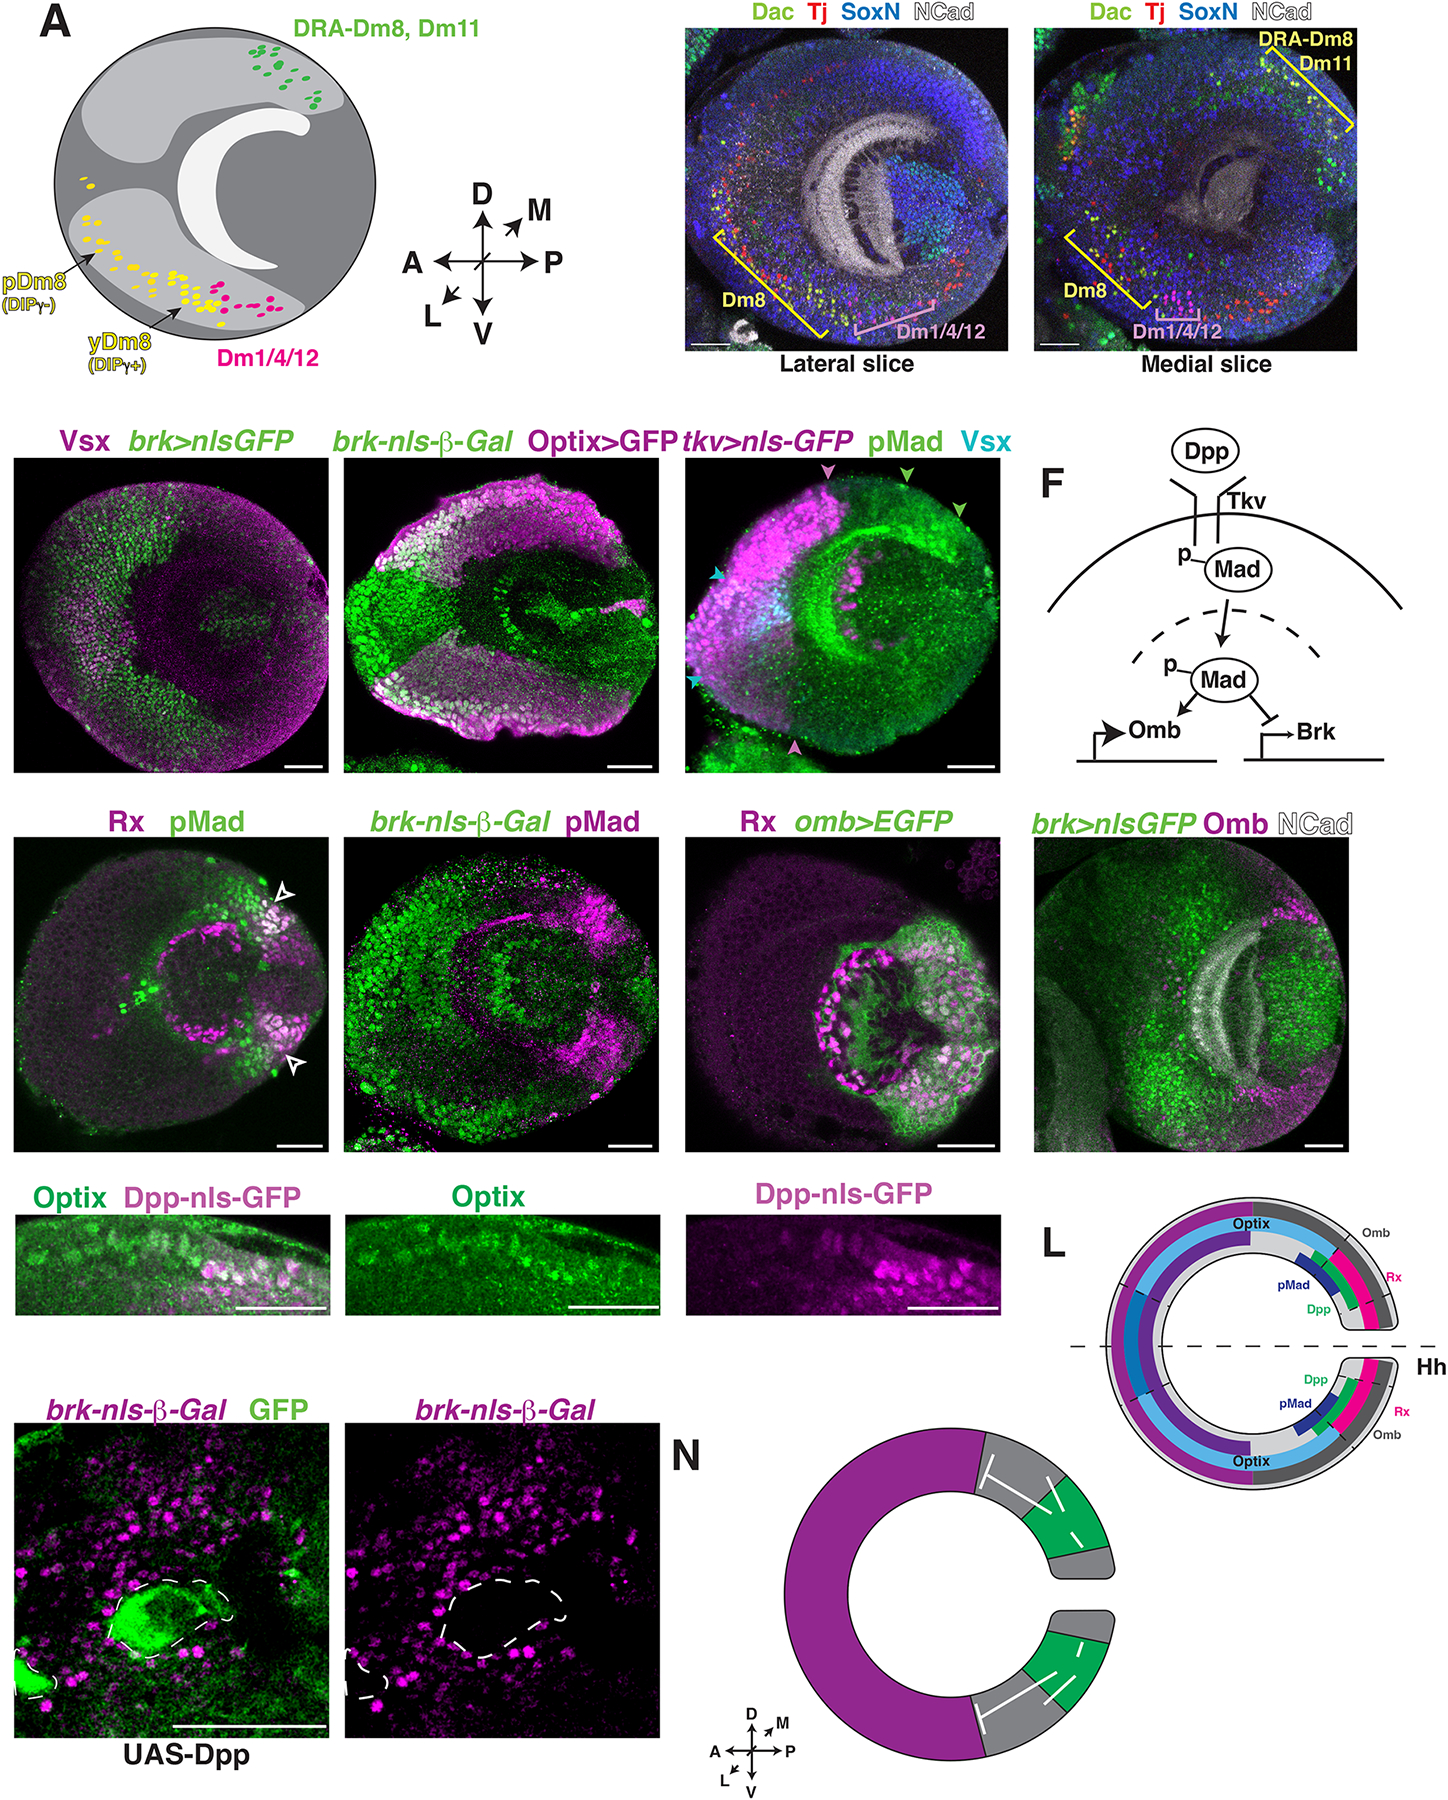
(A) Model for Optix spatial subpatterning of yDm8, pDm8, DRA-Dm8, Dm11, Dm1, Dm4 and Dm12 (See also Table S1. Dm8 data from Courgeon and Desplan, 201910). Lightest gray domain: medulla neuropil; Medium gray domain: Optix region; Darkest gray domain: rest of optic lobe. D= Dorsal, V= Ventral, A= Anterior, P= Posterior, L= Lateral, M= Medial. (B-B’) Dac+Tj+ y/pDm8s are born from the anterior 2/3 of the ventral Optix domain (a few Dac+ Tj+ cell bodies are also found in the medial Vsx domain), while SoxN+Tj+ Dm1/4/12 neurons are born from the posterior 1/3 of the ventral Optix domain. (B) Lateral slice, (B’) Medial slice. (C) Vsx expression sits completely within the brk-GAL4; UAS-nls-sfGFP OPC domain. Carat: border of Vsx OPC domain. (D) brk-nulacZ is expressed within the anterior 2/3 of the Optix region. Carat: border of Brk expression. (E) The Type I Receptor tkv (tkv-GAL4; UAS-nls-GFP) is expressed in a domain similar to brk expression (see Figure 4C). Magenta carat: border of Tkv expression, green carat: border of pMad expression, cyan carat: border of Vsx OPC expression. (F) Graphical representation of the Dpp signaling pathway. (G-J) Immunostaining experiments suggest that Dpp signaling pathway components are expressed in the third larval instar OPC in a manner similar to previously described systems. (G) pMad is expressed at the edge of the Rx domain, and into the Optix domain. Carat: region of overlap. (H) brk-nuLacZ and pMad share mutually exclusive OPC expression patterns. Carat: edge of Brk expression. (I) Omb is expressed within the Rx domain, and slightly outside. Carats: region of Omb/Rx overlap. (J) Omb expression sits adjacent to Brk. (K-K”). Optix protein expression overlaps with dpp-GAL4; UAS-nls-GFP. Carat: cells with overlapping Dpp/Optix expression. (L) Graphical representation of Dpp component expression patterns. (M-M’) brk-nulacZ expression is disrupted in UAS-dpp overexpression Flp-out clones. Dotted lines: region of disrupted brk-nulacZ expression where Dpp is overexpressed. (N) Model for relationship between Dpp and Brk signaling. Scale bar: 30μm.
This finding suggested that additional spatial factors pattern the medulla10. Upon screening, we found that two members of the BMP/Dpp pathway—the BMP/Dpp type I receptor Thickveins (Tkv) and the transcriptional repressor Brinker (Brk)—were expressed in a domain spanning the entire Vsx domain and the anterior 2/3 of the Optix domain (where Dm8s are produced, Figure 4C–E)43. Brk was therefore an excellent candidate to distinguish between Dm8 and Dm1/Dm4/Dm12 fates. Our immunostains suggest that Dm8 neurons are born squarely within the domain of Brk expression (Supplementary Figure S6E–E’), while most Dm1s, Dm4s and Dm12s sit on the other side of the Brk domain (Supplementary Figure S6F–F’). This suggests that Brk expression distinguishes Dm8 from Dm1, Dm4 and Dm12 in the ventral OPC.
Similarly, two other classes of neurons, DRA-Dm8s and Dm11s, are born from the posterior 1/3 of the dorsal Optix domain (closer to the Dpp domain, Figure 4A–B’, Supplementary Figure S6G–G’)10,11,44. However, we could not conclusively identify the neurons born from the anterior 2/3 of the dorsal Optix domain overlapping with Brk.
Dpp signaling establishes the Brinker-expressing domain in the OPC
As Brk forms an additional OPC spatial subdomain, we wondered whether Dpp/BMP regulates Brk’s expression pattern. Dpp is a BMP family protein that forms a morphogen gradient in the Drosophila wing and leg imaginal discs45. Dpp binds to its Type I receptor (Thickveins), leading to a signal transduction cascade ending with phosphorylation of the transcription factor Mad (pMad). pMad activates targets such as the transcription factor optomotor blind (omb, also known as bifid; Figure 4F)46 but also inhibits the expression of genes such as brk, whose expression, in turn, represses genes dependent on Dpp30. We therefore tested whether the Brk domain was established by Dpp signaling at a distance from its expression domain. Indeed, pMad was expressed in a domain extending from the Rx/Dpp domain through the Optix region, consistent with its activation by Dpp (Figure 4G). As with the wing/leg discs, brk was expressed adjacent to pMad (Figure 4H). Tkv was also expressed in a pattern mutually exclusive to pMad (similar to Brk expression, Figure 4E). In the leg disc, this allows for increased Dpp signaling where its receptor concentration is lowest47. As in the wing/leg discs, Omb was expressed in response to active Dpp signaling: across the entire Rx domain (which includes both Dpp and Wg, Figure 4I), as well as into the Optix domain where it bordered Brk expression (Figure 4J). Previously, we assumed that Dpp expression defined a spatial domain distinct from the neighboring Optix domain. However, a dpp-GAL4 line expressed nuclear-GFP in a pattern that colocalized with endogenous Optix protein at the boundary between the domains (Figure 4K–K”). This suggests that Dpp and Optix co-expression forms a smaller spatial domain, and that OPC-expressed Dpp activates pMad to define the Brk spatial domain (Figure 4L).
Although Dpp expression overlaps with Optix in mid-L3, a Dpp genetic lineage tracing line marking all expression from embryogenesis to L3 showed that Dpp was once expressed in a domain completely covering the combined Dpp + Optix domains (Supplementary Figure S7A–B). To further dissect this change, we compared the gene expression pattern of Dpp lineage tracing lines activated during the early third instar (when neurogenesis begins) vs. the late third larval instar. We found that the two lines showed very small differences in expression (~1–2 rows of cells, Supplementary Figure S7C–D’), suggesting that Dpp acts in early L3 to promote neuroepithelial development, but later in L3 to generate molecularly distinct groups of neuroblasts.
To assess whether Dpp represses Brk expression to delimit its domain size, we generated sparse Flp-out clones using tubulin-GAL4. Clones overexpressing Dpp and the surrounding region where Dpp diffuses lacked brk-lacZ expression, suggesting that Dpp suppresses brk to establish additional OPC spatial domains (Figure 4M–N).
Brk and Dpp signaling alters the numbers of Dm neurons
Dpp and Brk expression correlates with the positions of different neuron classes; however, are Dpp and Brk necessary and sufficient to regulate the abundance of neurons born within their domain of activity? As Dm8 and Dm1/4/12 cells abut each other during larval development (Figure 4B–B’), we hypothesized that the Dpp gradient regulating Brk expression delineates the border between these cell types. Indeed, Optix-GAL4; UAS-dpp overexpression reduced the number of Dac+Tj+ Dm8 cells but increased the numbers of SoxN+Tj+ Dm1s, Dm4s, and Dm12s, indicating that it is required for the specification of Dm1/Dm4/Dm12 at the expense of Dm8 (Figure 5A–C’, Dm1/4/12: Dm8 ratio changed from 0.58 to 2.72, N= 3, P= 0.0001, Chi-square test). The remaining Dm8 cells were restricted to a domain closer to the Vsx domain (Figure 5C, yellow bracket). In contrast, Optix-GAL4; UAS-dpp RNAi increased the number of Dm8 cells and reduced the number of Dm1, Dm4 and Dm12 cells (Figure 5A, D, D’, Dm1/4/12: Dm8 ratio changed from 0.58 to 0.24, N= 3, P= 0.0001, Chi-square test). Optix-GAL4; UAS-brk larvae exhibited a decrease in the number of Dm1/4/12 neurons and an increase in Dm8s (Figure 5A, E, E’. Dm1/4/12: Dm8 ratio changed from 0.58 to 0.24, N= 3, P= 0.0001, Chi-square test), while Optix-GAL4; UAS-brk RNAi showed a decrease in the number of Dm8 neurons with an increase in the proportion of Dm1/4/12s (Figure 5A, F, F’, Dm1/4/12: Dm8 ratio changed from 0.58 to 2.15, N= 6, P= 0.0001, Chi-square test). Thus, Dpp and Brk act in opposing directions to specify Dm8 vs. Dm1/4/12 fate and stoichiometry in Optix subdomains.
Figure 5: brk or dpp overexpression during larval development impacts Dm neuron number.

(A) Image quantification. Error bars = standard error of the mean. Small number inside bars= number of optic lobes scored. P value calculated using Chi-Square test. (B) Wild-type Dac+Tj+ Dm8 and SoxN+Tj+ Dm1/4/12 neurons. (B’) Graphical representation of (B); Lightest gray domain: medulla neuropil; Medium gray domain: Optix region; Darkest gray domain: rest of optic lobe. (C) Optix-GAL4; UAS-dpp larvae show more Dm/1/4/12 neurons. (C’) Graphical representation of (C). (D) Optix-GAL4; UAS-dpp RNAi larvae show an increase in Dm8 neurons. (D’) Graphical representation of (D). (E) Optix-GAL4; UAS-brk larvae have fewer Dm1/4/12 neurons. (E’) Graphical representation of (E). (F) Optix-GAL4; UAS-brk RNAi larvae have fewer Dm8 neurons. (F’) Graphical representation of (F). Yellow bracket: Dm8, Pink bracket: Dm1/4/12. Scale bar: 30μm. (G) Quantification of Tj+ cells in (B) through (F). Error bars = standard error of the mean. Small number inside bars= number of optic lobes scored. P value calculated using T-test.
We also wondered whether changes in Dpp/Brk expression affect the overall number of neurons generated. While some variation in Tj+ (which labels both Dm8 and Dm1/4/12) cell number was observed, there was no significant difference (Figure 5G) when we changed the expression of Dpp or Brinker, indicating that the cell type ratio changes reflect changes in cell fate specification rather than abundance.
scRNAseq-based lineage tracing identifies a new domain of overlap between Optix and Dpp
Although Brk expression is sufficient to dictate Dm8 vs. Dm1/Dm4/Dm12 fate, it is not sufficient to distinguish between Dm1, Dm4 and Dm12 ventrally, nor between DRA-Dm8 and Dm11 dorsally. We wondered whether Dpp expression level differences distinguished these neural types. As Dpp expression is dynamic during development, we fate mapped neurons using a dpp-GAL4; UAS-nls-GFP (Stinger) line whose neuroepithelial expression perdures in newborn neurons. We FACSed labeled neurons ~12.5 hours after pupation, before these neurons have migrated13,48, which allowed us to confirm that the correct population of neurons was labelled. We discovered that some neurons appeared to originate from both the Optix and Dpp regions. For example, although Dm1, Dm4 and Dm12 all originate from the ventral Optix domain (Figure 2B), only Dm12 was represented in the Dpp dataset (Dm4 was represented in one of two Dpp libraries) (Figure 6A). This suggests that differences in Dpp levels could account for cell fate differences between Dm neurons: high Dpp would induce Dm12 fate, while lower levels would induce Dm4 and Dm1 (Figure 6A). When we immunostained for SoxN and Tj to label Dm1/4/12, we found that roughly half the neurons in the Dm1/4/12 cluster sit within the ventral Dpp region; these are most likely Dm12s (Figure 6B–B”’).
Figure 6: scRNAseq of fluorescently labeled lineage tracing lines identifies additional spatial patterning required for Dm neuron fate and stoichiometry.

(A) dpp-GAL4; UAS-nls-GFP lines were FACSorted and subjected to scRNAseq to identify the spatial region of origin for each cell type. Average normalized abundance of the Dm clusters in datasets produced either in the whole optic lobe or from neurons from the FACSed datasets. The error bars represent the minimal and maximal values across all libraries of a dataset. The asterisks indicate when at least 1 library had less than 3 cells of a given cell type, or that the annotations were made with low confidence. Below the graph is the expected stoichiometry of each cell type. (B) SoxN+Tj+ (Dm1/4/12) neurons are produced both inside (carat, likely Dm12) and outside (empty carat, likely Dm1/4) the Dpp expression domain. Dotted line: medulla cortex outline. (B’-B”) Inset. Dotted line: region of dpp>>myrGFP expression. (B”’) Graphical representation of B-B” (See Table S1 for Dm1/4/12 positioning). (C) Some dorsal Dac+Tj+ (DRA-Dm8 and/or Dm11) neurons sit outside the Dpp region (empty carat), while other dorsal Dac+Tj+ (Dm11) neurons sit within the Dpp region. (C’-C”) Inset. (C”’) Graphical representation of C-C”. (D) Graphical representation of Dm neuron origins within the OPC (Question mark: Dm9 origin is less clear; see Table S1); temporal windows for each cell type are a rough estimate based on scRNAseq data19. (E) Correlation between neuroepithelial domain size and neuron number. GFP-expressing lines for each spatial factor were imaged and each spatial domain was measured at its widest point; its area was then calculated (Table S2). Each neuron was given a spatial identity, the rationale for which is described in Table S1, which was then further characterized if the neuron was born from a smaller spatial subdomain (i.e., Dm4 from 1/6 of the ventral Optix domain). The linear plot of OPC domain of origin vs. number of neurons per optic lobe was plotted for each neuron class (R2= 0.9029, P=<0.0001). For all images, scale bar: 30μm. Dm9 was omitted from the linear model as its spatial origin was uncertain (Table S1).
In the dorsal Optix domain, lineage tracing data suggested that Dm11s are born from both the dorsal Optix and Dpp domains, while Dm8 cells are only found in datasets from the Optix domain (and in very low numbers in the dOptix dataset, see Table S1, Figure 2B, Figure 6A)9. In our immunostains, Dac and Tj label DRA-Dm8s and Dm11s in the dorsal Optix domain, where a subset of these cells is labeled with dpp-driven GFP (Figure 6C–C”’). We conclude that Dpp+/Dac+/Tj+ cells are likely Dm11 neurons, while the Dpp−/Dac+/Tj+ corresponds to DRA-Dm8 neurons (and possibly Dm11 neurons, Figure 6A, 6C–C”). This indicates that dorsal Dm11 neurons, like ventral Dm12 neurons, are born from the intersection between the Dpp and Optix regions.
We could then make a more accurate map of Dm neuron spatial origins (Figure 6D). The most abundant neurons, such as Dm2 and Dm3, are born from most of the main OPC. Less numerous subtypes, such as Dm15, are born from two or so subdomains (such as dorsal Vsx and Optix). Neurons that are smallest in number are born from single subdomains, some of which have even further spatial subdivisions via Dpp signaling. For example, Dm1 and Dm4 are from the posterior 1/3 of the Optix domain (Dpp-), while Dm12 originates from the Dpp+ subregion. The numbers of Dm1 and Dm4 neurons together are roughly the same number as Dm12, which is consistent with the relative size of the domains of origin.
To quantify the relationship between spatial origin and Dm neuron abundance, we measured the size of each neuroepithelial domain of birth for each Dm neuron at late L3 and fitted a linear model against the final number of each Dm neuron (Table S2). Dm neuron number is directly proportional to the size of the spatial domain of origin for each neural class (Figure 6E, R2= 0.9029, P=0.0001). As Dm8s have ~550 neurons and are born from the anterior 2/3 of the ventral Optix domain and the posterior 1/3 of the dorsal Optix domain, they were an outlier in the dataset. This exception is discussed below. Despite this, our data suggest that spatial patterning regulates the size of neuroblast pools that generate each Dm neuron type, providing a mechanism that concurrently regulates cell fate and cell number.
Discussion
A gradient of Dpp signaling acts with other spatial factors to promote cell fates in different proportions
Our data suggest that multiple spatial patterning pathways intersect to specify neuronal classes with differing stoichiometry (Figure 7). The transcription factors Vsx, Optix and Rx mutually inhibit each other’s expression to define spatially restricted domains from which neurons of different fates are born13. Spalt and Disco act orthogonally to dorsoventrally divide the Vsx/Optix/Rx domains26. However, these domains are still large, and are not sufficient to explain how neurons with lower abundance are generated. We show that Dpp signaling regulates Brk expression to generate additional subdomains, which accounts for the fate distinction between Optix-derived Dm8 and Dm1/4/12 neurons. We were not able to identify the spatial domain that distinguishes p vs. yDm8 fate within the Optix/Brk domain; this remains an exciting direction for future study.
Figure 7: Model: Spatial signaling regulates cell proportions.

Three intersecting spatial patterning mechanisms, one using morphogen signaling (Dpp/Brk) and the other two using transcription factor expression (Vsx/Optix/Rx and Salm/Disco+Hh) act to specify Dm neuron fates in different numbers.
Our previous finding that Dpp defines an Rx subdomain was initially surprising13, as Dpp was thought to act non-autonomously to promote cell fate specification. Our data here confirms that Dpp indeed acts canonically; it activates pMad at a distance to define the boundary of its negative target, Brinker, and it splits the Optix domain into smaller compartments. Our overexpression experiments also suggest that Dpp acts as a morphogen, as its ectopic expression appears to change the distribution of cell types generated during development.
In other systems, the Dpp morphogen gradient is converted into discrete domains with sharp boundaries49, as Dpp targets contain binding sites of different affinity for its effector, pMad; these interactions can be further refined by cross-interactions between Dpp targets50. In the OPC, the Brk domain could be determined purely by pMad expression; however, it is also possible that brk and omb mutually repress each other.
Dpp also plays a role in dividing the Optix+ Brk− subdomain. Dorsal Dm11 and ventral Dm12 are produced in the Optix region where Dpp signaling is highest, with lower levels of Dpp signaling in the Optix+Brk−Dpp− domain specifying ventral Dm1/Dm4 and dorsal DRA-Dm8 fates. The lowest levels of Dpp signaling allow for increased Brk expression to specify ventral Dm8 fate.
In another Drosophila visual system region, Dpp and Brk pattern a second neuroepithelial domain, the Inner Proliferation Center. As with the OPC, Omb is expressed in neurons born from the Dpp region, and Brk is expressed in a neuroepithelial domain that is mutually exclusive to Dpp50. These Brk and Dpp domains generate cells that detect global motion in different orientations51. pMad is localized to the Dpp domain, and dpp RNAi lowers pMad levels, expanding the brk domain51–53. Therefore, Dpp signaling acts across two separate optic anlages to promote cell fate specification.
Spatial patterning as a mechanism for regulating cell number
Proliferation and death are considered to be the main cell number regulators. Fat/Hippo signaling is the predominant pathway used to promote proliferation in organ size regulation. Fat regulates the pace of the OPC neuroepithelial to neuroblast transition, thereby regulating the switch between symmetric and asymmetric division; in this model, Fat reduction delays the movement of the proneural wave, thus expanding the neuroepithelium and the overall size of the optic lobe54,55. However, this does not regulate the relative abundance of each neural class.
It is still possible that proliferation regulates cell number in the OPC. For example, a major outlier in the relationship between neuroepithelial domain size and cell number is Dm8, for which ~550 neurons are generated from a restricted Optix subdomain (a number which is currently challenging to estimate, as sources have reported numbers ranging from 350 to 800; Supplementary Table S1)2,7,10: Dm8 might be born from a longer temporal window or use a transit-amplifying cell to generate additional neurons56,57. For example, larval immunostains show that Dm8 neurons represent greater numbers of rows as compared to neuron classes born from all neuroepithelial subdomains (e.g. Mi1, Supplementary Figure S5G). This suggests that additional cell divisions may be used to generate abundant cell types born from smaller subdomains, a finding that may apply to other abundant cell types32.
Apoptosis is also used to regulate cellular abundance. Many classes are generated in excess, allowing the appropriate partners to form circuits while later culling superfluous cells. In the OPC, apoptosis is used to fine-tune neuron number, as we have shown that two types of Dm8s are made in excess to accommodate the variable number of stochastically made y vs. pR7 photoreceptors10. Neurons that do not connect to their partners die by apoptosis. Our work suggests that scaling the size of the neuroepithelial domain of origin can also regulate neuron number. Furthermore, morphogenetic Dpp signaling can allocate differently sized stem cell pools to generate differently sized classes of neurons during development.
Like OPC-derived Dm neurons, other neuron classes are born from sheets of neuroepithelia divided into transcriptionally discrete subdomains. For example, the germinal zone that produces the spinal cord and the ventricular zone of the cerebral cortex are also neuroepithelial structures that exhibit spatially restricted transcription factor expression58,59. These systems also use Dpp signaling to establish transcriptional domains. Possibly the best-known example is the vertebrate spinal cord, where the Dpp homolog BMP signals from the vertebrate roof plate to pattern different classes of spinal cord interneurons based on their distance from the initial signal60,61. As in the OPC, the output of BMP expression is transduced by distinct transcription factor classes62,63. Therefore, it is possible that this mechanism is used in other contexts to regulate neuronal stoichiometry.
Limitations of the Study
The cell types we study are small in number, and it is possible that some clusters in our scRNAseq data may represent multiple cell types. Similarly, our genetic reporter lines are driven by enhancer fragments, which have the potential to label off-target cell types. Due to the scope of the study, we characterized the effect of various cell death mutations within only one cell type; it is possible that other cell types show greater cell number variability across other genetic backgrounds. The dynamic expression patterns of Dpp and Rx required us to rely solely on the genetic reporter line perdurance for scRNAseq-based lineage tracing. This approach may have led to potential inaccuracies in lineage tracing, particularly if the expression of these reporters decreased during pupation. Finally, although spatial patterning is important for cell number regulation; it is not the only mechanism used. A more comprehensive study of the role of proliferation, death and other signaling pathways may provide insight into how cells are generated in distinct proportions.
STAR Methods:
Lead contact
To obtain information about/resources from this paper, please e-mail the lead contact, Claude Desplan (cd38@nyu.edu).
Materials availability
Antibodies and fly lines will be distributed from our lab.
Data and code availability
Microscopy data will be shared through the Lead Contact. Code written for analysis of single-cell RNAseq data, as well as for calculation of neuroepithelial cell density, is available on GitHub (https://github.com/jennifermalin/Malinetal2024). Single-cell RNAseq data is available in Simon et al., 202432.
Experimental model and study participant details
Drosophila melanogaster strains
See the key resources table for a complete list of stocks used. Drosophila melanogaster flies were grown on standard cornmeal medium at 25°C 12-hour light/dark cycles (except when specified in listed experiments). Both male and female flies were analyzed for each genotype, but no sex-specific differences were noted. The detailed genotype for each figure is given in Table S3. Rx-T2A-GAL4-RFP C-terminal knock-in was generated by WellGenetics (Taipei, Taiwan). The company created a gRNA plasmid with a U6 promoter (see Key Resources Table for gRNA sequence). A pUC57-Kan T2A-GAL4 plasmid containing a LoxP-flanked Hsp70 3’UTR, 3XP3-RFP reporter cassette and two homology arms was cloned. The strain w1118;; was injected with gRNA, hs-Cas9 and the donor plasmid. F1 screening was performed using presence of 3XP3-RFP; reporter cassette was later removed using hs-Cre.
Resource Availability
| REAGENT or RESOURCE | SOURCE | IDENTIFIER |
|---|---|---|
| Antibodies | ||
| Chicken Anti-β-gal | Abcam | Catalog #9361 |
| Rabbit Anti-GFP | Life Technologies | Catalog #11122 |
| Sheep Anti-GFP | Bio-Rad | Catalog #4745-1051 |
| Chicken Anti-GFP | Millipore Sigma | Catalog #06-896 |
| Rabbit Anti-RFP | MBL | Catalog #PM005 |
| Mouse Anti-RFP | MBL | Catalog #M155-3 |
| Rabbit Anti-HA | Cell Signaling Technologies | Catalog #C29F4 |
| Rat Anti-Flag | Novus Biologicals | Catalog #NBP1-06712 |
| Rabbit Anti-Eyeless | Genscript/Desplan Lab | N/A |
| Mouse Anti-Eyeless | DSHB | Anti-Eyeless-s |
| Rabbit Anti-p-Smad3 | Abcam | Catalog #ab52903 |
| Rat Anti-NCadherin | DSHB | DN-Ex #8 |
| Guinea Pig Anti-Traffic Jam | D. Godt | N/A |
| Guinea Pig Anti-Otd | Genscript/Desplan Lab | N/A |
| Rabbit Anti-Dve | F. Matsuzaki | N/A |
| Rabbit Anti-SoxN | Genscript/Desplan Lab | N/A |
| Mouse Anti-Islet/Tup | DSHB | 40.3A4 |
| Rabbit Anti-Vsx2 | Genscript/Desplan Lab | N/A |
| Mouse Anti-V5-tag:DyLight550 | Bio-Rad | Catalog #MCA1360D550GA |
| Guinea Pig Anti-Lim3 | J. Skeath | N/A |
| Mouse anti-Svp | DSHB | Catalog #5B11 |
| Guinea Pig Anti-Scro | Genscript/Desplan Lab | N/A |
| Mouse Anti-Dac | DSHB | mAbdac-2-3 |
| Guinea Pig Anti-Dac | Genscript/Desplan Lab | N/A |
| Guinea Pig Anti-Otd | Genscript/Desplan Lab | N/A |
| Rat Anti-Otd | Desplan Lab | N/A |
| Rabbit Anti-Toy | Genscript/Desplan Lab | N/A |
| Rat Anti-Toy | Genscript/Desplan Lab | N/A |
| Rabbit Anti-Optix | Genscript/Desplan Lab | N/A |
| Guinea Pig Anti-Brinker | R. Mann | N/A |
| Rabbit Anti-Distal-less | Genscript/Desplan Lab | N/A |
| Rabbit Anti-Grh | Stefan Thor | N/A |
| Guinea Pig Anti-Vsx1 | Genscript/Desplan Lab | N/A |
| AlexaFluor405 conjugated Goat Anti-HRP | Jackson ImmunoResearch | Code #123-475-021 |
| AlexaFluor647 conjugated Goat Anti-HRP | Jackson ImmunoResearch | Code #123-605-021 |
| Donkey Anti Rat 405 | Jackson ImmunoResearch | Code # 712-475-150 |
| Donkey Anti Rabbit 405 | Jackson ImmunoResearch | Code #711-475-152 |
| Donkey Anti Mouse 405 | Jackson ImmunoResearch | Code #711-475-150 |
| Donkey Anti Sheep A488 | Jackson ImmunoResearch | Code #713-545-147 |
| Donkey Anti Chicken A488 | Jackson ImmunoResearch | Code #703-545-155 |
| Donkey Anti Rabbit A488 | Jackson ImmunoResearch | Code #711-545-152 |
| Donkey Anti Mouse A488 | Jackson ImmunoResearch | Code #715-545-151 |
| Donkey Anti Guinea pig A488 | Jackson ImmunoResearch | Code #706-545-148 |
| Donkey Anti Mouse A555 | Thermo Scientific | Catalog #A-31570 |
| Donkey Anti Rabbit A555 | Thermo Scientific | Catalog #A-31572 |
| Donkey Anti Chicken Cy3 | Jackson ImmunoResearch | Code # 703-165-155 |
| Donkey Anti Guinea pig Cy3 | Jackson ImmunoResearch | Code #706-165-148 |
| Donkey Anti Rat Cy3 | Jackson ImmunoResearch | Code #712-165-153 |
| Donkey Anti Guinea pig A647 | Jackson ImmunoResearch | Code #706-605-148 |
| Donkey Anti Rabbit A647 | Jackson ImmunoResearch | Code #711-605-152 |
| Donkey Anti Mouse A647 | Jackson ImmunoResearch | Code #715-605-151 |
| Donkey Anti Rat A647 | Jackson ImmunoResearch | Code #712-605-153 |
| Chemicals, peptides, and recombinant proteins | ||
| SlowFade Gold | Thermo Scientific | Catalog #S36936 |
| Vectashield without DAPI | Vector Lab | H-1000 |
| Critical commercial assays | ||
| Chromium Next GEM Single Cell 3’ Kit v3.1 | 10x Genomics | Product code #1000268 |
| Deposited data | ||
| Raw and analyzed data | Simon et al., 202432 | GEO: GSE254562 |
| Experimental models: Organisms/strains | ||
| Fly: D. melanogaster: w, 20xUAS-flpG5::Pest; sp/Cyo; TM2/TM6B | Bloomington | Stock #55807 |
| Fly: D. melanogaster: ;;Act5C-FRT-StopFRTlacZ.nls | Bloomington | Stock #6355 |
| Fly: D. melanogaster: w;;13xLexAop2-CD8::GFP | Bloomington | Stock #32203 |
| Fly: D. melanogaster: w; 13xLexAop2-CD8::GFP; | Bloomington | Stock #32205 |
| Fly: D. melanogaster: ;; Pxb-GAL4 | Desplan lab, from MI05058 (Courgeon and Desplan 201910) | N/A |
| Fly: D. melanogaster: Optix-GAL4NP2631 | Kyoto | Stock #104266 |
| Fly: D. melanogaster: ;; hh-GAL4 | Bloomington | Stock #67046 |
| Fly: D. melanogaster: w1118; R22D12-LexA | Bloomington | Stock #52670 |
| Fly: D. melanogaster: w1118; R20D11-LexA | Bloomington | Stock #52565 |
| Fly: D. melanogaster: w1118; R24F10-LexA | Bloomington | Stock #52696 |
| Fly: D. melanogaster: w1118; R24F06-LexA | Bloomington | Stock #52695 |
| Fly: D. melanogaster: w1118; R42H01-LexA | Bloomington | Stock #54204 |
| Fly: D. melanogaster: w1118; R11C05-LexA | Bloomington | Stock #54608 |
| Fly: D. melanogaster: w1118; R47G08-LexA | Bloomington | Stock #52793 |
| Fly: D. melanogaster: w1118; R18G08-LexA | Bloomington | Stock #52533 |
| Fly: D. melanogaster: w1118; R23C03-LexA | Bloomington | Stock #61523 |
| Fly: D. melanogaster: yw; 10xUAS-myr-GFP; | Bloomington | Stock #32198 |
| Fly: D. melanogaster: If/CyO; UAS-p35 | Bloomington | Stock #5073 |
| Fly: D. melanogaster: ;Elav-GAL4/Cyo-GFP; Dr/TM6C | From Lin and Goodman, 199464 | N/A |
| Fly: D. melanogaster: w1118;; R22D12-GAL4 | Bloomington | Stock #48983 |
| Fly: D. melanogaster: w1118;; R26H07-GAL4 | Bloomington | Stock #69854 |
| Fly: D. melanogaster: w1118;; R20D11-GAL4 | Bloomington | Stock #47891 |
| Fly: D. melanogaster: w1118;; R24F10-GAL4 | Bloomington | Stock #49090 |
| Fly: D. melanogaster: w1118;; R24F06-GAL4 | Bloomington | Stock #49087 |
| Fly: D. melanogaster: w1118;; R42H01-GAL4 | Bloomington | Stock #48150 |
| Fly: D. melanogaster: w1118;; R11C05-GAL4 | Bloomington | Stock #48291 |
| Fly: D. melanogaster: w1118;; R47G08-GAL4 | Bloomington | Stock #50328 |
| Fly: D. melanogaster: w1118; R38A07-GAL4 | Bloomington | Stock #49978 |
| Fly: D. melanogaster: w1118; R47E05-GAL4 | Bloomington | Stock #50312 |
| Fly: D. melanogaster: w1118;; R18G08-GAL4 | Bloomington | Stock #47877 |
| Fly: D. melanogaster: w1118;; R58G11-GAL4 | Bloomington | Stock #39195 |
| Fly: D. melanogaster: w1118;; VT043152-GAL4 | Vienna Tile | VDRC201362 |
| Fly: D. melanogaster: w; UAS-mir(rpr, hid, grim)/CyO; Dr/TM6C | Iswar Hariharan | N/A |
| Fly: D. melanogaster: ;UAS-Dronc-DN (C318G); | Helena Richardson/Nick Baker | N/A |
| Fly: D. melanogaster: ;; UAS-Dronc-RNAi | Vienna Tile | VDRC100424 |
| Fly: D. melanogaster: tj-GAL4NP1624 | Kyoto | Stock #104055 |
| Fly: D. melanogaster: ;;Ubi>>stinger, UAS-Flp | Bloomington | Stock #28282 |
| Fly: D. melanogaster: ;ubi>>stinger; | Bloomington | Stock #32250 |
| Fly: D. melanogaster: ;; dpp-GAL4 | Bloomington | Stock #1553 |
| Fly: D. melanogaster: w;UAS-Stinger; | Bloomington | Stock #84277 |
| Fly: D. melanogaster: ;;UAS-sf-GFP-nls-PEST-2AB2ase | Desplan Lab | N/A |
| Fly: D. melanogaster: yw, hsFlp, tub>>GAL4; UAS-EGFP; | Bloomington | Stock #64767 |
| Fly: D. melanogaster: brk3sB-GAL4;; | Bloomington | Stock #53707 |
| Fly: D. melanogaster: w; UAS-dpp/TM3,sb,ser | Bloomington | Stock #53716 |
| Fly: D. melanogaster: UAS-brk.J | Bloomington | Stock #36536 |
| Fly: D. melanogaster: w118, GMR57C10-FLPL; 10xUAS-MCFO (HA, V5, FLAG) (MCFO3) | Bloomington | Stock #64087 |
| Fly: D. melanogaster: yv;; UAS-dpp RNAi | Bloomington | Stock #36799 |
| Fly: D. melanogaster: y,sc,sev,v; UAS-brk RNAi/CyO; | Bloomington | Stock #80438 |
| Fly: D. melanogaster: AprK568-LacZ/CyO | Bloomington | Stock #5374 |
| Fly: D. melanogaster: w; dvGlut-T2A-QF2, QUAS-LacZ/CyO-DG4; Dr/TM6B (Sb, DG4) | Matthias Landgraf | N/A |
| Fly: D. melanogaster: w1118; salr-T2A-VP16AD/(CyO) | Ted Erclik | N/A |
| Fly: D. melanogaster: w1118, disco-T2A-VP16AD/(FM7c) | Ted Erclik | N/A |
| Fly: D. melanogaster: w1118; optix-T2A-GAL4-DBD/(CyO); | Ted Erclik | N/A |
| Fly: w; UAS-redStinger, UAS-Flp, ubi>stop>nlsGFP (stinger)/CyO-GFP | Bloomington; added Cyo-GFP | Stock #64087 |
| Fly: yw, UAS-Flp; Gal80ts/Cyo; Act>y+>lexA,13XlexAop-myr-GFP/Tm6B | Desplan Lab (Bertet et al., 201423) | N/A |
| Fly: w; Ets65A:GFP | Bloomington | Stock #38640 |
| Fly: w1118; Rx-T2A-GAL4/CyO; | WellGenetics | This paper |
| Oligonucleotides | ||
| Oligo for Rx-T2A-GAL4 gRNA cloning Forward 5’- CTTCGCACTTAGCTAGGAACCGAC | WellGenetics | This paper |
| Oligo for Rx-T2A-GAL4 gRNA cloning Reverse 5’- AAACGTCGGTTCCTAGCTAAGTGC | WellGenetics | This paper |
| Software and algorithms | ||
| Fiji | Schindelin et al., 201265 | https://fiji.sc |
| Imaris | RRID:SCR_007370 | http://www.bitplane.com/imaris/imaris |
| Microsoft Excel | RRID: SCR_016137 | https://www.microsoft.com/en-us/microsoft-365/excel |
| Seurat (v.4.0.1) | RRID: SCR_016341 | https://satijalab.org/seurat/ |
| R (v4.2.0) | RRID: SCR_001905 | https://cran.r-project.org/ |
| GraphPad Prism | RRID: SCR_002798 | https://www.graphpad.com/ |
| Code for quantification of neuroepithelial density | This paper | 10.5281/zenodo.10558145 |
| Code for spatial domain scRNAseq | This paper | 10.5281/zenodo.10558145 |
| Other | ||
| Cell Culture Petri Dish | Thermo Scientific | Catalog #171099 |
Method details
Immunohistochemistry
Fly optic lobes were dissected in PBS and fixed for 15 minutes in 4% formaldehyde (v/w) in 1× PBS at 4°C. After 3 quick washes in 1× PBS, brains were blocked in 1× PBS + 0.4% Triton X-100 (PBST) + 0.5%−5% goat serum for 20 minutes. They were then incubated for 2 days at 4°C in primary antibodies diluted in PBST + 0.5% goat serum. After 3 quick washes in PBST + 2 15-minute washes in PBST, brains were incubated for 1–2 days with secondary antibodies diluted in PBST. After washes, brains were mounted in Slowfade or Vectashield and imaged on a Leica SP8 confocal microscope.
Stage-specific lineage tracing
To label progenies of Dpp-expressing neuroepithelial cells, we crossed w;; Dpp-Gal4/TM6B, Tb with 20XUAS-FlpG5::PEST; tub-Gal80[ts]/CyO; act>y+>lexA, 13XlexAop-myr::GFP. The cross is kept at 18°C and underwent an 8-hour temperature shift to 29°C at the mid-third larval instar (4-day incubation at 18°C before dissection) and the late-third larval instar (1-day incubation at 18°C before dissection).
Antibody dilutions
The following primary antibodies were used for immunofluorescence: rat anti-Ncadherin (1:50, DSHB), guinea pig anti-Traffic Jam (1:2500, D. Godt), guinea pig anti-Otd (1:500, Genscript), rabbit anti-Dve (1:1000, F. Matsuzaki), rabbit anti-SoxN (1:250, Genscript), rabbit anti-GFP (1:400, Invitrogen), chicken anti-GFP (1:400, EMD), sheep anti-GFP (1:500, BioRad), mouse anti-RFP (1:400, MBL), mouse Anti-V5-tag:DyLight550 (1:50, BioRad), rat anti-FLAG (1:50, Novus), rabbit anti-HA (1:50, Cell Signaling Technologies), rabbit anti-Eyeless (1:200, Genscript), mouse anti-Eyeless (1:10, DSHB), mouse anti-Islet/Tup (1:100, DSHB), chicken anti-beta-Gal (1:500, Abcam), mouse anti-Svp (1:20, DSHB), guinea pig anti-Scro (1:100, Genscript), mouse anti-Dac (1:20, DSHB, mAbdac2-3), guinea pig anti-Dac (1:1000, Genscript), rabbit anti-Toy (1:300, Genscript), rat anti-Toy(1:50, Genscript), rabbit anti-Optix (1:200, Genscript), rabbit anti-p-Smad3 (1:500, Abcam), rabbit anti-Brk (1:200, R. Mann), rabbit anti-Vsx2 (1:1000, Genscript), guinea pig anti-Vsx1 (1:100, Genscript), guinea pig anti-Lim3 (1:500, J. Skeath), rabbit anti-distal-less (1:400, Genscript), rat anti-Grh (1:500, Stefan Thor), and AlexaFluor405 conjugated Goat Anti-HRP (Jackson ImmunoResearch, 1:100). Secondary antibodies are from Invitrogen and used at 1:200.
Quantification and Statistical Analyses
Male and female larvae at similar stages were selected randomly from the fly vials for all experiments. Blinded analysis across different genotypes was not performed, as the genotype can be distinguished by the experimenter. All immunohistochemistry experiments were performed in at least 3 different biological replicates (brains of different flies) for each genotype, which is in line with experiments from other scientists in the field. Apoptosis inhibition led to aberrant neuron targeting. To distinguish between off-target labeling and aberrantly targeting neurons, we only counted cells that were the same size as normally targeting neurons, and we only counted cells that were closest in proximity to normally targeting neurons. Quantification of Dm1/4/12 vs. Dm8/11 cell number (as well as Tj+ cell number) was calculated using the “Spots” function on Imaris (Oxford Instruments); only neurons within the Z-plane of the medulla were counted. For all T-tests, a two-tailed T test was performed. T-tests, Chi-square analysis and linear regression were all performed using GraphPad Prism. Averages and standard deviation/standard error of the mean were calculated using Microsoft Excel.
Co-expression by segmentation
To visualize the spatial distribution of Dm2 (Vsx1+/Dll+), we used Imaris (Oxford Instruments) to first segment Vsx1-expressing cells with the “object detection with surface model” module. Both intensity and quality threshold were determined algorithmically. The segmented surface objects were used as a mask for the Dll channel, and the masked Dll channel were further processed with the “object detection with surface model” module with algorithmically determined thresholds to obtain surface rendering of Vsx1+/Dll+ cells. Using optic lobe neuropils (marked by N-Cadherin) as anatomical landmarks, an ROI was set to keep only the medulla cortex but not the lamina or lobula plug neurons. Vsx1+/Dll+ objects within the ROIs were then visualized with and without the original immunostain signal.
Cell Density Estimation of OPC Domains
Optic lobes of wandering larvae (late 3rd larval instar) were harvested and stained (see Immunostain) with Grh (marking neuroepithelial cells), Vsx1, Optix, and Rx. Vsx1 and Rx were both from guinea pigs and thus in the same channel. Brains were mounted to acquire sagittal optical sections, and Z-stacks contain the whole OPC. Imaris (Oxford Instruments) were used to segment neuroepithelial cells by Grh intensity semi-automatically with the “object detection with surface model” module. A region of interest representing the OPC is manually drawn per brain by anatomical landmarks. Then, within the OPC ROI, Intensity cutoff for Grh was set at 350 A.U. while the quality score cutoff was determined algorithmically. Raw intensity of Vsx1/Rx and Optix staining was acquired per neuroepithelial cell object and exported. Measured intensity was imported into R (v4.3.1). Domain identity is assigned by first estimating P(Optix) and P(Vsx/Rx) Gaussian mixture model (Scrucca et al.66). Cells that have a P(Optix) * (1 - P(Vsx/Rx)) > 0.3 are assigned as Optix, while anterior non-Optix cells were assigned as Vsx and posterior non-Optix cells were assigned as Rx. Cell density is estimated as multivariate Gaussian kernel density of centroids of each cell object in space (Chacón and Duong67). To examine if cell density differs between domains, median cell density per domain was calculated for each OPC (N = 3), and a Kruskal-Wallis test is performed with the significance threshold set at 0.05.
Image Acquisition and Processing
All images were captured on a Leica SP8 Confocal Microscope. Images were analyzed in FIJI (ImageJ) and Imaris.
scRNAseq
The raw data was obtained from Simon et al., 202432. Briefly, we acquired the data by producing lines expressing a nuclear GFP in neurons from the Optix, vOptix, hh, dpp and pxb regions of the mOPC, sorting the labelled cells by FACS, and performing single-cell mRNA sequencing on the obtained cell suspension.
The raw data was then analyzed using Seurat 4.0.1. For each library, a Seurat Object was created with all genes expressed at least in 3 cells, and all cells expressing at least 200 genes. The objects were then filtered by keeping all cells below a percent of mitochondrial genes, below a specific number of UMIs, and above a number of genes, based on the distribution of these parameters32. The threshold chosen were identical for all libraries acquired a given day with flies of a given genotype, but were different otherwise. For the 3 Optix libraries the thresholds were 7/17000/800 (percent of mitochondrial genes, number of UMIs, number of genes), for the 2 vOptix libraries 10/10000/500, for the 2 dOptix libraries 5/20000/1000, for the 2 hh libraries 10/20000/700, for the 2 dpp libraries 5/20000/900, for the pxb library 5/30000/1300. After filtering, the number of cells in each library was 5532 (Optix 1), 6786 (Optix 2), 6718 (Optix 3), 5175 (vOptix 1), 5421 (vOptix 2), 6182 (dOptix1), 6120 (dOptix2), 4433 (hh 1), 4749 (hh 2), 6127 (dpp 1), 6735 (dpp 2), 4988 (pxb). For each library we then ran NormalizeData, FindVariableFeatures and ScaleData with default parameters, as well as RunPCA, RunTSNE and RunUMAP with defaults parameters and a dimensionality of 150. Dimensionality reductions were run purely for visualization purposes: these were not used to annotate the dataset, and neither did we perform any clustering. Instead, we used the normalized expression of marker genes and the neural network classifier built and presented in Ozel et al.(2021)31 to assign each cell of each library to its corresponding cluster in our published single-cell atlas (metadata fields “NN_Cluster_Number”), and to give this assignment a confidence score between 0 and 1 (metadata field “Confidence_NN_Cluster_Number”). For all figures, we replaced cluster numbers by cluster annotations (metadata fields “Annotation”) previously published in Ozel et al. (2021)31, except for Dm15 cluster that we newly identified (Fig. 2B).
For each dataset, if at least 80% of the cells of a given class (group of cells with the same annotation) were annotated with a confidence score strictly below 0.5, the class was flagged as “low confidence”.
Then, we normalized class (group of cells with the same annotation) abundances to allow us to compare them between libraries. To do so, we used the abundances of neuronal clusters produced in the whole mOPC, since they represent a constant between mOPC regions. In each library of our spatial origin datasets, as well as our single cell atlas, we therefore divided the abundance of each class by the abundance of neuronal clusters T1, Mi1, Tm1, Tm2, Tm4, and Tm6, which were produced in all mOPC regions as determined previously32. We then averaged these normalized abundances and plotted them, as well as the minimal and maximal abundances, on Figure 2B and Figure 6A. Finally, for each dataset, we flagged classes containing either 3 cells or less, or for which at least 80% of the cells were annotated with a confidence score strictly below 0.5.
Correlation of spatial subdomain with Dm neuron number
GFP-expressing lines for each spatial factor were imaged and each spatial domain was measured at its widest point; its area was then calculated (using the lasso tool in ImageJ/FIJI). Each neuron was given a spatial identity, which was then further characterized if the neuron was born from a smaller spatial subdomain (i.e., Dm4 from 1/6 of the ventral Optix domain). The linear plot of OPC subdomain of origin vs. number of neurons per optic lobe was then plotted for each neuron class. A linear regression was performed, and R-square and P value were calculated using Microsoft Excel and GraphPad Prism.
Supplementary Material
Document S1. Figures S1–S7 and supplemental references.
Table S1: Summary of Dm neuron predicted origins, related to Figure 2. Description of Dm spatial origins using three separate methods and the reasoning used for each assignment.
Table S2: Neuroepithelial density calculations for each spatial domain, related to Figure S5. Grh-stained L3 optic lobes were co-stained for Vsx1, Optix and Rx and regions of interest were drawn for each spatial subdomain; cell density per domain was then calculated.
Table S3: Genotypes of flies used in this study, related to STAR Methods.
Highlights:
The Drosophila visual system neuroepithelium exhibits spatial patterning.
We identified the spatial origins of distinct fly inhibitory interneuron classes.
Spatial domain size correlates with the number of neurons generated for each class.
Dpp and Brk signals regulate cell number orthogonally to existing spatial patterning.
Acknowledgments:
We thank members of the Desplan lab for providing helpful discussions and feedback on the manuscript; I. Holguera for advice on Dm transcription factor markers; R. Rajesh and S. Cordoba for advice on figures; R. El-Danaf and K. Kapuralin for advice on Dm6/17 origins; I. Hariharan, N. Baker, H. Richardson, M. Landgraf, P. Valentino, and T. Erclik for fly lines; and D. Godt, F. Matsuzaki, S. Thor, and R. Mann for antibodies. This work was supported by NIH grant EY13010 and EY13012 to C.D. J.M was supported by NIH fellowships from the National Eye Institute (F32EY028012 and K99EY032269). F.S. was supported by New York University (MacCracken Fellowship and Dean’s Dissertation Ph.D. Fellowship). Y.-C.C. was supported by New York University (MacCracken Fellowship), by a NYSTEM institutional training grant (Contract #C322560GG), and by Scholarship to Study Abroad from the Ministry of Education, Taiwan. This work also benefited from antibodies and Drosophila lines generated with the support of the CGSB at NYU in Abu Dhabi.
Footnotes
Publisher's Disclaimer: This is a PDF file of an unedited manuscript that has been accepted for publication. As a service to our customers we are providing this early version of the manuscript. The manuscript will undergo copyediting, typesetting, and review of the resulting proof before it is published in its final form. Please note that during the production process errors may be discovered which could affect the content, and all legal disclaimers that apply to the journal pertain.
Declaration of Interests
The authors declare no competing interests.
References:
- 1.Yan W, Laboulaye MA, Tran NM, Whitney IE, Benhar I, and Sanes JR (2020). Mouse Retinal Cell Atlas: Molecular Identification of over Sixty Amacrine Cell Types. Journal of Neuroscience 40, 5177–5195. 10.1523/JNEUROSCI.0471-20.2020. [DOI] [PMC free article] [PubMed] [Google Scholar]
- 2.Nern A, Pfeiffer BD, and Rubin GM (2015). Optimized tools for multicolor stochastic labeling reveal diverse stereotyped cell arrangements in the fly visual system. Proceedings of the National Academy of Sciences 112, E2967–E2976. 10.1073/pnas.1506763112. [DOI] [PMC free article] [PubMed] [Google Scholar]
- 3.Sanes JR, and Zipursky SL (2010). Design Principles of Insect and Vertebrate Visual Systems. Neuron 66, 15–36. 10.1016/j.neuron.2010.01.018. [DOI] [PMC free article] [PubMed] [Google Scholar]
- 4.Morante J, and Desplan C (2008). The color-vision circuit in the medulla of Drosophila. Current biology : CB 18, 553–565. 10.1016/j.cub.2008.02.075. [DOI] [PMC free article] [PubMed] [Google Scholar]
- 5.Fischbach KF, and Dittrich APM (1989). The optic lobe of Drosophila melanogaster. I. A Golgi analysis of wild-type structure. Cell and Tissue Research 258, 441–475. 10.1007/BF00218858. [DOI] [Google Scholar]
- 6.Bausenwein B, Dittrich APM, and Fischbach KF (1992). The optic lobe of Drosophila melanogaster - II. Sorting of retinotopic pathways in the medulla. Cell and Tissue Research 267, 17–28. 10.1007/BF00318687. [DOI] [PubMed] [Google Scholar]
- 7.Matsliah A, Yu SC, Kruk K, Bland D, Burke A, Gager J, Hebditch J, Silverman B, Willie K, Willie R, et al. (2023). Neuronal “parts list” and wiring diagram for a visual system. bioRxiv. 10.1101/2023.10.12.562119. [DOI] [PMC free article] [PubMed] [Google Scholar]
- 8.Gao S, Takemura S. y., Ting C-Y, Huang S, Lu Z, Luan H, Rister J, Thum AS, Yang M, Hong S-T, et al. (2008). The Neural Substrate of Spectral Preference in Drosophila. Neuron 60, 328–342. 10.1016/j.neuron.2008.08.010. [DOI] [PMC free article] [PubMed] [Google Scholar]
- 9.Takemura SY, Xu CS, Lu Z, Rivlin PK, Parag T, Olbris DJ, Plaza S, Zhao T, Katz WT, Umayam L, et al. (2015). Synaptic circuits and their variations within different columns in the visual system of Drosophila. Proceedings of the National Academy of Sciences of the United States of America 112, 13711–13716. 10.1073/pnas.1509820112. [DOI] [PMC free article] [PubMed] [Google Scholar]
- 10.Courgeon M, and Desplan C (2019). Coordination between stochastic and deterministic specification in the Drosophila visual system. Science 366, eaay6727–eaay6727. 10.1126/science.aay6727. [DOI] [PMC free article] [PubMed] [Google Scholar]
- 11.Kind E, Longden KD, Nern A, Zhao A, Sancer G, Flynn MA, Laughland CW, Gezahegn B, Ludwig HDF, Thomson AG, et al. (2021). Synaptic targets of photoreceptors specialized to detect color and skylight polarization in Drosophila. eLife 10. 10.7554/eLife.71858. [DOI] [PMC free article] [PubMed] [Google Scholar]
- 12.Hofbauer A, and Campos-Ortega JA (1990). Proliferation pattern and early differentiation of the optic lobes in Drosophila melanogaster. Roux’s Archives of Developmental Biology 198, 264–274. 10.1007/BF00377393. [DOI] [PubMed] [Google Scholar]
- 13.Erclik T, Li X, Courgeon M, Bertet C, Chen Z, Baumert R, Ng J, Koo C, Arain U, Behnia R, et al. (2017). Integration of temporal and spatial patterning generates neural diversity. Nature 541, 365–370. 10.1038/nature20794. [DOI] [PMC free article] [PubMed] [Google Scholar]
- 14.Yasugi T, Umetsu D, Murakami S, Sato M, and Tabata T (2008). Drosophila optic lobe neuroblasts triggered by a wave of proneural gene expression that is negatively regulated by JAK/STAT. Development 135, 1471–1480. 10.1242/dev.019117. [DOI] [PubMed] [Google Scholar]
- 15.Egger B, Boone JQ, Stevens NR, Brand AH, and Doe CQ (2007). Regulation of spindle orientation and neural stem cell fate in the Drosophila optic lobe. Neural development 2, 1–1. 10.1186/1749-8104-2-1. [DOI] [PMC free article] [PubMed] [Google Scholar]
- 16.Egger B, Gold KS, and Brand AH (2010). Notch regulates the switch from symmetric to asymmetric neural stem cell division in the Drosophila optic lobe. Development 137, 2981–2987. 10.1242/dev.051250. [DOI] [PMC free article] [PubMed] [Google Scholar]
- 17.Doe CQ, Chu-LaGraff Q, Wright DM, and Scott MP (1991). The prospero gene specifies cell fates in the drosophila central nervous system. Cell 65, 451–464. 10.1016/0092-8674(91)90463-9. [DOI] [PubMed] [Google Scholar]
- 18.Li X, Erclik T, Bertet C, Chen Z, Voutev R, Venkatesh S, Morante J, Celik A, and Desplan C (2013). Temporal patterning of Drosophila medulla neuroblasts controls neural fates. Nature 498, 456–462. 10.1038/nature12319. [DOI] [PMC free article] [PubMed] [Google Scholar]
- 19.Konstantinides N, Holguera I, Rossi AM, Escobar A, Dudragne L, Chen YC, Tran TN, Martínez Jaimes AM, Özel MN, Simon F, et al. (2022). A complete temporal transcription factor series in the fly visual system. Nature 604, 316–322. 10.1038/s41586-022-04564-w. [DOI] [PMC free article] [PubMed] [Google Scholar]
- 20.Zhu H, Zhao SD, Ray A, Zhang Y, and Li X (2022). A comprehensive temporal patterning gene network in Drosophila medulla neuroblasts revealed by single-cell RNA sequencing. Nature Communications 13. 10.1038/s41467-022-28915-3. [DOI] [PMC free article] [PubMed] [Google Scholar]
- 21.Suzuki T, Kaido M, Takayama R, and Sato M (2013). A temporal mechanism that produces neuronal diversity in the Drosophila visual center. Developmental Biology 380, 12–24. 10.1016/j.ydbio.2013.05.002. [DOI] [PubMed] [Google Scholar]
- 22.Hasegawa E, Kitada Y, Kaido M, Takayama R, Awasaki T, Tabata T, and Sato M (2011). Concentric zones, cell migration and neuronal circuits in the Drosophila visual center. Development 138, 983–993. 10.1242/dev.058370. [DOI] [PubMed] [Google Scholar]
- 23.Bertet C, Li X, Erclik T, Cavey M, Wells B, and Desplan C (2014). Temporal Patterning of Neuroblasts Controls Notch-Mediated Cell Survival through Regulation of Hid or Reaper. Cell 158, 1173–1186. 10.1016/j.cell.2014.07.045. [DOI] [PMC free article] [PubMed] [Google Scholar]
- 24.Erclik T, Hartenstein V, Lipshitz HD, and McInnes RR (2008). Conserved Role of the Vsx Genes Supports a Monophyletic Origin for Bilaterian Visual Systems. Current Biology 18, 1278–1287. 10.1016/j.cub.2008.07.076. [DOI] [PubMed] [Google Scholar]
- 25.Gold KS, and Brand AH (2014). Optix defines a neuroepithelial compartment in the optic lobe of the Drosophila brain. Neural Development 9, 18–18. 10.1186/1749-8104-9-18. [DOI] [PMC free article] [PubMed] [Google Scholar]
- 26.Valentino P, and Erclik T (2022). Spalt and disco define the dorsal-ventral neuroepithelial compartments of the developing Drosophila medulla. Genetics 222. 10.1093/genetics/iyac145. [DOI] [PMC free article] [PubMed] [Google Scholar]
- 27.Chang T, Mazotta J, Dumstrei K, Dumitrescu A, and Hartenstein V (2001). Dpp and Hh signaling in the Drosophila embryonic eye field. Development (Cambridge, England) 128, 4691–4704. [DOI] [PubMed] [Google Scholar]
- 28.Suzuki T, Trush O, Yasugi T, Takayama R, and Sato M (2016). Wnt Signaling Specifies Anteroposterior Progenitor Zone Identity in the Drosophila Visual Center. The Journal of neuroscience : the official journal of the Society for Neuroscience 36, 6503–6513. [DOI] [PMC free article] [PubMed] [Google Scholar]
- 29.Kaphingst K, and Kunes S (1994). Pattern formation in the visual centers of the Drosophila brain: wingless acts via decapentaplegic to specify the dorsoventral axis. Cell 78, 437–448. 10.1016/0092-8674(94)90422-7. [DOI] [PubMed] [Google Scholar]
- 30.Minami M, Kinoshita N, Kamoshida Y, Tanimoto H, and Tabata T (1999). brinker is a target of Dpp in Drosophila that negatively regulates Dpp-dependent genes. Nature 398, 242–246. 10.1038/18451. [DOI] [PubMed] [Google Scholar]
- 31.Özel MN, Simon F, Jafari S, Holguera I, Chen Y-C, Benhra N, El-Danaf RN, Kapuralin K, Malin JA, Konstantinides N, and Desplan C (2021). Neuronal diversity and convergence in a visual system developmental atlas. Nature 589, 88–95. 10.1038/s41586-020-2879-3. [DOI] [PMC free article] [PubMed] [Google Scholar]
- 32.Simon F, Holguera I, Chen Y-C, Malin J, Valentino P, Erclik T, and Desplan C (2024). High-throughput identification of the spatial origins of Drosophila optic lobe neurons using single-cell mRNA-sequencing. bioRxiv. 10.1101/2024.02.05.578975. [DOI] [Google Scholar]
- 33.Conlon I, and Raff M (1999). Size control in animal development. Cell 96, 235–244. 10.1016/S0092-8674(00)80563-2. [DOI] [PubMed] [Google Scholar]
- 34.Oppenheim RW (1991). Cell Death During Development of the Nervous System. Annual Review of Neuroscience 14, 453–501. 10.1146/annurev.ne.14.030191.002321. [DOI] [PubMed] [Google Scholar]
- 35.Xu S, Xiao Q, Cosmanescu F, Sergeeva AP, Yoo J, Lin Y, Katsamba PS, Ahlsen G, Kaufman J, Linaval NT, et al. (2018). Interactions between the Ig-Superfamily Proteins DIP-α and Dpr6/10 Regulate Assembly of Neural Circuits. Neuron 100, 1369–1384.e1366. 10.1016/j.neuron.2018.11.001. [DOI] [PMC free article] [PubMed] [Google Scholar]
- 36.Menon KP, Kulkarni V, Takemura S. y., Anaya M, and Zinn K (2019). Interactions between Dpr11 and DIP-γ control selection of amacrine neurons in Drosophila color vision circuits. eLife 8, e48935–e48935. 10.7554/eLife.48935. [DOI] [PMC free article] [PubMed] [Google Scholar]
- 37.Togane Y, Ayukawa R, Hara Y, Akagawa H, Iwabuchi K, and Tsujimura H (2012). Spatio-temporal pattern of programmed cell death in the developing Drosophila optic lobe. Development, growth & differentiation 54, 503–518. [DOI] [PubMed] [Google Scholar]
- 38.Clem RJ, and Miller LK (1994). Control of programmed cell death by the baculovirus genes p35 and iap. Molecular and Cellular Biology 14, 5212–5222. [DOI] [PMC free article] [PubMed] [Google Scholar]
- 39.Hara Y, Sudo T, Togane Y, Akagawa H, and Tsujimura H (2018). Cell death in neural precursor cells and neurons before neurite formation prevents the emergence of abnormal neural structures in the Drosophila optic lobe. Developmental Biology 436, 28–41. 10.1016/j.ydbio.2018.02.004. [DOI] [PubMed] [Google Scholar]
- 40.Dorstyn L, Colussi PA, Quinn LM, Richardson H, and Kumar S (1999). DRONC, an ecdysone-inducible Drosophila caspase. Proceedings of the National Academy of Sciences of the United States of America 96, 4307–4312. [DOI] [PMC free article] [PubMed] [Google Scholar]
- 41.Quinn LM, Dorstyn L, Mills K, Colussi PA, Chen P, Coombe M, Abrams J, Kumar S, and Richardson H (2000). An essential role for the caspase Dronc in developmentally programmed cell death in Drosophila. Journal of Biological Chemistry 275, 40416–40424. 10.1074/jbc.M002935200. [DOI] [PubMed] [Google Scholar]
- 42.Siegrist SE, Haque NS, Chen CH, Hay BA, and Hariharan IK (2010). Inactivation of Both foxo and reaper Promotes Long-Term Adult Neurogenesis in Drosophila. Current Biology 20, 643–648. 10.1016/j.cub.2010.01.060. [DOI] [PMC free article] [PubMed] [Google Scholar]
- 43.Suzuki T, Hasegawa E, Nakai Y, Kaido M, Takayama R, and Sato M (2016). Formation of Neuronal Circuits by Interactions between Neuronal Populations Derived from Different Origins in the Drosophila Visual Center. Cell Reports 15, 499–509. 10.1016/j.celrep.2016.03.056. [DOI] [PubMed] [Google Scholar]
- 44.Wernet MF, Labhart T, Baumann F, Mazzoni EO, Pichaud F, and Desplan C (2003). Homothorax Switches Function of Drosophila Photoreceptors from Color to Polarized Light Sensors. Cell 115, 267–279. 10.1016/S0092-8674(03)00848-1. [DOI] [PubMed] [Google Scholar]
- 45.Affolter M, and Basler K (2007). The Decapentaplegic morphogen gradient: From pattern formation to growth regulation. Nature Reviews Genetics. [DOI] [PubMed] [Google Scholar]
- 46.Nellen D, Burke R, Struhl G, and Basler K (1996). Direct and long-range action of a DPP morphogen gradient. Cell 85, 357–368. 10.1016/s0092-8674(00)81114-9. [DOI] [PubMed] [Google Scholar]
- 47.Lecuit T, and Cohen SM (1998). Dpp receptor levels contribute to shaping the Dpp morphogen gradient in the Drosophila wing imaginal disc. Development 125, 4901–4907. 10.1242/dev.125.24.4901. [DOI] [PubMed] [Google Scholar]
- 48.Morante J, Erclik T, and Desplan C (2011). Cell migration in Drosophila optic lobe neurons is controlled by eyeless/Pax6. Development 138, 687–693. 10.1242/dev.056069. [DOI] [PMC free article] [PubMed] [Google Scholar]
- 49.Wolpert L (1969). Positional information and the spatial pattern of cellular differentiation. Journal of theoretical biology 25, 1–47. 10.1016/s0022-5193(69)80016-0. [DOI] [PubMed] [Google Scholar]
- 50.Sivasankaran R, Vigano MA, Müller B, Affolter M, and Basler K (2000). Direct transcriptional control of the Dpp target omb by the DNA binding protein Brinker. The EMBO journal 19, 6162–6172. 10.1093/emboj/19.22.6162. [DOI] [PMC free article] [PubMed] [Google Scholar]
- 51.Pinto-Teixeira F, Koo C, Rossi AM, Neriec N, Bertet C, Li X, Del-Valle-Rodriguez A, and Desplan C (2018). Development of Concurrent Retinotopic Maps in the Fly Motion Detection Circuit. Cell 173, 485–498. 10.1016/j.cell.2018.02.053. [DOI] [PMC free article] [PubMed] [Google Scholar]
- 52.Apitz H, and Salecker I (2015). A region-specific neurogenesis mode requires migratory progenitors in the Drosophila visual system. Nature Neuroscience 18, 46–55. 10.1038/nn.3896. [DOI] [PMC free article] [PubMed] [Google Scholar]
- 53.Apitz H, and Salecker I (2018). Spatiotemporal relays control layer identity of direction-selective neuron subtypes in Drosophila. Nature Communications 9, 1–16. 10.1038/s41467-018-04592-z. [DOI] [PMC free article] [PubMed] [Google Scholar]
- 54.Reddy BVVG, Rauskolb C, and Irvine KD (2010). Influence of Fat-Hippo and Notch signaling on the proliferation and differentiation of Drosophila optic neuroepithelia. Development 137, 2397–2408. 10.1242/dev.050013. [DOI] [PMC free article] [PubMed] [Google Scholar]
- 55.Kawamori H, Tai M, Sato M, Yasugi T, and Tabata T (2011). Fat / Hippo pathway regulates the progress of neural differentiation signaling in the Drosophila optic lobe. Development, growth & differentiation 53, 653–667. [DOI] [PubMed] [Google Scholar]
- 56.Bello BC, Izergina N, Caussinus E, and Reichert H (2008). Amplification of neural stem cell proliferation by intermediate progenitor cells in Drosophila brain development. Neural development 3, 5–5. 10.1186/1749-8104-3-5. [DOI] [PMC free article] [PubMed] [Google Scholar]
- 57.Boone JQ, and Doe CQ (2008). Identification of Drosophila type II neuroblast lineages containing transit amplifying ganglion mother cells. Developmental neurobiology 68, 1185–1195. 10.1002/dneu.20648. [DOI] [PMC free article] [PubMed] [Google Scholar]
- 58.Chen YC, and Konstantinides N (2022). Integration of Spatial and Temporal Patterning in the Invertebrate and Vertebrate Nervous System. Frontiers in Neuroscience. Frontiers Media S.A [DOI] [PMC free article] [PubMed] [Google Scholar]
- 59.Briscoe J, and Ericson J (2001). Specification of neuronal fates in the ventral neural tube. Current Opinion in Neurobiology 11, 43–49. 10.1016/S0959-4388(00)00172-0. [DOI] [PubMed] [Google Scholar]
- 60.Liem KF, Tremml G, Roelink H, and Jessell TM (1995). Dorsal differentiation of neural plate cells induced by BMP-mediated signals from epidermal ectoderm. Cell 82, 969–979. 10.1016/0092-8674(95)90276-7. [DOI] [PubMed] [Google Scholar]
- 61.Basler K, Edlund T, Jessell TM, and Yamada T (1993). Control of cell pattern in the neural tube: regulation of cell differentiation by dorsalin-1, a novel TGF beta family member. Cell 73, 687–702. 10.1016/0092-8674(93)90249-p. [DOI] [PubMed] [Google Scholar]
- 62.Liem KF, Tremml G, and Jessell TM (1997). A Role for the Roof Plate and Its Resident TGFβ-Related Proteins in Neuronal Patterning in the Dorsal Spinal Cord. Cell 91, 127–138. 10.1016/S0092-8674(01)80015-5. [DOI] [PubMed] [Google Scholar]
- 63.Timmer JR, Wang C, and Niswander L (2002). BMP signaling patterns the dorsal and intermediate neural tube via regulation of homeobox and helix-loop-helix transcription factors. Development 129, 2459–2472. 10.1242/dev.129.10.2459. [DOI] [PubMed] [Google Scholar]
- 64.Lin DM, and Goodman CS (1994). Ectopic and increased expression of fasciclin II alters motoneuron growth cone guidance. Neuron 13, 507–523. 10.1016/0896-6273(94)90022-1. [DOI] [PubMed] [Google Scholar]
- 65.Schindelin J, Arganda-Carreras I, Frise E, Kaynig V, Longair M, Pietzsch T, Preibisch S, Rueden C, Saalfeld S, Schmid B, et al. (2012). Fiji: an open-source platform for biological-image analysis. Nat Methods 9, 676–682. 10.1038/nmeth.2019. [DOI] [PMC free article] [PubMed] [Google Scholar]
- 66.Scrucca L, Fraley C, Murphy TB, and Adrian ER (2023). Model-Based Clustering, Classification, and Density Estimation Using mclust in R 10.1201/9781003277965. [DOI] [Google Scholar]
- 67.Chacón JE, and Duong T (2018). Multivariate Kernel Smoothing and its Applications 10.1201/9780429485572. [DOI] [Google Scholar]
Associated Data
This section collects any data citations, data availability statements, or supplementary materials included in this article.
Supplementary Materials
Document S1. Figures S1–S7 and supplemental references.
Table S1: Summary of Dm neuron predicted origins, related to Figure 2. Description of Dm spatial origins using three separate methods and the reasoning used for each assignment.
Table S2: Neuroepithelial density calculations for each spatial domain, related to Figure S5. Grh-stained L3 optic lobes were co-stained for Vsx1, Optix and Rx and regions of interest were drawn for each spatial subdomain; cell density per domain was then calculated.
Table S3: Genotypes of flies used in this study, related to STAR Methods.
Data Availability Statement
Microscopy data will be shared through the Lead Contact. Code written for analysis of single-cell RNAseq data, as well as for calculation of neuroepithelial cell density, is available on GitHub (https://github.com/jennifermalin/Malinetal2024). Single-cell RNAseq data is available in Simon et al., 202432.