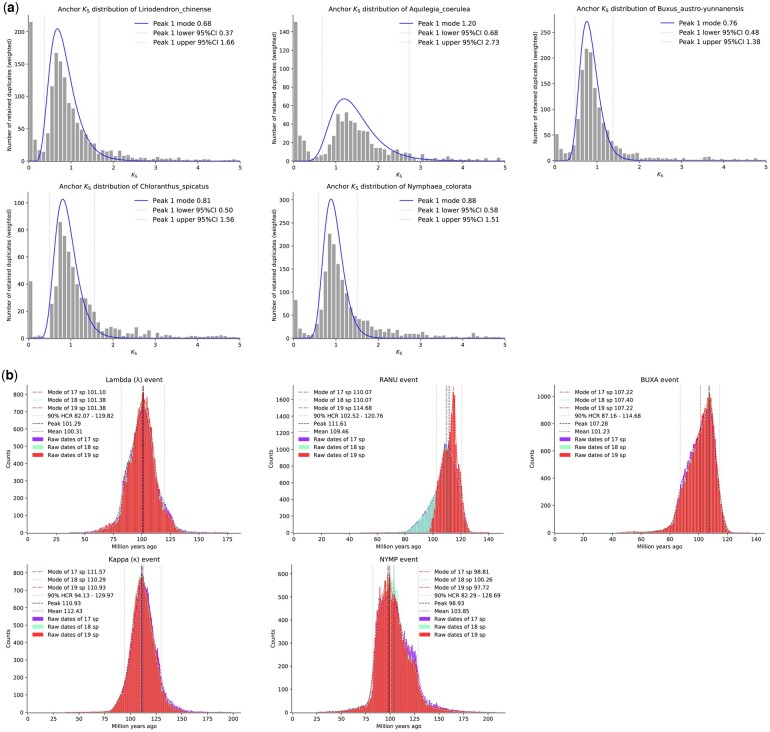
Figure 6.
Anchor pair KS and posterior date distributions of WGD dating for five angiosperms. (a) Anchor pair KS distributions of five angiosperms with the associated 95% confidence level anchor pairs used for dating marked by the dotted lines, and the assumed log-normal distributions superimposed on the identified peaks. (b) Posterior distributions, KDE curves, modes, overall means, peaks and 90% HCR of the date estimation of the five WGD events (see text for details).

