Abstract
Background
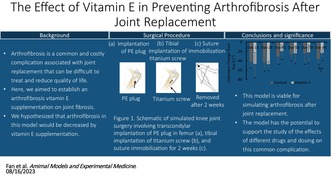
Arthrofibrosis is a joint disorder characterized by excessive scar formation in the joint tissues. Vitamin E is an antioxidant with potential anti‐fibroblastic effect. The aim of this study was to establish an arthrofibrosis rat model after joint replacement and assess the effects of vitamin E supplementation on joint fibrosis.
Methods
We simulated knee replacement in 16 male Sprague–Dawley rats. We immobilized the surgical leg with a suture in full flexion. The control groups were killed at 2 and 12 weeks (n = 5 per group), and the test group was supplemented daily with vitamin E (0.2 mg/mL) in their drinking water for 12 weeks (n = 6). We performed histological staining to investigate the presence and severity of arthrofibrosis. Immunofluorescent staining and α2‐macroglobulin (α2M) enzyme‐linked immunosorbent assay (ELISA) were used to assess local and systemic inflammation. Static weight bearing (total internal reflection) and range of motion (ROM) were collected for functional assessment.
Results
The ROM and weight‐bearing symmetry decreased after the procedure and recovered slowly with still significant deficit at the end of the study for both groups. Histological analysis confirmed fibrosis in both lateral and posterior periarticular tissue. Vitamin E supplementation showed a moderate anti‐inflammatory effect on the local and systemic levels. The vitamin E group exhibited significant improvement in ROM and weight‐bearing symmetry at day 84 compared to the control group.
Conclusions
This model is viable for simulating arthrofibrosis after joint replacement. Vitamin E may benefit postsurgical arthrofibrosis, and further studies are needed for dosing requirements.
Keywords: arthrofibrosis, range of motion, total knee arthroplasty, vitamin E
The Effect of Vitamin E in Preventing Arthrofibrosis After Joint Replacement
1. INTRODUCTION
Arthrofibrosis is a joint disorder characterized by excessive scar tissue production within the joint and surrounding soft tissues 1 , 2 , 3 via metaplastic fibroblast proliferation and extracellular matrix (ECM) deposition. 4 Arthrofibrosis is a common complication after total knee arthroplasty (TKA) with nearly 85 000 annual cases in the United States. 5 Patients present clinically with pain and restricted range of motion (ROM), which severely hinder postoperative rehabilitation, clinical outcomes, and basic activities of daily living, decreasing the patients' quality of life. 6
Arthrofibrosis is believed to be caused by dysregulation of innate and adaptive immunity. The primary surgical treatments for arthrofibrosis are manipulation under anesthesia, arthroscopic lysis of adhesions, and removal of ECM. Surgical intervention can increase the dysregulation of fibrosis, 3 resulting in worsening or reoccurrence. Joint contracture can progress rapidly clinically and is challenging to reverse. 7 Although the definitive cause is not understood, progression involves the transforming growth factor‐β (TGF‐β) signaling pathway. 3 , 8 Surgery and injury cause oxidative stress and an inflammatory response, including the recruitment of pro‐inflammatory cytokines 9 and TGF‐β. 10 These cytokines activate myofibroblasts leading to fibrosis, but some of this response is necessary for healing the injured or disrupted tissue. 11 Early interruption of the myofibroblast axis, for example, inhibiting TGF‐β signaling, may be promising in limiting the progression of fibrogenesis. 12 We hypothesize that preventative treatment reducing the inflammatory response may provide a therapeutic advantage.
The rat is a reliable model for arthrofibrosis, 7 , 13 which has commonly been achieved through limb immobilization after traumatic injury. 14 , 15 We recently developed a rat model to simulate TKA by incorporating joint implant components as well as by introducing the bone and soft tissue trauma associated with surgery. 16 Arthrogenic contracture has been shown to occur within 2 weeks of immobilization in other models, with continuous loss of ROM. 17 ROM, histological, and immunohistological analyses are the key measurements to assess the extent and progress of the condition. One of the aims of this study was to establish a clinically relevant arthrofibrosis model in the rat after our simulated TKA. We evaluated postoperative static weight‐bearing asymmetry, ROM, and reflex response as functional recovery and pain measures.
The second aim of the study was to investigate the effect of the antioxidant vitamin E in the progression of arthrofibrosis. Vitamin E is an abundant and potent antioxidant, whose major role is to protect polyunsaturated fatty acids in the cell membranes from oxidative degradation. 18 Vitamin E was shown to treat pulmonary fibrosis and fatty liver disease in rodents. 19 , 20 , 21 Thus, we hypothesize that vitamin E can reduce fibrosis in periarticular tissues and prevent subsequent functional progression through reduced inflammation. Establishing the arthrofibrosis rat model will help us understand the time dependence of the functional outcome and the relationship between inflammation and function in this injury. The long‐term aim of this study is to assess the effects of prevention and treatment strategies on joint fibrosis in the postoperative period.
2. MATERIALS AND METHODS
2.1. Animals and study timeline
This study was approved by the Institutional Care and Use Committee of Massachusetts General Hospital (2020 N000081). Adult male Sprague–Dawley rats (n = 16) were fed facility chow and water ad libitum and randomly assigned to the groups (250–350 g, Charles River, Wilmington, MA). The timelines of all procedures are shown in Figure S1. The number of animals used and the frequency of observations for each endpoint measurement at every time point are presented in Table S3. All groups underwent a simulated TKA on the right hind limb. The surgical limb was immobilized using suture for 2 weeks to stimulate the development of arthrofibrosis.
Control group C1 (n = 5) was euthanized at 2 weeks, control group C2 (n = 5) was euthanized at 12 weeks, and test group E1 (n = 6) was supplemented with water containing vitamin E until euthanasia at 12 weeks. Animals were acclimated for at least 2 days preoperatively. The day before surgery, preoperative measurements were collected. Static weight bearing using total internal reflection (TIR) imaging in a custom‐designed device (supplementary information and Figure S6 S1), toe spread (using video recording of gait, 22 PROMON U750, AOS Technologies), and ROM were measured. Body weights and blood were also collected. Postoperative measurements were collected on postoperative days (PODs) 14, 28, 42, 56, 70, and 84. On PODs 14 and 84, the animals were euthanized, and gastrocnemius muscles from both hind limbs and posterior and lateral capsular tissues were collected. The presence and severity of arthrofibrosis and systemic inflammation were investigated using histological analysis and α2‐macroglobulin (α2M) enzyme‐linked immunosorbent assay (ELISA) (ab157730, Abcam). Vitamin E (α‐tocopherol) was quantified using high‐pressure liquid chromatography with tandem mass spectrometry (LC–MS/MS).
2.2. Surgical procedure: simulated TKA and limb immobilization
Rats (body weight: 250–350 g, age: 9–11 weeks) received preoperative buprenorphine (0.05 mg/kg, intraperitoneally) 30 min before isoflurane anesthesia (1%–3% isoflurane in 1 L of O2 per minute for maintenance). The surgical limb (right hind limb) was shaved and scrubbed with 10% povidone‐iodine solution. A 3–4 cm lateral incision was used to expose the knee joint. A simulated knee replacement procedure involving a transcondylar femoral implantation of a 3.0 × 3.0 mm cylindrical polyethylene plug and implantation of a titanium screw (1.3 mm in diameter, 8 mm in length, Synthes, Monument, CO) in the tibial canal was performed. 16 The wound was closed using 5–0 Vicryl deep dermal sutures, and the skin was closed using staples. The surgical leg was immobilized using 5–0 Vicryl suture in full flexion. All animals received postoperative buprenorphine (0.05 mg/kg, Subcutaneously) at 12 h intervals for 72 h. We monitored weight and gross or systemic signs of infection, such as skin necrosis, pus, or centrally elevated temperature every other day. We did not encounter any of these criteria.
2.3. Weight monitoring
All animals were weighed to ensure their overall health. Measurements were taken on PODs 3, 14, 28, 42, 56, 70, and 84.
2.4. Vitamin E supplementation
Group E1 was supplemented with water containing water‐soluble natural vitamin E ad libitum (0.2 mg/mL, Kentucky Performance Products, Versailles, KY) for the duration of the study. Dosages (20 mg/kg/day) were guided by previous literature 20 and veterinarian consultation. Average daily vitamin E intake was calculated using water‐level measurements of each cage.
2.5. Histological analysis
Hematoxylin and eosin (H&E) staining: collected tissues were harvested and fixed in 4% formalin for 24 h before being dehydrated in 70% ethanol. All samples were processed and embedded in paraffin and sectioned. The tissues were stained with H&E to examine inflammation and fibrosis formation. 23 The slides were scanned and analyzed using image analysis software (NanoZoomer Digital Pathology, Meyer Instruments, Inc., Houston, TX).
Picrosirius Red staining: tissue sections were fixed in 10% neutral‐buffered formaldehyde solution, and the slides were stored in an oven at 60°C overnight. Tissue sections were deparaffinized in CitriSolv clearing agent (1601H, Decon Labs), rehydrated in graded alcohol, and washed in running water for 30 min. The sections were stained in 0.1% Picro‐Sirius Red solution (365548‐5 g, Sirius Red, Sigma, Burlington, MA; P6744‐1 GA, picric acid solution, Sigma) for 2 h. After staining, the sections were dipped in 100% alcohol (3 × 3 dips), in CitriSolv (3 × 2 min) and covered by a coverslip with Permount (SP15‐500, Fisher Scientific).
Human sample collection and analysis: the Institutional Review Board (1999P001235) approved the collection of human tissues at the time of arthroplasty. Discarded posterior capsules of arthroplasty patients were collected. The tissues were identified as “healthy” or “arthrofibrotic” based on clinical diagnosis. In this study, we present histology from the tissues of one arthrofibrotic patient.
Quantification of fibrotic area: three unaffiliated blinded reviewers were trained to indicate fibrotic areas on histology slides using the following criteria: presence of synovial hyperplasia, red−/pink‐lined collagen fibers, fibroblasts, or inflammatory cells. The arthrofibrosis area excluded fat cells, muscles, vessels, and blank regions. The total tissue and arthrofibrosis area were measured using image analysis software (NanoZoomer Digital Pathology, Meyer Instruments, Inc.). Arthrofibrosis area % = arthrofibrosis area/total tissue area.
2.6. Immunohistochemistry
Immunohistochemical staining was performed for interleukin 6 (IL‐6) and tumor necrosis factor alpha (TNF‐⍺). IL‐6 polyclonal antibody (ARC0062, ThermoFisher) and anti‐TNF‐α antibody (Ab269772, Abcam) were used. All antibodies were diluted 1:200 in antibody diluent (S0809, Dako). For antigen extraction, an antigen retrieval solution was used (10× homemade antigen retrieval solution [pH 8.5]: 250 mM Tris–HCl [501 031 386, Fisher Scientific] and 250 mL [1 M stock, 1:4 dilution]; 10 mM ethylenediaminetetraacetic acid [BP2482500, Fisher Scientific] and 20 mL [0.5 stock, 1:50 dilution]; 0.5% sodium dodecyl sulfate [J63394, Alfa Aesar] and 25 mL [20% stock, 1:40 dilution]; dH2O: 705 mL). After 30 min in blocking buffer, the slides were incubated with primary antibodies overnight at 4°C in a moisture chamber. In the negative control, no primary antibody was used. The slides were washed extensively in Tris‐buffered saline (TBS). After 10 min in blocking buffer, the slides were incubated in the dark for 2 h with fluorescent‐conjugated secondary antibody (Goat Anti Rabbit Alexa Fluor 568 Rabbit [A11011, ThermoFisher] and Goat Anti Mouse Alexa Fluor 647 Mouse [A21236, ThermoFisher]), washed again in TBS (4 × 5 min), and then washed in distilled water. The sections were mounted with coverslips using DAPI mounting media (P36935, SlowFade Gold Antifade Reagent with DAPI, Invitrogen).
2.7. Blood collection and analysis
Blood was collected (~150 μL) from the lateral tail vein and centrifuged at 3300 rpm for 15 min. Serum was then collected and stored at −20°C until further analysis. α2M ELISA (ab157730, Abcam) was performed to determine the concentration of α2M in serum. The concentration ratios for each animal were calculated using the baseline concentration of that animal (collected preoperatively).
2.8. Quantification of vitamin E concentration in plasma and tissues
Frozen plasma (20 μL), skin, and muscle were thawed and prepared for LC–MS/MS analysis. We homogenized the skin and muscle samples in 1 mL of LC–MS‐grade water. We prepared 10 μg/mL of internal standard (δ‐tocopherol analytical standard, Sigma‐Aldrich, 47 784) solution in 0.2 mg/mL of ascorbic acid (Sigma‐Aldrich, A4544) in methanol 24 and added 50 μL of internal standard to each sample tube. We added 2 mL of hexane, purged the tube with nitrogen, and then placed the tube in an ultrasonic bath for 10 min. 25 Later, the samples were incubated in an oven at 70°C for 30 min. The mixtures were vortexed and centrifuged at 2000 g for 10 min to precipitate cell debris and proteins. The separated hexane phase was collected and transferred into another tube. An additional 2 mL of hexane was added to each sample tube, vortexed, and centrifuged again for 10 min at 2000 g. The separated hexane phase was collected and combined for each sample with previous collections. The hexane was filtered with 0.2 μm polytetrafluoroethylene filters and placed in a vacuum oven at 37°C. We added 100 μL and 250 μL of 0.2 mg/mL ascorbic acid in methanol solution in serum and tissue samples, respectively. α‐Tocopherol was analyzed using an LC–MS/MS system, Ultivo liquid chromatography triple‐quadrupole mass spectrometer (Agilent). The detailed procedures and calibration information are shown in Figures S2 and S3. The vitamin E concentrations in the plasma, skin, and muscle of the control and vitamin E groups are shown in Figure S4.
2.9. Range of motion
Range of motion (ROM) measurements of the surgical limb were taken using a goniometer (Figure S5B). The rats were anesthetized using isoflurane inhalation (1%–3% isoflurane in 1 L of O2 per minute for maintenance). The limb was extended and flexed to full extension and flexion positions, and the angles of the tibia and femur were measured and recorded.
2.10. Static weight bearing
Hind‐limb weight‐bearing measurements were made using a custom‐built platform using TIR as the measurement principle (Figure S6). Voltage levels of LED (light emitting diode) lights were adjusted so that the limit of detection was quantifiable for pressures at and above 0.55 g/mm. The rats were placed in the plexiglass container, and worm‐eye view videos were recorded for 5 min. The videos were assessed in MATLAB (Matlab, Mathworks) to find eight distinct instances in which the rat was standing only on its hind limbs. Using images of the LED pawprints, the intensity of each print was calculated using a custom code to determine the weight distribution ratio between the hind limbs for each rat.
2.11. Toe spread
A walking arena was built for gait analysis using GAITOR Suite. 22 Gait videos were recorded at 400 fps and ~ 1350 μs of exposure time (PROMON U750, AOS Technologies, Switzerland). A minimum of three gait trials were collected for each rat at each time point. Gait videos were analyzed using ImageJ. Using the dorsal view, frames depicting flush contact of each paw with the glass floor were identified. Using the ventral view camera, 1–5 and 2–4 toe spread (five measurements per animal) values were measured manually. The ratio of these measurements between the surgical paw (right) and the control (left) paw was calculated.
2.12. Statistical analyses
Paired t‐tests were performed between and within control and experimental groups on ROM, weight‐bearing asymmetry, and ELISA results that were collected throughout the study to compare any changes between days. Significant differences were determined as p‐values <0.05 (SAS).
3. RESULTS
3.1. Vitamin E supplementation
Based on the daily water intake measurements, the rats in the control group drank 34.1 ± 8.9 mL of water per day, whereas those in the vitamin E group drank 42.1 ± 13 mL. The vitamin E group ingested an average of 8.42 ± 2.3 mg of vitamin E per day for the duration of the study (Table S1).
The amount of vitamin E in the control group when killed was 0.83 ± 0.4 μg/mL, 2.14 ± 1 ng/mg, and 1.31 ± 0.75 ng/mg in the plasma, skin, and muscle, respectively. The amount of vitamin E in the treatment group was 1.51 ± 0.49 μg/mL, 4.08 ± 1.76 ng/mg, and 4.63 ± 4.38 ng/mg, respectively. The vitamin E level in the vitamin E group was significantly higher than that in the control groups in the plasma, skin, and muscle (p < 0.05, Figure S4).
3.2. Fibrosis analysis
H&E and Picrosirius staining showed fibrosis in the posterior and lateral knee capsule tissue samples for control and experimental groups, as shown by the increased presence of fibroblasts and synovial hyperplasia (Figures 1 and 2). The control groups showed synovial hyperplasia in the posterior capsule and dense fibroblast cells in the lateral side of the surgical limb. The nonsurgical (left) limb in the control groups showed muscle fiber without fibrosis (Figure 1A). The arthrofibrosis area was significantly increased in the lateral‐surgical limb than in the lateral‐nonsurgical limb in the control group (p < 0.05, Figure S8). Picrosirius staining showed red collagen fiber in the posterior and lateral capsules in the surgical limb of the control group. In contrast, the muscle fiber and cytoplasm stained yellow in the nonsurgical limb of the control group. Epimysium, perimysium, and endomysium containing type I collagen were red in the nonsurgical (left) limb of controls (Figure 1B). Red collagen fiber in the posterior capsule from a clinical sample collected from an arthrofibrosis patient was similar to that in the rat tissue (Figure 1C). In contrast, there was no red staining in the nonarthrofibrosis human posterior capsule sample (Figure 1C).
FIGURE 1.
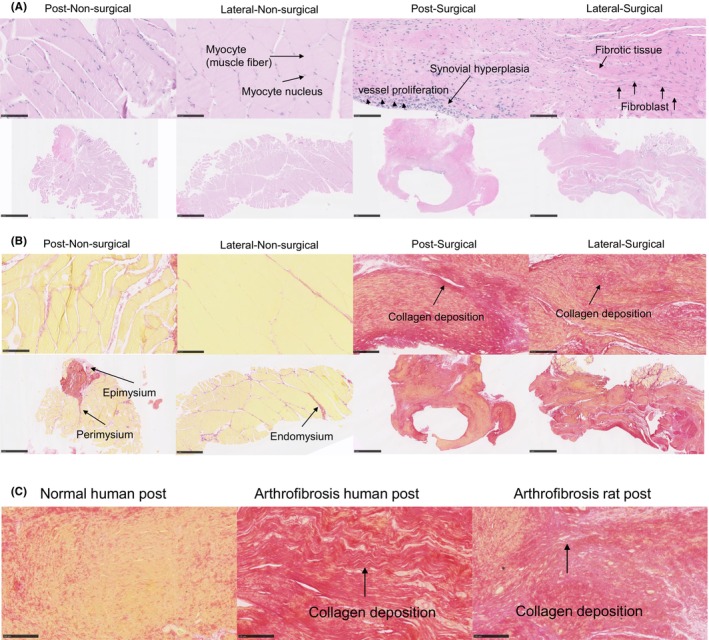
(A) Hematoxylin and eosin (H&E) staining of lateral and posterior knee capsule tissues from the left (post‐nonsurgical) and right (lateral‐surgical) limbs of the control group at 12 weeks postintervention. The top panels exhibit detailed views of the muscle tissue, with arrows indicating myocytes (muscle fibers) and myocyte nuclei in nonsurgical and surgical contexts, respectively. The bottom panels provide a broader perspective of the knee capsule, depicting normal tissue architecture in the nonsurgical limb versus signs of pathological changes in the surgical limb, such as synovial hyperplasia and fibroblast proliferation, which are labeled in the surgical panels. Synovial hyperplasia signifies a pathological increase in the number of synovial cells, contributing to joint thickening and potential dysfunction. Scale bar: 100 μm, 1 mm. (B) Picrosirius Red staining of lateral and posterior knee capsule tissues from nonsurgical (left) and surgical (right) limbs of the control group, observed at 12 weeks postprocedure. The staining technique highlights the collagen fiber organization within the connective tissue layers surrounding the muscle. The two left columns display the nonsurgical tissues with normal collagen alignment, whereas the two right columns show the surgical tissues with altered collagen distribution. Arrows in the bottom‐left panel identify the structural components of the muscle connective tissue: epimysium, the outer layer; perimysium, the intermediate layer; and endomysium, the inner layer surrounding individual muscle fibers. Scale bar: 100 μm, 1 mm. (C) Comparative histological analysis of post‐capsule tissue stained with Picrosirius Red highlighting collagen deposition. The left panel shows normal human post‐capsule tissue with uniform collagen distribution. The center panel shows human arthrofibrosis post‐capsule tissue, where the arrow indicates areas of dense collagen fiber accumulation characteristic of fibrotic changes. The right panel shows rat arthrofibrosis post‐capsule tissue, similarly demonstrating increased collagen density (indicated by the arrow) comparable to human pathology. Scale bar: 100 μm.
FIGURE 2.
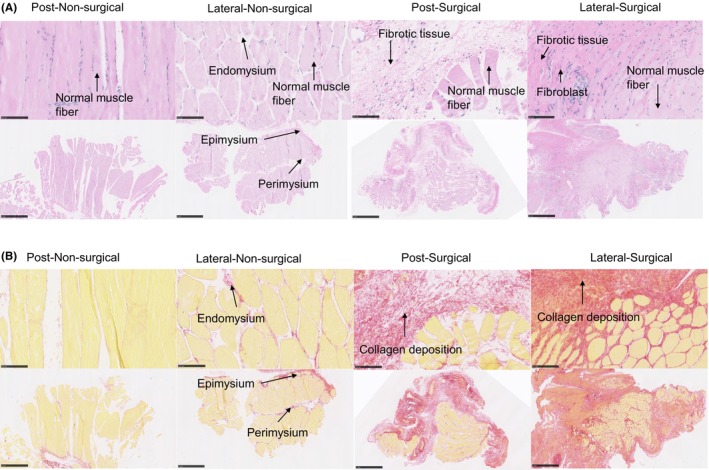
(A) H&E (hematoxylin and eosin) staining of lateral and posterior knee capsule tissues from the left (nonsurgical) and right (surgical) limbs of subjects in the vitamin E group at 12 weeks postintervention. The top row shows close‐up views of the muscular tissue microstructure: the left image shows the regular architecture of muscle fibers in the nonsurgical limb with distinct endomysial connective tissue; the right image highlights disrupted muscle fiber organization in the surgical limb with evidence of inflammatory infiltration. The bottom row presents broader views of the connective tissue layers surrounding the muscles: the left image shows the intact epimysium and perimysium in the nonsurgical limb; the right image shows the thickened and disorganized connective tissue layers in the surgical limb. Scale bar: 100 μm, 1 mm. (B) Picrosirius Red staining of lateral and posterior knee capsule tissues from nonsurgical (left) and surgical (right) limbs of subjects in the vitamin E group, evaluated at 12 weeks postintervention. This staining technique specifically highlights the collagen fibers within the connective tissue. The two left columns show the nonsurgical tissues, where the collagen fibers are uniformly aligned, indicative of normal tissue architecture. The two right columns exhibit the surgical tissues, where the collagen distribution is visibly disrupted, reflecting changes due to surgical intervention and vitamin E administration. Arrows in the images of nonsurgical tissue point to the epimysium, perimysium, and endomysium, detailing the layered structure of the muscle connective tissue. Scale bar: 100 μm, 1 mm.
In the vitamin E–treated group, H&E staining qualitatively showed thinner fibrosis tissue in the posterior capsule and a transition of the fibrosis tissue to muscle tissue on the lateral side of the surgical (right) limb (Figure 2A). There was some dispersed red staining in the Picrosirius‐stained sections (Figure 2B). The fibrotic area was significantly higher in the surgical side compared to that on the nonsurgical tissue, but the fibrotic area was less in the vitamin E–treated group only on the lateral side compared to that in the control group lateral capsule surgical limb (Figure S8).
3.3. Inflammation analysis
The IL‐6 and TNF‐α immunofluorescence staining confirmed the presence of inflammation in the lateral and posterior knee capsule tissues for both control and experimental groups, indicated by the intense yellow and red coloration, respectively (Figure 3A,B). There were some bright loci in the TNF‐α signal and in the IL‐6 signal in the lateral‐surgical limb of the control group (Figure 3A), whereas the staining signal was dispersed in the vitamin E group (Figure 3B). α2M levels, which were 1.1 ± 0.2 in the control group and 0.9 ± 0.4 in the vitamin E group immediately after surgery, decreased significantly thereafter and remained low for both control and vitamin E groups (Figure 4). No significant differences were found between control and vitamin E groups with regard to α2M levels.
FIGURE 3.
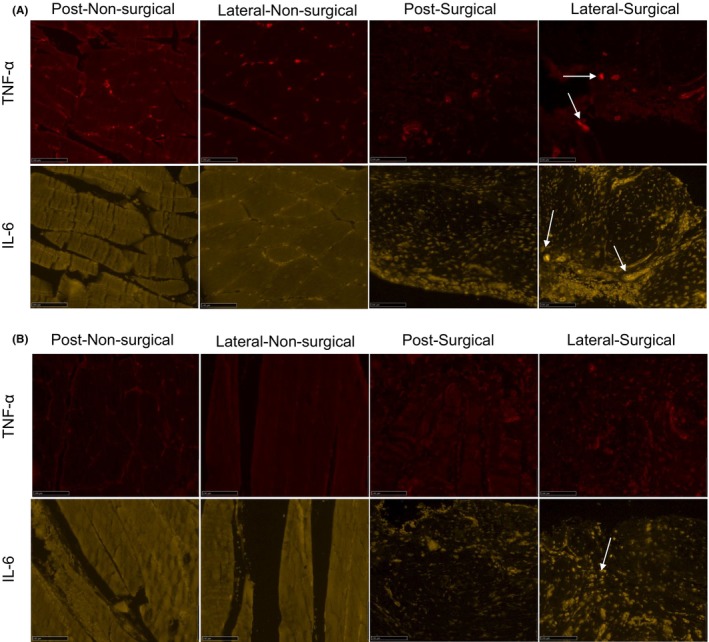
(A) Enhanced IL‐6 (interleukin 6) and tumor necrosis factor‐alpha (TNF‐α) immunofluorescence staining of lateral and posterior knee capsule tissues from nonsurgical and surgical limbs of the control group at 12 weeks postoperation. Red fluorescence indicates TNF‐α at 647 nm, and yellow fluorescence represents IL‐6 at 568 nm. The arrows mark areas with particularly strong staining. Scale bar: 100 μm. (B) Improved IL‐6 and TNF‐α immunofluorescence staining in lateral and posterior knee capsule tissues from nonsurgical and surgical limbs of the vitamin E–Etreated group at 12 weeks postoperation. Visualization parameters for IL‐6 and TNF‐α as described for (A). The arrows highlight areas with pronounced staining intensity. Scale bar: 100 μm.
FIGURE 4.
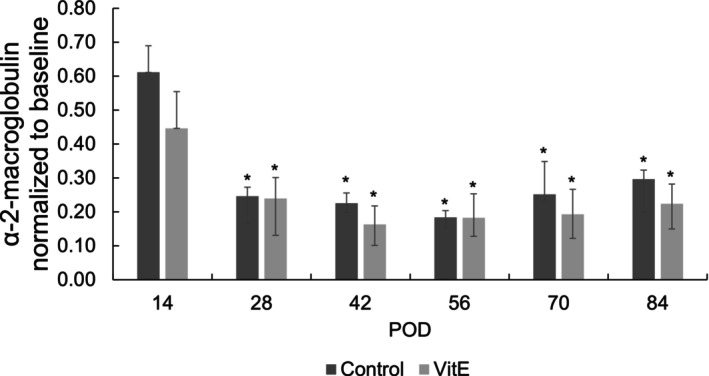
α2‐Macroglobulin levels normalized to baseline values of control and vitamin E groups over a function of time (*p < 0.05 vs. baseline).
3.4. Range of motion
The ROM in extension decreased from 170° on POD 0 to 131° on POD 14 for both control and vitamin E groups before increasing again throughout the course of the study (Figure 5A). The ROM was significantly different at all time points compared to POD 0 and did not recover to baseline for either group. The only difference between groups was observed on POD 84 (Figure 5B).
FIGURE 5.
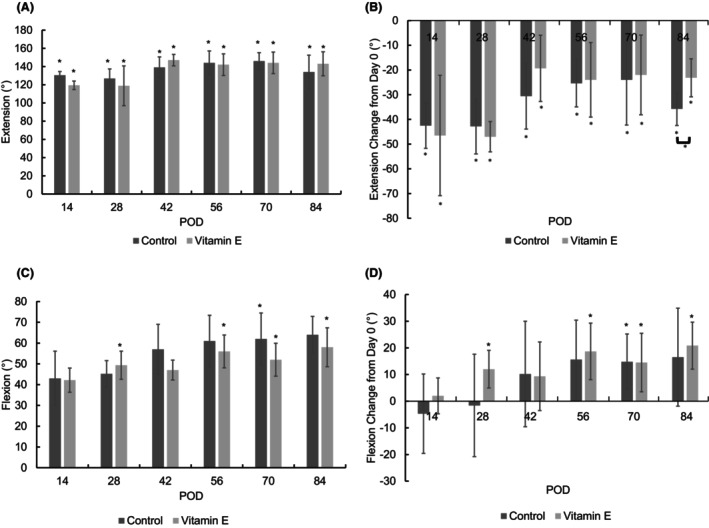
(A) Range of motion in extension as a function of time. Preoperatively, the ROM in extension was 170.8 ± 5.45°. (B) The change in extension from the baseline before the surgical procedure and immobilization. The full extension of the joint is represented by 180° (inset). The asterisk indicates a significant difference between designated POD (postoperative day) and POD 0 values (p < 0.05). (C) Range of motion in flexion as a function of time. The preoperative ROM in flexion was 45.56 ± 12.54°. (D) The change in flexion from the baseline before the surgical procedure and immobilization. The full flexion of the joint is represented by 40° (inset). The asterisk indicates a significant difference between designated POD and POD 0 values (*p < 0.05).
The ROM in flexion showed a steady increasing trend for both groups and was ~20° higher than baseline at the end of the study (Figure 5C). The ROM in flexion was significantly higher than the preoperative baseline for the control groups on POD 70 and for the vitamin E group on PODs 28, 56, 70, and 84. The change in flexion was also significant for the groups on these days (Figure 5D). There were no significant differences between control and vitamin E groups for ROM.
3.5. Weight‐bearing analysis
The weight‐bearing ratios (weight bearing of the surgical hind limb compared to the nonsurgical hind limb) for both control and vitamin E groups decreased after the initial surgery, were at a minimum on POD 14, and increased thereafter (Figure 6A). The weight‐bearing ratio was significantly lower than the preoperative baseline on PODs 14 and 56 for both groups. Both groups recovered to baseline weight bearing by POD 70. There was no significant difference between groups for weight‐bearing ratios at any time point.
FIGURE 6.
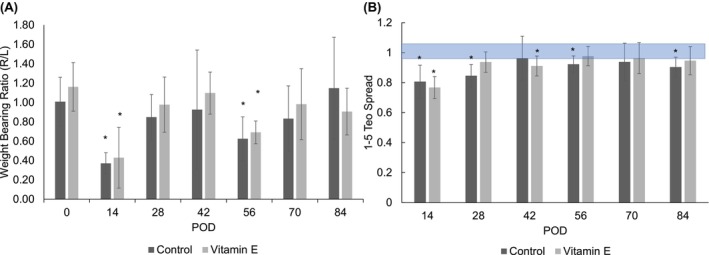
Weight‐bearing ratio of (A) right‐and left hind limbs and (B) toe spread 1 , 2 , 3 , 4 , 5 as a function of time. Asterisk indicates significant difference between designated POD (postoperative day) and POD 0 values (p < 0.05). Shaded area is the margin of error from the database of healthy animals.
3.6. Toe spread measurements
The 1–5 and 2–4 toe spread values decreased for both the control and vitamin E–treated groups on POD 14 (Figure 6B; Figure S10). For the control group, the 1–5 toe spread value was significantly lower than the preoperative values on PODs 14, 28, 56, and 84. For the vitamin E group, the 1–5 toe spread value was significantly lower than the preoperative values on PODs 14 and 42. For the control group, the 2–4 toe spread value was significantly lower than the preoperative baseline on PODs 14, 56, and 84, and for the vitamin E–treated group, the 2–4 toe spread value was significantly lower than the preoperative values on POD 14 only. Between groups, the 2–4 toe spread value of the vitamin E group was significantly higher than that of the control group on POD 28. The vitamin E group 1–5 toe spread value recovered to baseline on POD 56, whereas the control group 1–5 toe spread value did not recover to baseline. The vitamin E group 2–4 toe spread value recovered to baseline on POD 28, whereas the control group 2–4 toe spread value did not recover to baseline.
3.7. Correlation of various endpoint measurements
Correlations were run for all combinations of endpoint measurements (Table S2). ROM extension showed a strong negative correlation with 1–5 toe spread and 2–4 toe spread values for the control group (R > 0.6; Figures S7 and S10).
4. DISCUSSION
The presence of arthrofibrosis was evaluated qualitatively using histological analysis. Myofibroblasts are the essential effector cells of fibrosis 26 and can be found in most fibro‐contractive diseases. 27 Myofibroblasts produce TGF‐β, IL‐1β, IL‐6, and reactive oxygen species, further activating a fibrotic response. 28 Visualization of the fibrotic tissue and the ECM using H&E staining, which presents the presence and density of fibroblasts, 29 showed that immobilization after TKA resulted in fibroblast infiltration and synovial hyperplasia (Figure 1A). Picrosirius Red staining, which is indicative of collagen production and orientation, confirmed the overproduction of collagen fibers in both the lateral and posterior capsular tissues (Figure 1B). These histological observations in the control group suggested the formation and sustenance of arthrofibrosis. Increased capsule thickness in the posterior and lateral histologic sections was also reported in a model where the posterior capsule was disrupted through hyperextension of the knee joint. 13 In our model for post‐TKA arthrofibrosis, we implanted hardware in the femur and tibia instead of causing posterior capsule disruption. The fibrosis area significantly increased in the lateral‐surgical limb compared to the lateral‐nonsurgical control limb (Figure S8), presumably because of the more robust nature of the trauma‐induced inflammatory reaction at the neighboring lateral and posterior capsular tissues. H&E and Picrosirius staining of the tissues of the vitamin E group showed decreased fibrosis and collagen fibrillation, respectively, consistent with our hypotheses (Figure 2A,B).
Systemic inflammation, assessed by α2M as an analog to C‐reactive protein in humans, 30 increased at 2 weeks in the controls, in contrast to that of the vitamin E group, suggesting that pretreated vitamin E may decrease the acute early‐phase inflammation (Figure 4). Systemic inflammation was not different between the two groups over the remainder of the study, pointing to the necessity of investigating the local tissue response separately. The presence of the inflammatory marker IL‐6 was associated with fibrosis in the lung 31 and can act via shifting acute inflammation into a more chronic profibrotic state. 32 Immunofluorescence results from the control group at 2 weeks showed a positive IL‐6 signal and a weaker TNF‐α signal in the surgical limb (Figure S9C). These signals may not increase concurrently in the local inflammatory response as TNF‐α was shown to block some inflammatory cytokines, including IL‐1β, and IL‐6, 33 and its role in organ fibrosis remains controversial. 34 The vitamin E group presented no TNF‐α signal and a very weak IL‐6 signal only on the lateral capsular tissue, showing a modest anti‐inflammatory effect after 12 weeks (Figure 3A,B), consistent with our hypothesis.
Arthrofibrosis is mainly diagnosed by clinical assessment and verified by histopathologic analysis. After knee surgery, patients with clinically significant loss of knee extension and/or flexion (<90° of passive flexion and <10° of full extension) are considered for the diagnosis of arthrofibrosis. 8 , 35 Neither the control nor the vitamin E group fully recovered to standard extension and flexion (Figures 5), which supported the expected clinical outcome. The effect of vitamin E on ROM was not significant except for a modest difference in the long‐term extension; we attribute this result to the dose of the vitamin E administration not being sufficient. At the same time, weight‐bearing symmetry after the release of the immobilization was higher for the vitamin E group throughout the study, suggesting a better functional outcome (Figure 6B). In addition, toe spread (Figure 6B), which we have found to be a good marker of the general well‐being and recovery of the animals, recovered faster for the vitamin E group. Overall, treatment with vitamin E in a periprosthetic joint infection (PJI) model starting preoperatively could have some benefit in decreasing inflammation and could accelerate postoperative recovery.
The limitation of the study is that vitamin E supplementation by drinking water may not be optimal in controlling the dose and obtaining the desired therapeutic range of vitamin E in the tissues. The vitamin E intake was 8.42 ± 2.3 mg of vitamin E per day (16.84 ± 4.6 mg/kg/day). Although the amount of vitamin E in the skin and muscle was significantly higher than that in the control group (Figure S4), the longitudinal profile in the plasma indicated that a higher level could be reached on POD 56, indicating the dose may have been under the therapeutic range at early time points. Further study should focus on the dosing and alternative administrated routes.
5. CONCLUSIONS
The results showed that this model is viable for simulating arthrofibrosis after TKA. Although vitamin E did decrease inflammation and there was a trend in vitamin E supplementation resulting in less functional disruption in the later stages, the differences between the control and vitamin E groups were small. It is possible that increasing the dosage of vitamin E or using an alternative route of administration (subcutaneous, intra‐articular) may lead to more significant effects.
AUTHOR CONTRIBUTIONS
Yingfang Fan: substantial contributions toward performing surgery and research design, and the acquisition, analysis, and interpretation of data; drafting the paper and revising it critically; approval of the submitted and final versions. Jean Yuh: substantial contributions to research design, and the acquisition, analysis, or interpretation of data; drafting the paper and revising it critically; approval of the submitted and final versions. Sashank Lekkala: substantial contributions to research design, and the acquisition, analysis, or interpretation of data; approval of the submitted and final versions. Mehmet D. Asik: substantial contributions to research design, and the acquisition, analysis or interpretation of data; drafting the paper and revising it critically; approval of the submitted and final versions. Andrew Thomson: substantial contributions to research design, and the acquisition, analysis, or interpretation of data; approval of the submitted and final versions. Madeline McCanne: substantial contributions to research design, and the acquisition, analysis, or interpretation of data; approval of the submitted and final versions. Mark A. Randolph: substantial contributions to performing surgery and research design; revising the paper critically; approval of the submitted and final versions. Antonia F. Chen: substantial contributions to research design, and the acquisition, analysis, or interpretation of data; drafting the paper and revising it critically; approval of the submitted and final versions. Ebru Oral: substantial contributions to research design, and the acquisition, analysis, or interpretation of data; drafting the paper and revising it critically; approval of the submitted and final versions.
FUNDING INFORMATION
This work was supported in part by the Ruth Jackson Orthopedic Society and the Harris Orthopedic Laboratory. This study was approved by the Institutional Care and Use Committee of Massachusetts General Hospital (2020 N000081).
CONFLICT OF INTEREST STATEMENT
Dr. Antonia F. Chen: Royalties: Stryker; paid consultant: Adaptive Phage Therapeutics, Avanos, BICMD, Convatec, Ethicon, Heraeus, IrriMax, Osteal Therapeutics, Peptilogics, Pfizer, Smith and Nephew, Stryker, TrialSpark; own stock or stock options: Hyalex, Irrimax, Osteal Therapeutics, Sonoran, IlluminOss; Research support from a company or supplier as a Principal Investigator: Adaptive Phage Therapeutics, Elute, Peptilogics, Sectra; Royalties, financial or material support from publishers: SLACK Incorporated, UpToDate, Taylor & Francis Group, Journal of Bone and Joint Surgery; Medical/Orthopaedic publications editorial/governing board: Journal of Arthroplasty; Journal of Bone and Joint Infection; Journal of Bone and Joint Surgery; Arthroplasty Today; Board member/committee appointments for a society: AAOS, AJRR, AAHKS. Dr. Ebru Oral: Royalties: Corin Ltd, Exactech, Arthrex, Meril Healthcare, Renovis, Conformis; paid consultant: W.L. Gore & Associates; royalties, financial or material support, serve on the editorial or governing board: Journal of Biomedical Materials Research; Board member/committee appointments for a society: Society for Biomaterials.
ETHICS STATEMENT
This study was approved by the Institutional Care and Use Committee of Massachusetts General Hospital (2020 N000081).
Supporting information
Data S1.
ACKNOWLEDGMENTS
We extend our gratitude for the partial support provided by the Ruth Jackson Orthopedic Society and the Harris Orthopedic Laboratory in the realization of this work. Special thanks are due to Amita Sekar and Keith K. Wannomae for their invaluable contributions in quantifying arthrofibrosis density. Additionally, we acknowledge the Wellman Center for Photomedicine Histology Core and the Center for Skeletal Research Cores for their expert assistance in histology staining.
Fan Y, Yuh J, Lekkala S, et al. The efficacy of vitamin E in preventing arthrofibrosis after joint replacement. Anim Models Exp Med. 2024;7:145‐155. doi: 10.1002/ame2.12388
Contributor Information
Yingfang Fan, Email: yfan8@mgh.harvard.edu.
Ebru Oral, Email: eoral@mgh.harvard.edu.
REFERENCES
- 1. Cheuy VA, Foran JRH, Paxton RJ, Bade MJ, Zeni JA, Stevens‐Lapsley JE. Arthrofibrosis associated with Total knee arthroplasty. J Arthroplasty. 2017;32(8):2604‐2611. [DOI] [PubMed] [Google Scholar]
- 2. Musahl V, Karlsson J. Anterior cruciate ligament tear. N Engl J Med. 2019;380(24):2341‐2348. [DOI] [PubMed] [Google Scholar]
- 3. Usher KM, Zhu S, Mavropalias G, Carrino JA, Zhao J, Xu J. Pathological mechanisms and therapeutic outlooks for arthrofibrosis. Bone Res. 2019;7:9. [DOI] [PMC free article] [PubMed] [Google Scholar]
- 4. Thompson R, Novikov D, Cizmic Z, et al. Arthrofibrosis after Total knee arthroplasty: pathophysiology, diagnosis, and management. Orthop Clin North Am. 2019;50(3):269‐279. [DOI] [PubMed] [Google Scholar]
- 5. Stephenson JJ, Quimbo RA, Gu T. Knee‐attributable medical costs and risk of re‐surgery among patients utilizing non‐surgical treatment options for knee arthrofibrosis in a managed care population. Curr Med Res Opin. 2010;26(5):1109‐1118. [DOI] [PubMed] [Google Scholar]
- 6. Seyler TM, Marker DR, Bhave A, et al. Functional problems and arthrofibrosis following total knee arthroplasty. J Bone Joint Surg Am. 2007;89(Suppl 3):59‐69. [DOI] [PubMed] [Google Scholar]
- 7. Kallianos SA, Singh V, Henry DS, Berkoff DJ, Arendale CR, Weinhold PS. Interleukin‐1 receptor antagonist inhibits arthrofibrosis in a post‐traumatic knee immobilization model. Knee. 2021;33:210‐215. [DOI] [PubMed] [Google Scholar]
- 8. Chen X, Wang Z, Huang Y, Deng W, Zhou Y, Chu M. Identification of novel biomarkers for arthrofibrosis after total knee arthroplasty in animal models and clinical patients. EBioMedicine. 2021;70:103486. [DOI] [PMC free article] [PubMed] [Google Scholar]
- 9. Grellner W, Georg T, Wilske J. Quantitative analysis of proinflammatory cytokines (IL‐1beta, IL‐6, TNF‐alpha) in human skin wounds. Forensic Sci Int. 2000;113(1–3):251‐264. [DOI] [PubMed] [Google Scholar]
- 10. Liu RM, Gaston Pravia KA. Oxidative stress and glutathione in TGF‐beta‐mediated fibrogenesis. Free Radic Biol Med. 2010;48(1):1‐15. [DOI] [PMC free article] [PubMed] [Google Scholar]
- 11. Correa M, Mendes C, Bittencourt JVS, et al. Effects of the application of decellularized amniotic membrane solubilized with hyaluronic acid on wound healing. Ann Biomed Eng. 2022;50:1895‐1910. [DOI] [PubMed] [Google Scholar]
- 12. Monument MJ, Hart DA, Salo PT, Befus AD, Hildebrand KA. Posttraumatic elbow contractures: targeting neuroinflammatory fibrogenic mechanisms. J Orthop Sci. 2013;18(6):869‐877. [DOI] [PubMed] [Google Scholar]
- 13. Owen AR, Dagneaux L, Limberg AK, et al. Biomechanical, histological, and molecular characterization of a new posttraumatic model of arthrofibrosis in rats. J Orthop Res. 2022;40(2):323‐337. [DOI] [PMC free article] [PubMed] [Google Scholar]
- 14. Baranowski A, Schlemmer L, Forster K, et al. A novel rat model of stable posttraumatic joint stiffness of the knee. J Orthop Surg Res. 2018;13(1):185. [DOI] [PMC free article] [PubMed] [Google Scholar]
- 15. Efird W, Kellam P, Yeazell S, Weinhold P, Dahners LE. An evaluation of prophylactic treatments to prevent post traumatic joint stiffness. J Orthop Res. 2014;32(11):1520‐1524. [DOI] [PubMed] [Google Scholar]
- 16. Fan Y, Xiao Y, Sabuhi WA, et al. Longitudinal model of periprosthetic joint infection in the rat. J Orthop Res. 2020;38(5):1101‐1112. [DOI] [PubMed] [Google Scholar]
- 17. Sasabe R, Sakamoto J, Goto K, et al. Effects of joint immobilization on changes in myofibroblasts and collagen in the rat knee contracture model. J Orthop Res. 2017;35(9):1998‐2006. [DOI] [PubMed] [Google Scholar]
- 18. Packer L, Kagan VE. Vitamin E: the antioxidant harvesting center of membranes and lipoproteins. In: Packer L, Fuchs J, eds. Vitamin E in Health and Disease. Marcel Dekker, Inc.; 1993:179‐192. [Google Scholar]
- 19. Balah A, Ezzat O, Akool ES. Vitamin E inhibits cyclosporin A‐induced CTGF and TIMP‐1 expression by repressing ROS‐mediated activation of TGF‐beta/Smad signaling pathway in rat liver. Int Immunopharmacol. 2018;65:493‐502. [DOI] [PubMed] [Google Scholar]
- 20. Kaya V, Yazkan R, Yildirim M, et al. The relation of radiation‐induced pulmonary fibrosis with stress and the efficiency of antioxidant treatment: an experimental study. Med Sci Monit. 2014;20:290‐296. [DOI] [PMC free article] [PubMed] [Google Scholar]
- 21. Tzanetakou IP, Doulamis IP, Korou LM, et al. Water soluble vitamin E Administration in Wistar Rats with non‐alcoholic fatty liver disease. Open Cardiovasc Med J. 2012;6:88‐97. [DOI] [PMC free article] [PubMed] [Google Scholar]
- 22. Jacobs BY, Lakes EH, Reiter AJ, et al. The open source GAITOR suite for rodent gait analysis. Sci Rep. 2018;8(1):9797. [DOI] [PMC free article] [PubMed] [Google Scholar]
- 23. Jia K, Wu J, Li Y, et al. A novel pulmonary fibrosis murine model with immune‐related liver injury. Animal Model Exp Med. 2023;6(3):274‐282. [DOI] [PMC free article] [PubMed] [Google Scholar]
- 24. Rizzolo A, Polesello S. Chapter 16‐Vitamins. In: Deyl Z, Mikšik I, Tagliaro F, Tesařová E, eds. Journal of Chromatography Library. Vol 60. Elsevier; 1998:651‐735. [Google Scholar]
- 25. Xu Z. Comparison of extraction methods for quantifying vitamin E from animal tissues. Bioresour Technol. 2008;99(18):8705‐8709. [DOI] [PubMed] [Google Scholar]
- 26. Wynn TA, Ramalingam TR. Mechanisms of fibrosis: therapeutic translation for fibrotic disease. Nat Med. 2012;18(7):1028‐1040. [DOI] [PMC free article] [PubMed] [Google Scholar]
- 27. Tomasek JJ, Gabbiani G, Hinz B, Chaponnier C, Brown RA. Myofibroblasts and mechano‐regulation of connective tissue remodelling. Nat Rev Mol Cell Biol. 2002;3(5):349‐363. [DOI] [PubMed] [Google Scholar]
- 28. Kendall RT, Feghali‐Bostwick CA. Fibroblasts in fibrosis: novel roles and mediators. Front Pharmacol. 2014;5:123. [DOI] [PMC free article] [PubMed] [Google Scholar]
- 29. Van Beneden K, Mannaerts I, Pauwels M, Van den Branden C, van Grunsven LA. HDAC inhibitors in experimental liver and kidney fibrosis. Fibrogenesis Tissue Repair. 2013;6(1):1. [DOI] [PMC free article] [PubMed] [Google Scholar]
- 30. Jinbo T, Motoki M, Yamamoto S. Variation of serum alpha2‐macroglobulin concentration in healthy rats and rats inoculated with Staphylococcus aureus or subjected to surgery. Comp Med. 2001;51(4):332‐335. [PubMed] [Google Scholar]
- 31. Li L, Huang W, Li K, et al. Metformin attenuates gefitinib‐induced exacerbation of pulmonary fibrosis by inhibition of TGF‐beta signaling pathway. Oncotarget. 2015;6(41):43605‐43619. [DOI] [PMC free article] [PubMed] [Google Scholar]
- 32. Fielding CA, Jones GW, McLoughlin RM, et al. Interleukin‐6 signaling drives fibrosis in unresolved inflammation. Immunity. 2014;40(1):40‐50. [DOI] [PMC free article] [PubMed] [Google Scholar]
- 33. Dinarello CA. Anti‐inflammatory agents: present and future. Cell. 2010;140(6):935‐950. [DOI] [PMC free article] [PubMed] [Google Scholar]
- 34. Altintas N, Erboga M, Aktas C, et al. Protective effect of infliximab, a tumor necrosis factor‐alfa inhibitor, on bleomycin‐induced lung fibrosis in rats. Inflammation. 2016;39(1):65‐78. [DOI] [PubMed] [Google Scholar]
- 35. Maloney WJ. The stiff total knee arthroplasty: evaluation and management. J Arthroplasty. 2002;17(4 Suppl 1):71‐73. [DOI] [PubMed] [Google Scholar]
Associated Data
This section collects any data citations, data availability statements, or supplementary materials included in this article.
Supplementary Materials
Data S1.


