Abstract
To further explore cocombustion technology with biogas and coal, a series of numerical simulations have been carried out to analyze the effects of the cocombustion ratio ξ, height of biogas nozzle HGN, and tilt angle of burner θBN on combustion characteristics in a 300 MW four-corner tangential boiler furnace. Three types of biogas are gasified from straw, sawdust, and raw wood when air serves as the gasification agent. The velocity field, temperature field, and NO emissions have been comprehensively analyzed when the values of ξ, HGN, and θBN range, respectively, from 0.02 to 0.12, from 17.3 to 20.3 m, and from −15° to +15°. Results showed that the NO concentration at the furnace outlet monotonously decreased with ξ. The injection of biogas reduces both the peak temperature of the entire boiler furnace and the NO concentration at the furnace outlet. The NO emission concentration decreases with the increased ξ value for all types of biogases. The cocombustion with sawdust biogas indicates the least NO emission at a fixed cocombustion ratio. Furthermore, reducing the furnace height at HGN = 17.3 m or titling down the burner at θBN = −15° contributed to a greater NO concentration at the furnace outlet.
1. Introduction
To achieve the goal of carbon neutrality and the carbon peak, renewable energy generation has been rapidly developed over the past few years. Among the adopted methods, the coupled combustion of biomass and coal has garnered considerable attention from researchers. This technology leverages the existing boilers and auxiliary systems in current coal-fired power plants,1 offering advantages such as lower initial costs, heightened efficiency in biomass power supply, and reduced CO2 and NOx emissions by comparing with the traditional power generation methods.2−4 Consequently, coupled biomass–coal power generation has emerged as an effective means of enhancing the utilization of biomass energy and curbing pollutant emissions in existing coal power plants.5 To reduce greenhouse gas emissions and increase the proportion of renewable energy use globally, cocombustion with biogas in the coal-fired boiler has been widely studied for power generation.6,7
Cocombustion technology with biogas and coal in a boiler uses biomass feedstock indirectly. Biogas is initially obtained through the gasification process. The biomass gasification reactors can be broadly divided into two categories: the fixed bed gasifier and fluidized bed gasifier.8 The fluidized bed gasification, particularly with bubbling fluidized beds and circulating fluidized beds, is the most widely adopted method.9,10 In terms of the cocombustion technology, the biogas is injected into the coal-fired boiler furnace, offering advantages such as accommodating a wide range of fuel types and preventing slag formation and corrosion within the furnace.11 Research indicates that cocombustion of biogas and coal influences the characteristics of ignition and combustion.12 Simultaneously, coal combustion enhances the stability of biogas combustion, fostering an interactive relationship with the furnace. Understanding the coupled combustion dynamics is crucial to improving cocombustion efficiency and reducing the discharge of pollutants such as NOx.13
Conducting large-scale experiments in practical coal-fired boilers is both time-consuming and expensive. Consequently, computational fluid dynamics (CFD) has emerged as a crucial and cost-effective method for boiler design. With sophisticated simulation tools and appropriate submodels, CFD allows for the accurate handling of complex physical and chemical processes involved in coal combustion. These simulations have found successful application in tangentially coal-fired boilers, addressing diverse aspects such as gas–solid flow, temperature variations, combustion, NOx emissions, and boiler modifications.14,15 Numerous studies have utilized nonpremixed combustion (NPC) models to fit the volatile combustion model. For instance, Adamczyk et al.16 conducted numerical simulations using the NPC model to investigate the impact of syngas injection on NOx emissions in large-scale boilers. Their findings revealed that the injection of syngas through overfire air (OFA) nozzles enhances combustion efficiency. Drosatos et al.17 conducted numerical investigations utilizing the NPC model to study the impact of biomass on combustion stability in low-load boilers. To address inaccuracies in calculating unburned coke in fly ash during multistage fuel combustion, the double-mixed fractional probability density function (PDF) model was employed. Dong et al.18 used the PDF model to numerically investigate a 600 MW boiler that employed cocombustion of biogas and coal when the cocombustion ratio ξ was less than 0.05. They observed a 50–70% reduction in NOx emissions when OFA was injected compared with the original pure-coal boiler, and the furnace temperature was slightly reduced. These numerical findings were corroborated by the corresponding experimental conclusions. Álvarez et al.19 performed numerical simulations using the PDF model to examine a boiler involving cocombustion of biomass and coal at ξ = 0.02. Their findings indicated that biomass cocombustion enhanced the burnout rate, reduced NOx emissions in the coal-fired boiler, and lowered the peak temperature of the entire furnace.
Despite biogas being a significant prospect for future renewable energy, optimizing performance in this cocombustion technology poses challenges. Due to the limitation of biomass resources in its storage and transportation, it is a great challenge to meet the substantial demand for biogas in large-scale boilers.20−22 At present, the exploration of cocombustion technology applied in large-scale boilers is still limited, especially when the cocombustion ratio is greater than 0.02. Furthermore, it is necessary to analyze the effect of the height of biogas nozzle HGN and tilt angle of burner θBN on combustion characteristics and NOx emission. Therefore, the present study presents a numerical simulation for the biogas cocombustion technology in a 300 MW four-corner tangential coal-fired boiler furnace. The cocombustion characteristic has been quantitatively analyzed when the cocombustion ratio, the height position of the biogas nozzle, and the tilt angle of burners are varied. This research is expected to enrich the development of cocombustion technology and the theoretical foundation of the biomass energy utilization technology.
2. Model and Method
2.1. Preparation of Biogas
The composition and heating value of biogas are directly influenced by the feedstock composition and gasification process. The product biogas is prepared through the gasification experiment conducted in a two-stage fixed bed. Figure 1 depicts the flowchart that illustrates the biomass gasification process. First, the biomass feedstock undergoes decomposition in the prereactor before entering the gasifier to interact with incoming air, selected as the gasification agent. The product biogas is subsequently separated by using a gas–solid separator. The H2, CH4, CO2, O2, and N2 contents in the product biogas are analyzed via gas chromatography.
Figure 1.
Flowchart of the biomass gasification process.
Three types of biomass feedstock—straw, raw wood, and sawdust—are utilized. The properties of these biomass raw materials are detailed in Table 1. Additionally, DAF stands for dry ash-free basis, and HHV denotes a high heating value. Table 2 presents the key performance parameters of the three types of biogases. The low heating values (LHV) for the biogases derived from sawdust, raw wood, and straw are 5.32, 6.71, and 6.16 kJ/m3, respectively.
Table 1. Properties of Biomass Feedstock Used in Experiments.
| feedstock | moisture | bulk density | ultimate analysis | proximate analysis | HHV | ||||||
|---|---|---|---|---|---|---|---|---|---|---|---|
| (wet basis) | (wt % dry basis) | DAF | |||||||||
| (wt %) | (kg/m3) | C | H | O | N | S | V | FC | A | (MJ/kg) | |
| straw | 9.2 | 110.5 | 41 | 5.6 | 39.4 | 3.9 | 0.1 | 70.9 | 19.1 | 10 | 16.6 |
| raw wood | 13.3 | 672.8 | 53.5 | 5.9 | 39.6 | 0.1 | 0 | 82.4 | 16.7 | 0.9 | 21.7 |
| sawdust | 10.2 | 262.6 | 48.8 | 5.8 | 44.3 | 0 | 0 | 82.8 | 16.1 | 1.1 | 17.8 |
Table 2. Characteristics of Product Biogas.
| biogas | low heating value (kJ/m3) | volume fraction | ||||||
|---|---|---|---|---|---|---|---|---|
| CO | H2 | CH4 | CO2 | C2Hm | N2 | H2O | ||
| straw | 5.32 | 25.25 | 21.32 | 1 | 8 | 0.1 | 40.3 | 4.13 |
| raw wood | 6.71 | 20.2 | 22.18 | 1.2 | 12.93 | 3.50 | 36.6 | 6.89 |
| sawdust | 6.16 | 26.20 | 21.04 | 0.39 | 6.89 | 1.45 | 41.90 | 3.60 |
2.2. Physical Model
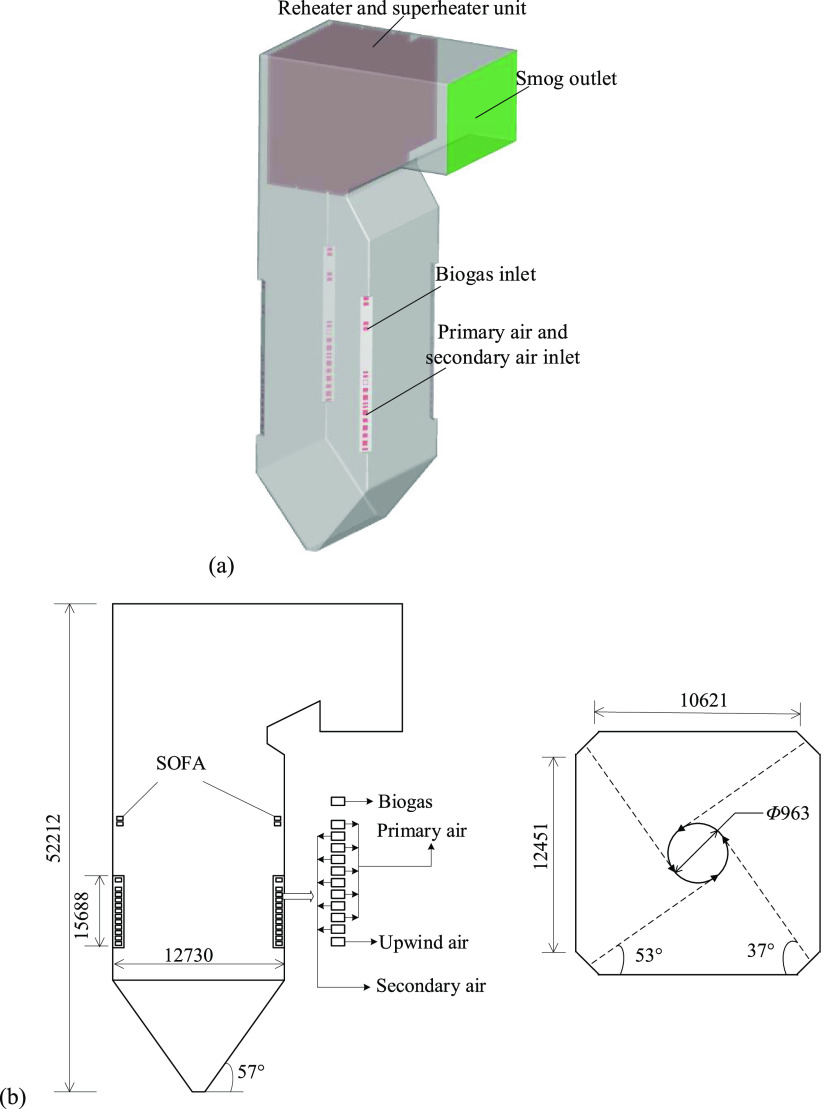
Figure 2 illustrates the numerical furnace model and burner arrangement designed for a 300 MW four-corner tangential boiler. This subcritical pressure boiler employs once-through intermediate reheating, single-furnace-balanced ventilation, and natural circulation. It features a compact enclosed π-shaped layout supported by a fully steel frame suspension structure. The tangential combustion method offers several advantages such as effective flame distribution, high combustion efficiency, simple operation, and coal adaptability. Hence, this furnace design has been extensively applied in pure-coal power plants. The boiler incorporates components such as a wall-type reheater, screen-type reheater, final-stage superheater, economizer, and air preheater. Combustion residues are collected in the ash hopper and discharged in solid form. The approximate dimensions of the boiler are 52.2 m in height and 12.7 m in width.
Figure 2.
Diagram of the 300 MW four-corner tangential furnace (a) and burner arrangement (b).
The burner nozzles are composed of the primary air nozzles and second air nozzles. The burner air nozzles are featured as a perimeter air supply, generating a tangential circle with a diameter of 963 mm. The furnace comprises 4 layers of 16 burner nozzles, and the primary air nozzles inject a mixture of coal powder and high-speed airflow into the furnace. Furthermore, there are seven layers of secondary air nozzles, four layers of separated overfire air (SOFA, z = 23 m) nozzles, and one layer of biogas (z = 18.8 m) nozzles. The distribution of the inlet airflow is detailed in Table 3, with the primary airflow accounting for a flow ratio of 19.63%, while the secondary airflow constitutes 80.37% of the total.
Table 3. Air Distribution Situation in the Furnace.
| flow rate (%) | velocity (m/s) | temperature (K) | |
|---|---|---|---|
| primary air flow | 19.63 | 31.36 | 400 |
| secondary air flow | 80.37 | 47 | 596 |
The elemental analysis and industrial analysis of the chosen coal are listed in Table 4. The symbols of M, A, V, and FC, respectively, represent the mass fraction of the moisture, ash, volatiles, and fixed carbon contents. The heating value of coal is 23 MJ/kg. The average particle diameter, dispersion coefficient, and inlet temperature of the pulverized coal are 8.60 × 10⁻⁵ m, 1.4, and 350 K, respectively. The mass rate of the injected coal power is 2.8 kg/s. During the cocombustion of coal and biogas in the boiler furnace, the excess air coefficient for pulverized coal remains at 1.2.
Table 4. Elemental Analysis and Industrial Analysis of Coal.
| industrial analysis (wt %) | heating value (J g–1) | elemental analysis (wt %) | ||||||||
|---|---|---|---|---|---|---|---|---|---|---|
| M | A | V | FC | C | H | N | S | O | ||
| coal | 1.81 | 27.42 | 24.1 | 46.67 | 23,004 | 57.07 | 2.39 | 0.92 | 0.88 | 9.51 |
2.3. Numerical Method and Validation
During the modeling process, appropriate simplifications are implemented. The water-cooled wall and the screen-type heat exchanger on the furnace roof are assumed to be thermally stable. Additionally, the thicknesses of all of the side walls are considered zero. Based on the governing equation set of mass conservation, momentum conservation, and energy conservation equations, the mathematical model for the detailed combustion process can be established. To ensure accuracy in numerical study, appropriate models have been selected, such as the RNG k–ε turbulent model, P-1 radiation model, double-mixed fractional PDF model, and discrete phase model. Additionally, the devolatilization has been analyzed by using a dual competing rate model. The Boussinesq approximation is adopted as well. The NOx model employed incorporates both thermal NOx and fuel NOx pathways.23 The PDF model operates by integrating the scalar pulsation correlation matrix, vector pulsation correlation matrix, and nonlinear chemical reaction source terms into the joint probability density function to determine the scalar and vector properties.24 The detailed expression of the governing equations can be found in Appendix I.
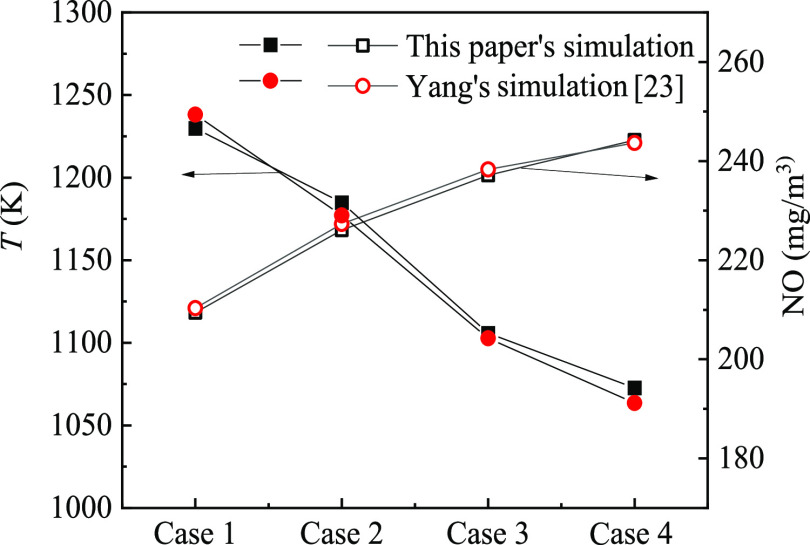
The present study employs Fluent software with the SIMPLE algorithm to solve pressure–velocity interactions in a noncoupling manner. In order to validate the applicability and accuracy of the numerical method, four operating conditions of biogas cocombustion in a tangentially coal-fired boiler have been simulated. The work of Dr. Yang has been used as a reference,23 where Case 1 represents a boiler load of 544 MW without biogas injection. Case 2, Case 3, and Case 4, respectively, represent the boiler load of 544, 480, and 380 MW with biogas injection at the cocombustion ratio of 0.02. Figure 3 indicates that the outlet temperature and the outlet NO concentration CNO deviate by less than 5% from Dr. Yang’s numerical results. The margin of error remains within an acceptable range, demonstrating the accuracy and rationality of the utilized double-mixed fractional PDF model in this numerical study.
Figure 3.
Comparison of the temperature T (solid symbols) and the NO concentration CNO (hollow symbols) at the furnace outlet.23
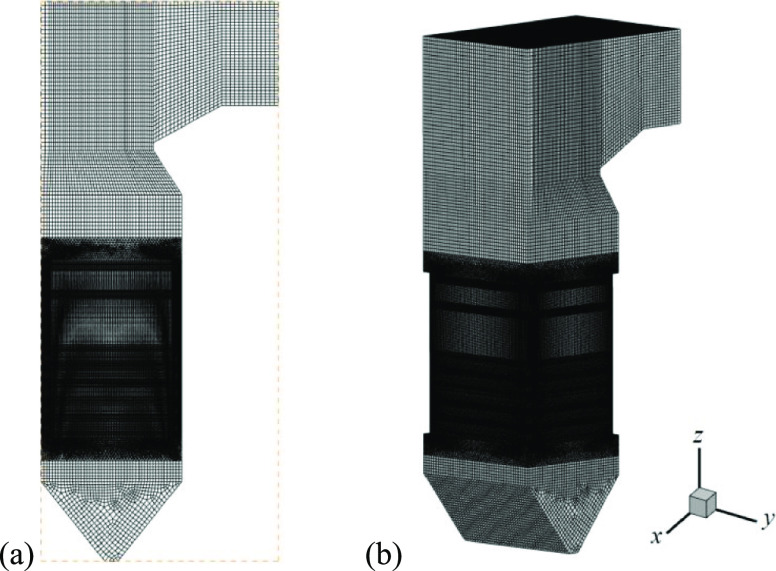
The numerical grid diagram for the 300 MW four-corner tangential coal-fired boiler furnace is depicted in Figure 4. To ensure the iteration speed and computational accuracy, the boiler furnace is segmented into distinct zones, including a cold ash hopper zone, a lower burner zone, a burner zone, an upper burner zone, and a heat exchanger zone. High-quality hexahedral grids are employed in the bulk zone, with refined grids specifically in the burner zone to reduce pseudodiffusion. Grid interfaces are established at zone boundaries to facilitate normal data transfer between the grids. Three types of grids were examined, as outlined in Table 5. Comparison of the calculated temperatures T and NO concentrations CNO at the furnace outlet using different meshes reveals relative errors E(T) and E(CNO) within 2%. To balance computational efficiency and accuracy, the grid number of 1,790,128 is considered suitable for a further numerical study.
Figure 4.
Grid diagram from the front view (a) and 45° view (b).
Table 5. Comparison of the Temperature and NO Concentration at the Furnace Outlet with Different Meshes.
| mesh number | 1611115 | 1790128 | 1879634 |
|---|---|---|---|
| T | 1121.1 | 1118.3 | 1117.7 |
| E(T) | 0.25% | 0 | 0.05% |
| CNO | 242.25 | 246.61 | 247.12 |
| E(CNO) | 1.77% | 0 | 0.19% |
3. Results and Discussion
The cocombustion ratio ξ represents the ratio of the theoretical combustion heat of biogas to pulverized coal. For example, ξ = 0 indicates the absence of biogas injected into the boiler furnace. At ξ = 0.1, the combustion heat of the injected biogas constitutes 10% of the total heat supply in the furnace, while that of pulverized coal contributes 90%. Despite the variability in the ξ value, the combined theoretical combustion heats of biogas and coal entering the furnace remain constant. Consequently, as the amount of biogas introduced into the furnace increases, the flow rate of pulverized coal decreases proportionally.
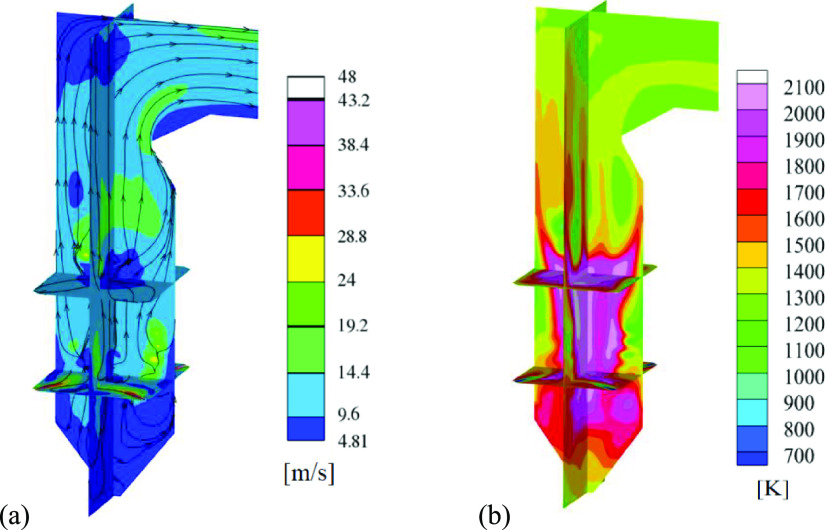
It is found that both velocity and temperature distribution patterns exhibit similarity when the cocombustion ratio and biogas types are varied. Representative distribution patterns of velocity and temperature at ξ = 0.1 for straw biogas are presented in Figure 5. Observations reveal nonuniform airflow velocities along the upward direction of the boiler furnace. The airflow velocity at the bottom of the furnace remains low. And then it increases notably within the main combustion zone owing to the jet flow from the primary and secondary nozzles. In contrast, the airflow decreases its speed in the regions due to the hindrance of the heat exchangers and economizer. As the flame travels upward, the cross-sectional temperature gradually increases to a peak in the burner zone. Then it falls monotonously in the higher zone due to the reduction in the amount of pulverized coal that can be burned. The temperature distribution indicates efficient combustion of the pulverized coal in the upper region. The greatest temperature reduction occurs in the top area of the furnace where the heat in the furnace is delivered through the reheater and superheater. Notably, the furnace temperature remains within the safe operating range with the maximum temperature below 1350.5 K.
Figure 5.
Distributions of velocity (a) and temperature (b) in the cross section and longitudinal section of the furnace for straw biogas with ξ = 0.1.
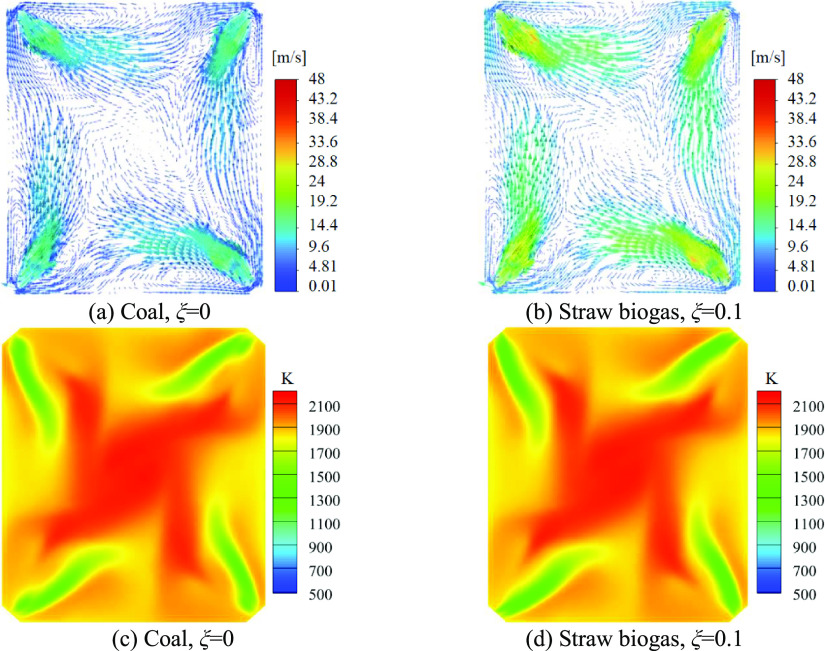
Figure 6 shows cross-sectional diagrams of the velocity vector distribution and the temperature distribution at the first-layer primary air nozzles located at z = 13.2 m. All air nozzles contribute to a well-formed tangential velocity circle, ensuring a reasonable velocity field distribution in the furnace chamber and meeting the requirements for fuel combustion. Tangential circular airflow shapes the temperature profiles at cross sections. The velocity and temperature distributions across the cross-sectional are axisymmetric. Examination reveals a higher airflow velocity near the furnace walls, which gradually decreases toward the center area. It should be noted that the cross-sectional velocity profiles for the same ξ values remain consistent whether the biogas is derived from straw, sawdust, or raw wood. The high-temperature region predominantly surrounds the burner, with the peak temperature occurring near the burner nozzles. The velocity and temperature distributions are consistent with the findings from Dr. Yang’s research.23 The above conclusions also prove that employing the double-mixed fractional PDF model in numerical simulations of the biogas and coal cocombustion yields convincing results.
Figure 6.
Diagrams of velocity vectors (a,b) and temperature distribution (c,d) in the cross-section of the first-layer primary air nozzles at z = 13.2 m.
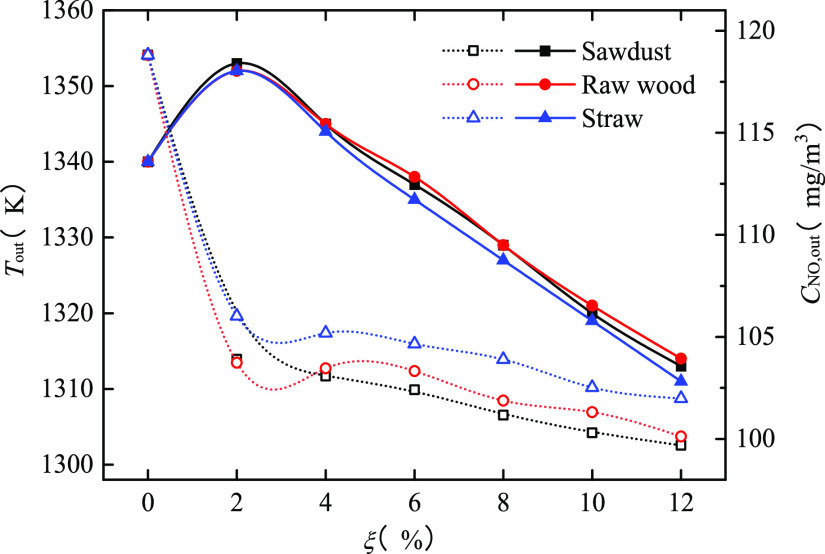
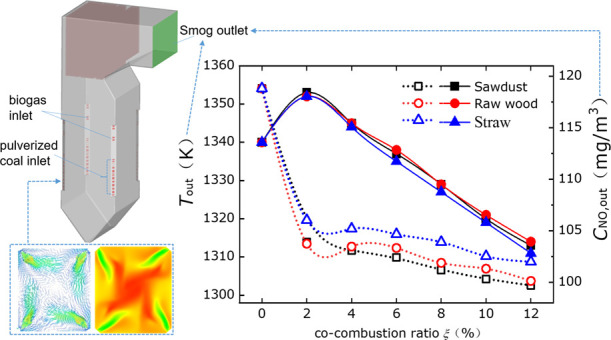
Figure 7 illustrates that both the temperature and the NO concentration CNO at the boiler furnace outlet first increase and then decrease with increasing ξ. When the ξ value ranges from 0.02 to 0.12, the variations of the outlet temperature are almost coincident for the three types of biogases, i.e., sawdust, raw wood, and straw. It is also ascribed to the comparable heating values of these biogases. The outlet temperature ranges from 1310 to 1350.5 K, which is in accordance with the findings of Dr. Yang’s research.23 The introduction of straw biogas results in an outlet temperature of the furnace lower than the introduction of the other two biogases. Figure 7 also shows that the outlet NO concentration for straw biogas cocombustion exceeds those of sawdust and raw wood biogases. It is resulted from the larger nitrogen content in straw biogas. As ξ increases, the NO emission concentration decreases steadily. The outlet NO concentration is ∼119 mg/m3 for pure coal (ξ = 0), while it decreases to ∼100 mg/m3 for sawdust biogas at ξ = 0.12. The increased ξ value corresponds to an elevated flow rate of the injected biogas, resulting in a lower local excess air coefficient near the biogas nozzles. This limits the air available for coke burning, thereby reducing unburned coke reaching the SOFA region.25,26 Consequently, the NO emission concentration decreases with the increased cocombustion ratio ξ across all types of biogases. The fact that the NO emission is inversely proportional to the cocombustion ratio is consistent with the findings of Yang’s work.27,28
Figure 7.
Variation in the outlet temperature Tout (solid symbols) and the outlet NO concentration CNO (hollow symbols) with the cocombustion ratio ξ.
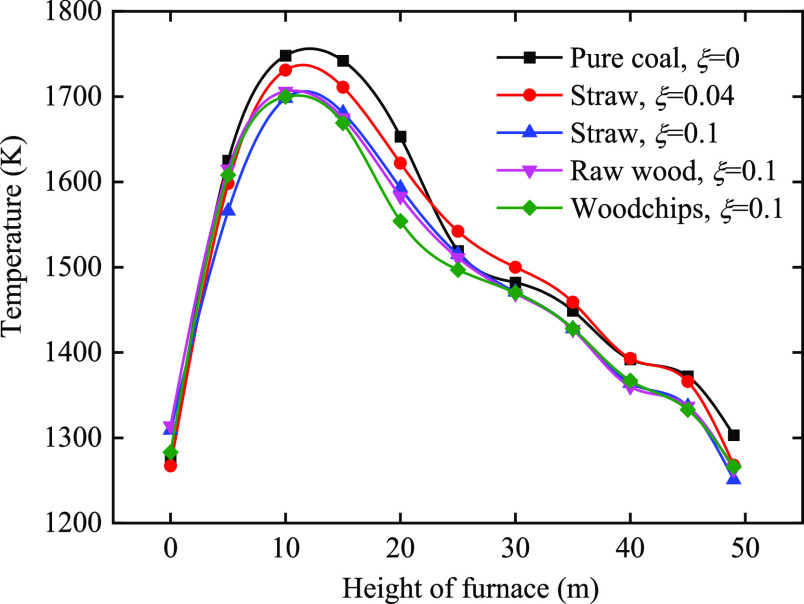
Figure 8 depicts the cross-sectional temperature distribution along the height of the boiler furnace for cocombustion ratios at ξ = 0, 0.04, and 0.1. Throughout the entire furnace, flame temperatures remain within a safe operating temperature range. The cross-sectional temperature increases sharply from the cold ash hopper zone to the combustion zone. Within the burner zone, the temperature increases significantly owing to the alternating arrangement of primary and secondary air nozzles. In the transition zone above the burner zone, the cross-sectional temperature continues to rise due to the vigorous mixing of airflow and pulverized coal. The high-temperature zone spans approximately z = 7.5 m to z = 20 m, corresponding to the SOFA zone. Above the SOFA zone, the temperature gradually decreases as a result of the lower combustion intensity and the addition of colder airflow through the biogas nozzles. Subsequently, the temperature gradually decreases as the flame gas exchanges heat with the water-cooled walls and the superheater unit in the furnace top.
Figure 8.
Variation in cross-sectional temperature with furnace height at different cocombustion ratios.
It is also indicated in Figure 8 that the introduction of biogas reduces the peak temperature of the entire boiler furnace. The cross-sectional temperature decreases as the ξ value increases. Given the similar heating values among the three types of biogases, the average cross-sectional temperature values remain consistent at identical cocombustion ratios. Compared to pure coal combustion, the addition of biogas results in lower temperatures in the cross sections of the boiler furnace, especially for the cases of the larger cocombustion ratio than 0.06. As for the cases of ξ = 0.02 and ξ = 0.04, the cross-sectional temperature in the SOFA zone is slightly higher than that of the pure coal case. It is because the introduction of biogas in the transition zone extends the combustion process and increases heat release. Consequently, the average temperature in the SOFA zone of the furnace is relatively higher than in the case of pure coal combustion. However, in the SOFA zone, the pulverized coal content becomes much less when the ξ value is greater than 0.06. In this case, the cocombustion of coal and biogas releases less heat than pure coal combustion in the SOFA zone.
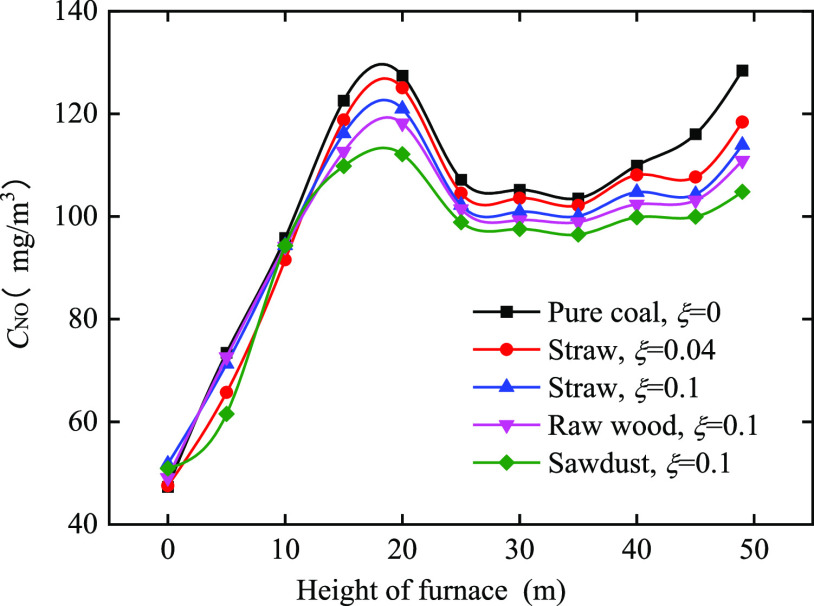
The simulation result indicates that the cross-sectional distribution patterns of CNO remain consistent across various ξ values. The distribution of CNO is influenced by the tangential circular airflow, which is similar to the temperature distribution. Figure 9 illustrates the variation in NO concentration CNO with furnace height at different cocombustion ratios. The cross-sectional NO concentration initially increases along the height direction and subsequently decreases. The highest NO concentration occurs in the SOFA zone. In this zone, the introduction of biogas dilutes the original NO, leading to a temporary decrease in CNO value. However, the rapid combustion of biogas accelerates the reaction rate of coke, releasing nitrogen and subsequently elevating NO concentration.28−30 Furthermore, the variations in the ξ value significantly impact the NO conversion characteristics of the biogas in different furnace areas. As the ξ value increases from 0.02 to 0.12, the total flow rate of biogas content such as CO, H2, and CH4 also increases, intensifying the reduction effect on NO.31 Due to the homogeneous and heterogeneous reduction of NO, the introduction of biogas can effectively reduce NO emissions. Figure 9 also indicates that in the upper half part of the boiler furnace, the NO concentration for straw biogas cocombustion exceeds those of sawdust and raw wood biogases. This is due to the larger nitrogen content in straw biogas, as shown in Table 2.
Figure 9.
Variation in cross-sectional NO concentration CNO with furnace height at different cocombustion ratios.
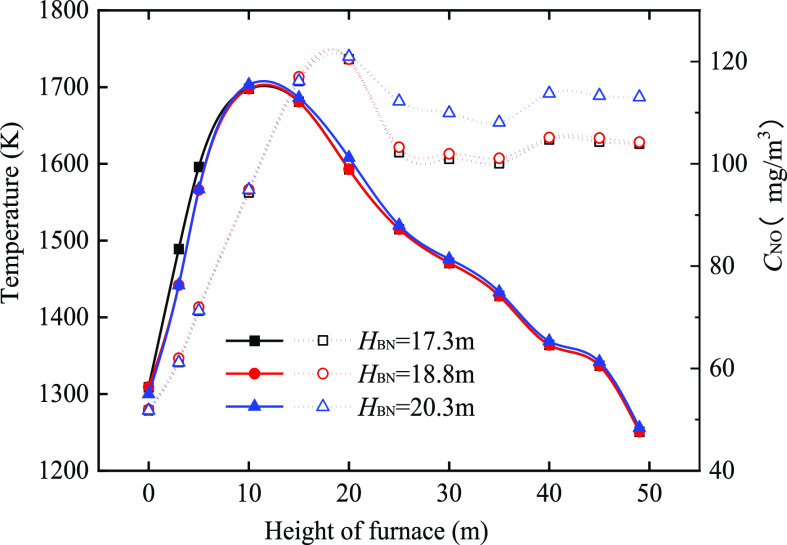
In the present furnace model, the height of the biogas nozzle is set at HGN = 18.8 m. To examine the impact of the biogas nozzle position on combustion characteristics, the nozzles are adjusted upward and downward by 1.5 m, corresponding to HGN = 17.3 m and HGN = 20.3 m, respectively. Figure 10 illustrates the variations in the cross-sectional temperature and NO concentration with the furnace height under a fixed ξ of 0.1 for straw biogas. The temperature curves for the different position of biogas nozzles generally seem to overlap. In the upper part of the boiler furnace, the cross-sectional temperature for the case of HGN = 20.3 m is slightly larger than that for the other cases. Overall, the adjustment of the biogas nozzle position has negligible influence on the cross-sectional temperature, presumably because the movement range of the biogas nozzle is far less than the furnace height. However, when the nozzle height is HGN = 20.3 m, the cross-sectional NO concentration is significantly higher than the other two HGN values. Lower placement for the biogas nozzle accelerates coke burning owing to the dilution and combustion-supporting effects of biogas. Conversely, higher placement for the biogas nozzle prolongs the coke combustion process toward the upper furnace, causing a release of coke nitrogen upward. Consequently, the NO concentration is higher at HGN = 20.3 m than at HGN = 17.3 m and HGN = 18.8 m at the outlet of the furnace.
Figure 10.
Variations in temperature (solid symbols) and NO concentration (hollow symbols) with the furnace height for different positions of the straw biogas nozzle at ξ = 0.1.
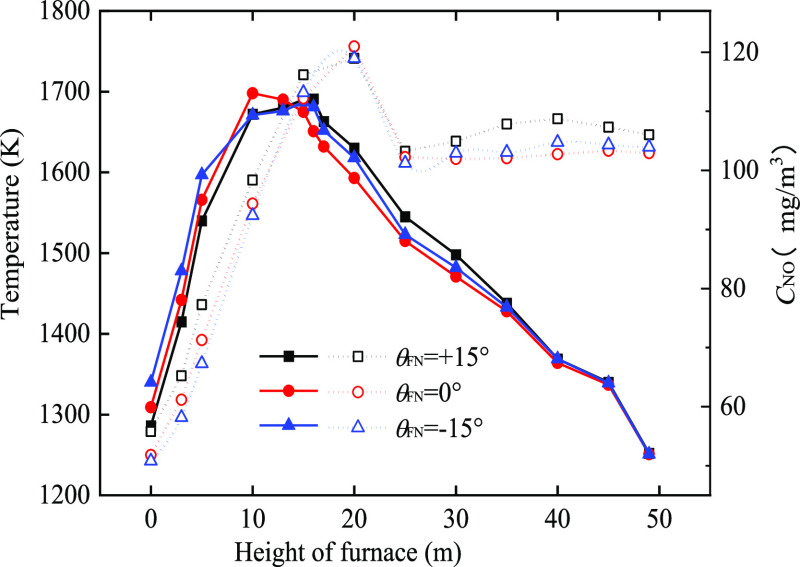
Figure 11 demonstrates the variation in the cross-sectional temperature and NO concentration with the furnace height at different tilt angles θBN of the burner nozzles. For the cases of tilting the burners up to 15° (θBN = +15°) and down to 15° (θBN = −15°), oxygen reduction occurs in the burner zone and the transition zone. As a result, the cross-sectional temperature in these zones is lower than that of the case at θBN = 0°. The upward movement of the total fuel flow elevates the height of the burner zone at θBN = +15° and θBN = −15°. For the case of θBN = −15°, the cross-sectional temperature in the furnace bottom is greater than that of the other two cases. For areas with reheaters and preheaters installed in the upper part of the furnace, the cross-sectional temperature variation curves for the three tilt angle cases are almost overlapping. The surfaces of these reheaters and preheaters are set at constant temperatures. This stability is crucial to ensure a consistent steam quality. As for the variation of the cross-sectional NO concentration, the curves are clearly distinguishable for different tilt angles. Due to the upward movement of the burner zone, the cross-sectional NO concentration for both the cases of θBN = +15° and θBN = −15° is relatively lower than that at θBN = 0° in the lower half of the boiler furnace. Accordingly, more portion of the fuel flow is burned in the upper part of the furnace in the cases of θBN = +15° and θBN = −15°. Therefore, the tilt angle of θBN = +15° exhibits a larger outlet NO concentration than the case of θBN = 0°. And the outlet NO concentration of θBN = −15° is in between.
Figure 11.
Variations in cross-sectional temperature (solid symbols) and NO concentration (hollow symbols) with the furnace height for different tilt angle of burners θBN at ξ = 0.1 for the straw biogas.
4. Conclusions
Three types of biogases—derived from straw, sawdust, and raw wood—were applied in numerical simulations of combustion characteristics in a 300 MW four-corner tangential boiler furnace. The effects of the cocombustion ratio, biogas nozzle height, and burner tilt angle on the temperature fields and NO emissions were analyzed. Conclusions are listed as follows.
-
1.
The introduced biogas reduces the peak temperature of the entire boiler furnace. The furnace temperature remains within the safe operating range.
-
2.
The NO emission concentration decreases with the increased cocombustion ratio ξ across all types of biogases. Due to the greater nitrogen content, the straw biogas for coal cocombustion exhibits a higher outlet NO concentration than the sawdust and raw wood biogases.
-
3.
The biogas nozzle position has less effect on the furnace temperature distribution, while higher placement for the biogas nozzle of HGN = 20.3 m causes the larger NO concentration at the furnace outlet than the cases of HGN = 17.3 m and HGN = 18.8 m.
-
4.
Tilting the burners up to 15° (θBN = +15°) or down to 15° (θBN = −15°) elevates the height of the burner zone and causes the increase in NO concentration at the furnace outlet.
Acknowledgments
This work was supported by the Project of Prosperity of Science and Technology for China Power Construction Chengdu Institute (No. P54022) and Power China Construction Group Urban Planning and Design Research Institute Corporation Limited, Guangzhou, China.
Glossary
Nomenclature
- A
ash content (wt %)
- CNO
mass fraction of NO (wt %)
- DAF
dry ash-free basis
- E(T)
relative error of temperature
- E(CNO)
relative error of CNO
- FC
fixed carbon content (wt %)
- HGN
height of the biogas nozzle (m)
- LHV
low heating value (MJ/kg)
- M
moisture content (wt %)
- OFA
overfire air
- SOFA
separated overfire air
- T
temperature (K)
- u, v, w
velocities in x, y, and z directions (m/s)
- V
volatile content (wt %)
- x, y, z
coordinates (m)
Greek letters
- ξ
cocombustion ratio
- θBN
tilt angle of burner (deg)
Subscripts
- BN
burner nozzle
- GN
biogas nozzle
Appendix I
Continuity equation for incompressible airflow:
| 1 |
Momentum conservation equation:
| 2 |
Energy conservation equation:
| 3 |
where  .
.
Molecular motion shear force:
| 4 |
Pulsating transportation equation of the turbulence flow:
| 5 |
where μt = Cμρk2/ε.
Turbulent kinetic energy:
| 6 |
The governing equation for turbulent kinetic energy:
| 7 |
where Fx, Fy, and Fz refer to the reaction force of the coal particle on the air flow.
The dissipation rate transport model:
| 8 |
According to the deformation on the instantaneous quantity equation and the combination of the linearity assumption, the dissipation rate equation can be obtained as
| 9 |
For chemical reaction simulation, the double-mixed fractional PDF model of conserved scalar is utilized.
| 10 |
| 11 |
where f’ = f–f̅.
| 12 |
where Zk stands for the mass fraction of element k. The subscripts F and O, respectively, refer to the fuel and oxidant.
The motion of pulverized coal particles is simulated using the discrete phase model (DPM). At Cartesian coordinates, the particle inertial force is described as
| 13 |
where FD(u – up) is the unit mass of drag force.
| 14 |
in which u, μ, and ρ are, respectively, the velocity, viscosity, and density of the fluid phase. up, ρp, and dp refer to the velocity, density, and diameter of the particles.
Re is the relative Reynolds number for particles. It is defined as
| 15 |
The expression of the drag coefficient CD is
| 16 |
where the Reynolds number is in a certain range, and the factors a1, a2, and a3 are constant values.
The additional force F caused by the acceleration of the fluid around the particle is expressed as
| 17 |
The P-1 radiation model is adopted for the simulation of radiation heat transfer. Considering that the coal particle is the gray medium that contains the properties of absorption, emission, and scattering, the equation of radiative heat transfer is defined as
| 18 |
where Ep is the equivalent radiant value; ap is the equivalent absorption coefficient; G is the incident radiation; a and σs refer to the absorption coefficient and the scattering coefficient, respectively; and C is the linear anisotropy phase function coefficient. The factor Γ is defined as
| 19 |
Data Availability Statement
The data that supports the findings of this study are available within the article.
The authors declare no competing financial interest.
References
- Allguren T.; Andersson K.; Fry A.; Eddings E. G. NO formation during co-combustion of coal with two thermally treated biomasses. Fuel Process. Technol. 2022, 235, 107365 10.1016/j.fuproc.2022.107365. [DOI] [Google Scholar]
- Deng M. S.; Zhang P. X.; Nie Y. Z.; Shi Y.; Yang H. Y.; Wu D.; Ma R. J. How to improve pollutant emission performances of household biomass cookstoves: A review. Energy Build. 2023, 295, 113316 10.1016/j.enbuild.2023.113316. [DOI] [Google Scholar]
- Liu Q.; Zhong W.; Zhou J.; Yu Z. Effects of S and Al on K migration and transformation during coal and biomass co-combustion. ACS Omega 2022, 7 (18), 15880–15891. 10.1021/acsomega.2c00994. [DOI] [PMC free article] [PubMed] [Google Scholar]
- Duval-Dachary S.; Beauchet S.; Lorne D.; Salou T.; Helias A.; Pastor A. Life cycle assessment of bioenergy with carbon capture and storage systems: Critical review of life cycle inventories. Renewable & Sustainable Energy Reviews 2023, 183, 113415 10.1016/j.rser.2023.113415. [DOI] [Google Scholar]
- Li J.; Brzdekiewicz A.; Yang W. H.; Blasiak W. Co-firing based on biomass torrefaction in a pulverized coal boiler with aim of 100% fuel switching. Applied Energy 2012, 99, 344–354. 10.1016/j.apenergy.2012.05.046. [DOI] [Google Scholar]
- Liu H. L.; Ye C.; Zhao Y.; Li G. E.; Xu Y. S.; Tang Y. J.; Wang Q. H. Performance analysis of biomass gasification coupled with ultra-supercritical power generation system. Chem. Eng. Process. 2022, 179, 109093 10.1016/j.cep.2022.109093. [DOI] [Google Scholar]
- Liu L.; Ren S.; Yang J.; Jiang D. H.; Guo J. J.; Pu Y. B.; Meng X. P. Experimental study on K migration, ash fouling/slagging behaviors and CO2 emission during co-combustion of rice straw and coal gangue. Energy 2022, 251, 123950 10.1016/j.energy.2022.123950. [DOI] [Google Scholar]
- Benny G.; Ulrik H.; Torben K. The development of a computer model for a fixed bed gasifier and its use for optimization and control. Bioresour. Technol. 2007, 98 (10), 2043–2052. 10.1016/j.biortech.2006.08.019. [DOI] [PubMed] [Google Scholar]
- Basu P.Biomass Gasification and Pyrolysis: Practical Design and Theory. Burlington Press: USA, 2010 [Google Scholar]
- Dai J.; Saayman J. E.; Grace J. R. Gasification of Woody Biomass. Ann. Rev. Chem. Eng. 2013, 6 (1), 77–99. 10.1146/annurev-chembioeng-061114-123310. [DOI] [PubMed] [Google Scholar]
- Liu Y. Q.; Tan W. Y.; Liang S. H.; Bi X. L.; Sun R. Y.; Pan X. J. Comparative study on the co-combustion behavior of torrefied biomass blended with different rank coals. Biomass Convers. Biorefin. 2022, 37 (2), 2190–2215. 10.1007/s13399-022-02368-6. [DOI] [Google Scholar]
- Piotr H.; Janusz L.; Katarzyna M. Biomass gasification and Polish coal-fired boilers for process of reburning in small boilers. Journal of Central South University 2013, 20 (6), 1623–1630. 10.1007/s11771-013-1655-z. [DOI] [Google Scholar]
- Tao J. Y.; Hou L. A.; Li J.; Yan B. B.; Chen G. Y.; Cheng Z. J.; Crittenden J. C. Biomass combustion: Environmental impact of various precombustion processes. J. Cleaner Prod. 2020, 261, 121217 10.1016/j.jclepro.2020.121217. [DOI] [Google Scholar]
- Liu Y. C.; Fan W. D.; Li Y. Numerical investigation of air-staged combustion emphasizing char gasification and gas temperature deviation in a large-scale, tangentially fired pulverized-coal boiler. Appl. Energy 2016, 177, 323–334. 10.1016/j.apenergy.2016.05.135. [DOI] [Google Scholar]
- Lu H.; Huang S. W.; Li H. C.; Cheng Z.; Chang X.; Dong L.; Kong D.; Jing X. Numerical simulation of combustion characteristics in a 660 MW tangentially fired pulverized coal boiler subjected to peak-load regulation. Case Studies in Thermal Engineering 2023, 49, 103168 10.1016/j.csite.2023.103168. [DOI] [Google Scholar]
- Adamczyk W. P.; Werle S.; Ryfa A. Application of the computational method for predicting NOx reduction within large scale coal-fired boiler. Applied Thermal Engineering 2014, 73 (1), 343–350. 10.1016/j.applthermaleng.2014.07.045. [DOI] [Google Scholar]
- Drosatos P.; Nikolopoulos N.; Karampinis E. Comparative investigation of a co-firing scheme in a lignite-fired boiler at very low thermal-load operation using either pre-dried lignite or biomass as supporting fuel. Fuel Process. Technol. 2018, 180, 140–154. 10.1016/j.fuproc.2018.08.011. [DOI] [Google Scholar]
- Dong C. Q.; Yang Y. P.; Yang R. Numerical modeling of the gasification based biomass co-firing in a 600 MW pulverized coal boiler. Appl. Energy 2010, 87, 2834–2838. 10.1016/j.apenergy.2009.05.033. [DOI] [Google Scholar]
- Álvarez L.; Yin C.; Riaza J. Biomass co-firing under oxy-fuel conditions: A computational fluid dynamics modelling study and experimental validation. Fuel Process. Technol. 2014, 120, 22–33. 10.1016/j.fuproc.2013.12.005. [DOI] [Google Scholar]
- Tucki K.; Orynycz O.; Wasiak A.; Swic A.; Mieszkalski L.; Wichlacz J. Low emissions resulting from combustion of forest biomass in a small scale heating device. Energies 2020, 13 (20), 5495. 10.3390/en13205495. [DOI] [Google Scholar]
- Xiong Y.; Ning Z. P.; Liu Y. Z.; Gomez M.; Xiao T. F. Emission and transformation behaviors of trace elements during combustion of Cd-rich coals from coal combustion related endemic fluorosis areas of Southwest. China. Ecotoxicology and Environmental Safety 2022, 246, 114145 10.1016/j.ecoenv.2022.114145. [DOI] [PubMed] [Google Scholar]
- Xu L.; Zhu G. Q.; Niu Y. Q. Effect of preheating Co-firing of biomass and coal on the synergistic reduction of PM and NO source emissions. J. Cleaner Prod. 2023, 414, 344–354. 10.1016/j.jclepro.2023.137562. [DOI] [Google Scholar]
- Yang X. D.The Investigation of the Combustion Characteristics and Pollutants Emission Behaviour during the Co-combustion of Biomass and Coal. (Ph.D. Thesis), Zhe Jiang University: China, 2022 [Google Scholar]
- Liang Z. W.; Chen H. W.; Zhao B. Synergetic effects of firing gases/coal blends and adopting deep air staging on combustion characteristics. Appl. Energy 2018, 228, 499–511. 10.1016/j.apenergy.2018.06.116. [DOI] [Google Scholar]
- Nardo A. D.; Calchetti G.; Stendardo S. Modeling and simulation of an oxygen-blown bubbling fluidized bed gasifier using the computational particle-fluid dynamics (CPFD) approach. J. Appl. Fluid Mech. 2018, 11 (4), 825–834. 10.18869/acadpub.jafm.73.247.28397. [DOI] [Google Scholar]
- Panta H. J.; Sharmaa V. K.; Kamudub M. V. Investigation of flow behaviour of coal particles in a pilot-scale fluidized bed gasifier (FBG) using radiotracer technique. Appl. Radiat. Isot. 2009, 67 (9), 1609–1615. 10.1016/j.apradiso.2009.04.003. [DOI] [PubMed] [Google Scholar]
- Yang X. D.; Luo Z. Y.; Yan B. C.; Wang Y. C.; Yu C. J. Evaluation on nitrogen conversion during biomass torrefaction and its blend co-combustion with coal. Bioresour. Technol. 2021, 336, 125309 10.1016/j.biortech.2021.125309. [DOI] [PubMed] [Google Scholar]
- Zhang X. T.; Li K. Y.; Zhang C.; Wang A. J. Performance analysis of biomass gasification coupled with a coal-fired boiler system at various loads. Waste Management 2020, 105, 84–91. 10.1016/j.wasman.2020.01.039. [DOI] [PubMed] [Google Scholar]
- Zhang X. Y.; Zhu S. J.; Zhu J. G.; Hui J. C.; Liu Y. H.; Zhang J. H.; Lyu Q. Preheated combustion characteristics and fuel-nitrogen conversion paths for bituminous coal and anthracite in wide-range preheating temperature. J. Energy Inst. 2023, 108, 101222 10.1016/j.joei.2023.101222. [DOI] [Google Scholar]
- Zhou A. Q.; Xu H. P.; Xu M. C.; Yu W. B.; Li Z. W.; Yang W. M. Numrical investigation of biomass co-combustion with methane for NOx reduction. Energy 2020, 194, 116868 10.1016/j.energy.2019.116868. [DOI] [Google Scholar]
- Yang X. D.; Luo Z. Y.; Liu X. R.; Yu C. J.; Li Y.; Ma Y. C. Experimental and numerical investigation of the combustion characteristics and NO emission behaviour during the co-combustion of biomass and coal. Fuel 2021, 287, 119383 10.1016/j.fuel.2020.119383. [DOI] [Google Scholar]
Associated Data
This section collects any data citations, data availability statements, or supplementary materials included in this article.
Data Availability Statement
The data that supports the findings of this study are available within the article.


