Abstract

Process analytical technology (PAT) has been successfully applied in numerous chemical synthesis cases and is an important tool in pharmaceutical process research and development. PAT brings new methods and opportunities for the real-time monitoring of chemical processes. In multistep synthesis, real-time monitoring of the complex reaction mixtures is a significant challenge but provides an opportunity to enhance reaction understanding and control. In this study, a combined multichannel spectrometer system with both near-infrared and Raman spectroscopy was built, and calibration models were developed to quantify the desired products, intermediates, and impurities in real-time at multiple points along the synthetic pathway. The capabilities of the system have been demonstrated by operating dynamic experiments in both batch and continuous-flow processes. It represents a significant step forward in data-driven, multistep pharmaceutical ingredient synthesis.
Introduction
Process analytical technology (PAT) is an important methodology in pharmaceutical research and development. PAT guidelines of the U.S. Food and Drug Administration (FDA)1,2 recommend the pharmaceutical industry to include planning, analysis, and controlling methods in the product manufacturing process and highlights the importance of controlling process parameters and quality attributes using an appropriate analytical tool.
Real-time monitoring of process parameters is a critical step in the development of the PAT method. A variety of real-time analytical methods for monitoring essential parameters of pharmaceutical processes are available and have been reported.3−5 Inline analytical techniques, such as attenuated total reflection-Fourier transform infrared spectroscopy (ATR-FTIR),6−8 attenuated total reflection UV/visible spectroscopy,9,10 and Raman spectroscopy,11−13 are commonly employed in the development of new pharmaceuticals.
Nowadays, some companies have achieved continuous manufacturing of drugs through the introduction of PAT to the production process. Zhang et al.14 applied ATR-FTIR to collect IR spectroscopy data of the metastable zone and undersaturated zone during the cooling crystallization process of l-glutamic acid. Calibration models of solution concentration were established by using different zone data and a multivariate partial least-squares (PLS) regression algorithm for the collected spectra, together with the corresponding temperature values. The spontaneous nucleation of d-mannitol polymorphs at different initial concentrations in an aqueous solution was investigated by using two PAT tools: Raman spectroscopy combined with focused beam reflectance measurement.15
Among these analytical techniques, Raman spectrometry and near-infrared (NIR) spectroscopy have special advantages. For example, the composition of both solid substances and solutions can be characterized at the same time with real-time Raman analysis.16 In addition, Raman spectroscopy can be utilized to identify unstable intermediates and determine end points by providing real-time concentration data as a function of the process conditions. One of the advantages of NIR spectroscopy over many other analytical techniques is that NIR can achieve full process monitoring and nondestructive in situ monitoring.17
Lifitegrast, developed by Shire, serves as an innovative small-molecule inhibitor that targets integrin receptors.18 In 2016, Lifitegrast (Xiidra) was approved by the FDA for the treatment of xerophthalmia. Lifitegrast, as shown in Figure 1, is composed of three key intermediates.19 3-(Methylsulfonyl)-l-phenylalanine phenylmethyl ester 1 is one of the key intermediates of Lifitegrast and is of considerable significance in the synthesis of Lifitegrast.
Figure 1.
Lifitegrast and the key intermediate.
Its synthetic process involves three reactions (Scheme 1).20 It begins with 3-bromo-N-[(1,1-dimethylethoxy) carbonyl]-l-phenylalanine 2 with a coupling reaction catalyzed by cuprous iodide (CuI)/l-proline, in which high temperatures and the insulation of air are required. The following steps are the EDCI-catalyzed condensation reaction, the deprotection reaction, and saltification. The traditional analytical techniques to monitor the process are offline sampling and high-performance liquid chromatography (HPLC) analysis. Taking samples from the reaction vessel at high temperatures is dangerous and can damage the gas tightness of the reactor. If the reaction time is too long, there will be impurities generated. There thus remains a need for new real-time monitoring tools that are potentially complementary to the mainstream analytical techniques, which will help decide the reaction end point and control the reaction time.
Scheme 1. Synthetic Route of 3-(Methylsulfonyl)-l-phenylalanine Phenylmethyl Ester 1.

In this work, the synthesis of 3-(methylsulfonyl)-l-phenylalanine phenylmethyl ester 1 was chosen as a model process for developing a feedback control system based on in-line Raman spectrometry and NIR spectroscopy. For these purposes, a combined spectrometer system with both NIR and Raman was developed, which provided the advantages that the right spectra technology can be flexibly applied according to the sample composition and that the system could be operated with one software platform and PC. The implementation of the combined spectrometer system in the synthesis of 3-(methylsulfonyl)-l-phenylalanine phenylmethyl ester 1 provides an example, showing its potential opportunities in chemical reaction monitoring.
Experimental Section
Materials
3-(Methylsulfonyl)-l-phenylalanine phenylmethyl ester 1 was synthesized in our laboratory with an HPLC purity of 99.6%. Sodium methanesulfinate (CH3SO2Na, ≥99% assay), l-proline (≥99% purity), and potassium carbonate (K2CO3, ≥99% assay) were kindly supplied by Adamas (Shanghai, China). CuI (Haoyuan Co., Ltd., Shanghai, China, ≥99% assay) and 4-dimethylaminopyridine (DMAP, Haoyuan Ltd., Shanghai, China, ≥98% purity) were used. Dimethyl sulfoxide (DMSO, AR, ≥99.5 GC), dichloromethane (DCM, AR, ≥99.5 GC), and ethyl acetate (AR, ≥99.5 GC) were purchased from Sinopharm Chemical Reagent Co., Ltd. 1-Ethyl-3-(3-dimethyl aminopropyl) carbodiimide (EDCl, ≥98.5% purity) was purchased from Shanghai Macklin Biochemical Technology Co., Ltd.
Equipment
Reactions were performed in a computer-controlled laboratory equipped with a spectrometer system (see Figure 2), which contained the following main parts. The reactor unit of the system was a 250 mL glass vessel, produced by Shanghai Shenbo Glass Instruments Co., Ltd. (Shanghai, China). The microreactor setup equipped with optical flow-through cells for the continuous-flow reaction was built based on the modular micro-reactor system (MMRS) from Ehrfeld Mikrotechnik GmbH. The temperature of the reactor was regulated by a constant temperature heating oil bath (Shanghai Yukang Science and Education Equipment Co., Ltd., China) manipulating the temperature of the circulating oil. A digital mechanical stirrer made by IKA-Werke GmbH & Co. KG (Staufen, Germany) was used. Real-time Raman or NIR spectra were collected during the reaction by a combined spectrometer (ProcessEye-Raman 785 and NIR 2.2) manufactured by Shanghai PROXS Chemical Technology Co., Ltd. (China), equipped with an NIR transmission probe (path length 5 mm) and a Raman immersion probe.
Figure 2.
(A) Combined real-time analysis system with both NIR and Raman. (B) Batch process for the synthesis of 3. (C) Batch processes for the synthesis of 5 and 1. (D) Continuous-flow process of the one-pot synthesis of 1 using real-time NIR analysis.
In-Line Analytical Measurements
Real-time Raman spectra were acquired between 300 and 3100 cm–1, and the integration time was 0.1–6 s depending on the signal strength of the sample during the reaction. NIR (1000–2150 nm) spectra were measured with an integration time of 0.1–3 s depending on the signal strength of the sample during the reaction. A computer program (ProcessEye-MultiSpec) was used to trigger the Raman and NIR measurements, and the Horizon MB evaluation software and PLS algorithm were used to build the chemometric models.
Offline HPLC measurements provided reference data for the validation of the real-time Raman and NIR analysis. Samples of 200 μL in volume were taken from the reactor at different intervals (3, 6, or 15 min) depending on the reaction rate. Acetonitrile (800 μL) was used to dilute the samples for the offline HPLC measurements.
The continuous-flow process of the one-pot synthesis of 1 using the real-time NIR analysis is as follows.
Input solutions were prepared as follows:
0.5 M of compound 3: In a 250 mL flask, compound 3 (34.3 g, 100 mmol) was dissolved and filled up to 200 mL with DMSO.
1.5 M + 17% benzyl alcohol (10.8 g, 11.5 mL, density: 1.096 g mL–1): In a 100 mL flask, EDCl (21.0 g, 110 mmol), benzyl alcohol (10.8 g, 11.5 mL, density: 1.096 g mL–1), and DMAP (1.2 g, 10 mmol) were dissolved and filled up to 67.0 mL with DMSO.
0.4 M HCl isopropanol solution was purchased from Adamas (Shanghai, China).
The compound 3 feed, EDCl feed, and HCl isopropanol solution feed were delivered with three injection pumps (Hitec Zang, IP-SYR-CKP-P-CER-3, with 1.0 mL syringes). The compound 3 feed was pumped with a flow rate of 1.00 mL min–1, and the EDCl feed was pumped with a flow rate of 0.350 mL min–1. Both streams were mixed in a microreactor system (Ehrfeld, MMRS, Flowplate Lab with LL-Mixer, nominal width: 0.2 mm), which was placed in a thermostat (Huber, Ministat 240)-controlled jacket vessel at 0 °C. The HCl isopropanol solution feed was delivered with a flow rate of 0.340 mL min–1 and mixed in another Flowplate Lab microreactor (Ehrfeld, Flowplate Lab with LL-Mixer, nominal width: 0.2 mm) with the outlet stream of the previous reaction step, which was placed in a thermostat (Huber, Ministat 240)-controlled jacket vessel at 65 °C. The reaction was analyzed by real-time NIR (Tec5, Multispec-2) and HPLC (Thermofisher, U3000).
Isolated: 25.05 g (75% yield, Purity by HPLC: >99%)
Results and Discussion
Real-Time Raman Analysis of 3
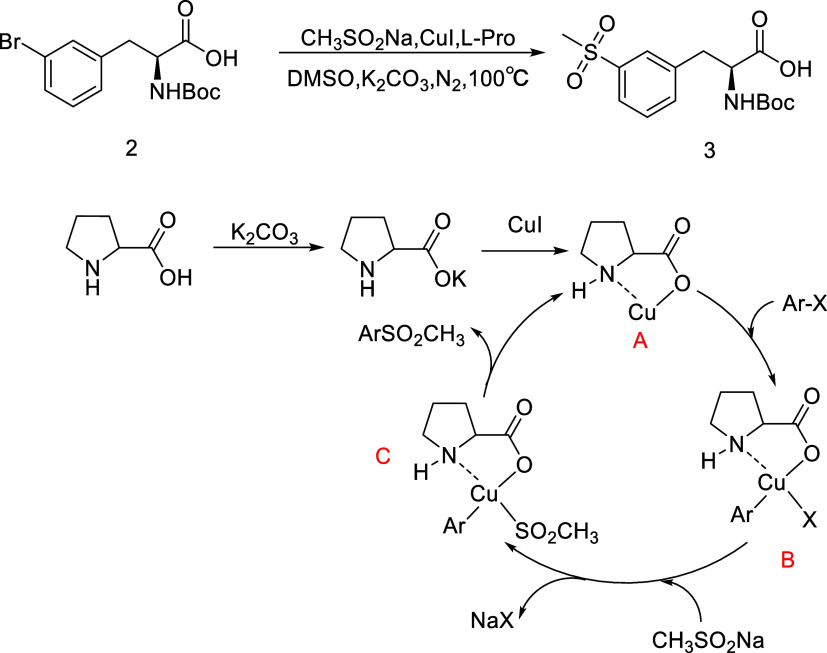
The coupling reaction catalyzed by CuI/l-proline of 2 with sodium methanesulfinate (see Scheme 2) was a heterogeneous reaction.21 Furthermore, the bromo group was substituted with the methyl sulfonyl group in this reaction; the sulfur–oxygen double bond of the methyl sulfonyl group has an excellent Raman signal at 600–750 cm–1.22 Thus, Raman spectroscopy was selected as the real-time analysis tool.
Scheme 2. Reaction Conditions and Mechanisms during the Synthesis of 3.
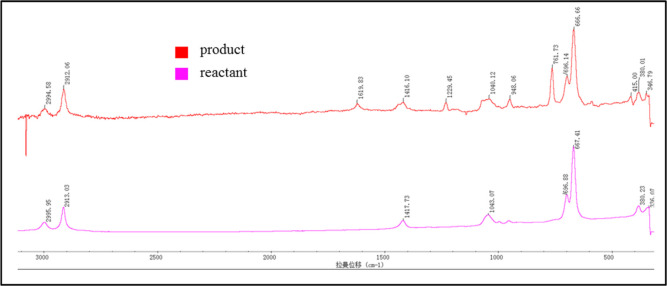
Before the experiments were performed, the characteristic Raman peaks of each compound were identified using product and reactant solutions at a 100 g L–1 concentration (see Figure 3). Identification of individual peaks of the reactant and product was necessary to distinguish them in the reaction solution.
Figure 3.
Reference Raman spectra of the product and reactant (100 g L–1) indicating the characteristic peaks of each compound.
The reaction was carried out as described in Experiment 1. In the beginning of the reaction, there was no visible characteristic band at 761.73 cm–1. After dosing started, the characteristic bands of product 3 showed up rapidly at 761.73 cm–1 (see Figure 4). Furthermore, the sulfur–oxygen double bond of the methyl sulfonyl group has an excellent Raman signal at 600–750 cm–1.22 Therefore, the real-time Raman analysis calibration model was built using the wavenumber range of 722–785 cm–1.
Figure 4.
Inline Raman spectra shown were collected in Experiment 1.
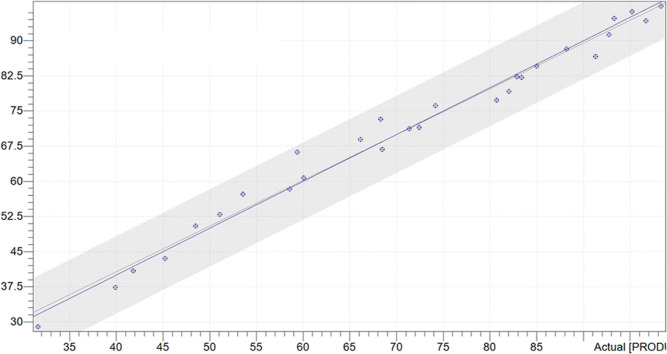
During the reaction, different concentrations of product 3 and reactant 2 were measured using online Raman and offline HPLC analyses, respectively. In Figure 5, 28 spectra were collected at different intervals (3, 6, or 15 min) depending on the reaction rate to build up the model; when evaluating the result of the model, the predictive residual error sum of squares (PRESS) value and root-mean-square error of calibration (RMSEC) were used to determine the number of latent variables. As shown in Figures S14 and S15, both the PRESS value and RMSEC were the lowest when the number of latent variables was 3, which indicates that setting the number of latent variables to 3 could achieve more accurate process monitoring. After preprocessing of Raman spectrometry by two-points baseline correction (range between 480 and 2760 cm–1), the calibration model between the real-time Raman spectrometry and offline HPLC was constructed by the PLS chemometric model. The obtained coefficient of determination (R2) was 0.9821, as shown in Figure 5, which demonstrated that the real-time analysis system provided an excellent quantitative correlation between the actual concentration and the model-predicted concentration.
Figure 5.
Quantitative relation between the actual concentration and the model-predicted concentration in the real-time Raman analysis of 3.
In order to further validate the accuracy of real-time Raman spectra, the predicted concentration was calculated by the calibration model. As the results show (Figure 6), the concentrations of product 3 and reactant 2 determined by real-time Raman spectrometry and offline HPLC correspond to each other.
Figure 6.
Monitoring of the product and reactant with real-time Raman spectrometry and using a PLS chemometric model. Concentrations of the product and reactant calculated from the Raman spectra and measured with offline HPLC are shown.
Real-Time NIR Analysis of 5
Because reactant 3 has a strong fluorescent effect, NIR showed better spectral quality than Raman for online calibration. In addition, NIR could distinguish well between the ester group and the hydroxyl group. Under normal operating conditions for step 3 to 5 reactions, reaction mixtures were collected. For the model in Figure 7, 56 spectra were collected to build the calibration model; the number of latent variables could also be determined by the relationship between the number of variables and PRESS/RMSEC, as shown in Figures S16 and S17; the number of latent variables was selected as 6, which related to the smallest PRESS and RMSEC. The NIR spectra were preprocessed by first-order derivative to eliminate the baseline offset and scattering effects. Then, the real-time NIR analysis model was built with the PLS chemometric model and had an R2 of 0.9993, as shown in Figure 7.
Figure 7.
Quantitative relation between the actual concentration and the model-predicted concentration in the real-time NIR analysis of 5.
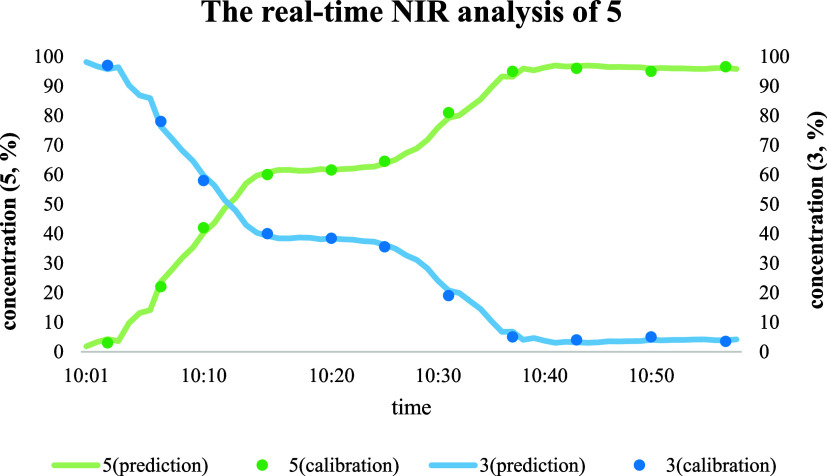
The calibration model proved to be very well applicable for a monitoring experiment (see Figure 8). During the reaction, the reaction temperature was kept at 0–5 °C, and when the temperature got too high, the feed was stopped, so there is a plateau in the curve of concentration of 5 for intermediate times. The concentrations of product 5 and reactant 3 calculated from real-time NIR and measured with offline HPLC overlapped.
Figure 8.
Monitoring of the concentration is based on real-time NIR analysis using the PLS chemometric model. The concentrations of product 5 and reactant 3 calculated from real-time NIR and measured with offline HPLC are shown.
Real-Time NIR Analysis of 1
In Figure 9, the number of latent variables of the model was selected as 5. The resulting model gives both excellent accuracy and precision, and the reliability of this calibration (R2) is 0.9920, which is shown by the PLS calibration model in Figure 9. These values clearly indicate the reliability of the PLS model for the calibration of NIR data sets representing different component concentrations based on the response of NIR spectroscopy.
Figure 9.
Demonstration of a calibration set and a prediction set of the PLS model during the real-time NIR analysis of 1.
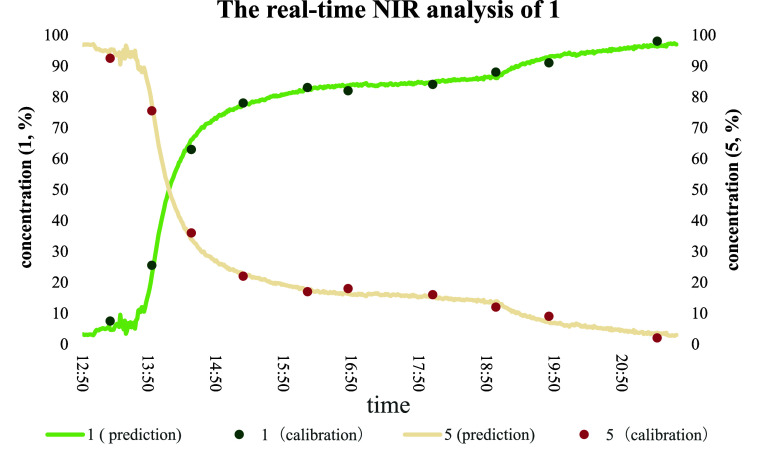
The potential of NIR spectroscopy to predict the concentration of samples was investigated by using a PLS calibration model of NIR data collected from various concentrations of the product and reactant (see Figure 10). According to our research, the conversion was related to the type of solvent. A higher conversion was obtained when a proton solvent was present in the reaction system. During the reaction, it was found that the conversion stopped at around 80% and did not increase, and a small amount of proton solvent was added to the reaction system to promote the reaction. Therefore, the reaction seems to stop around 80% between 15:50 and 18:50 and then increase the conversion further after 18:50 to the end. This built PLS calibration model showed 99% accuracy, sensitivity, and specificity in unknown samples’ concentration prediction as compared with that of standard samples (measured by HPLC).
Figure 10.
Concentrations of product 1 and reactant 5 calculated from the NIR spectra and measured with offline HPLC are shown.
Inline NIR Analysis of the Continuous-Flow Process in a Microreactor
Based on the previous experimental results, the traditional batch production process for step 1 was highly exothermic, which will pose serious safety risks because of the low boiling point of the solvent DCM, as shown in Figure 11A. In addition, high temperatures could lead to the formation of urea as a byproduct. In step 2, deprotection could result in CO2 and isobutene gas generation, and highly corrosive HCl would be used. Under these circumstances, interest in the continuous-flow process was primarily fueled by its unique advantages including its excellent heat and mass transfer efficiency, precise process control, safe and reliable production equipment, and so on.23−25 Therefore, the continuous-flow process for producing 1 was conducted, and the real-time measuring method was used to investigate and optimize the process in flow. These 2 steps were the EDCI-catalyzed condensation reaction followed by the deprotection reaction. Reactions were performed in a microreactor system (see Figure 2). An extensive optimization of residence time was performed with conversions of 62–97% for the flow technology (Figure 11B,C). During these experiments, the best results could be obtained with a residence time of 0.260 min for step 1 and 0.283 min for step 2. The continuous flow technique had significant advantages since it required only 0.543 min of residence time, while the batch protocol usually took at least 4 h. Inline NIR showed its special benefits as a PAT tool and is even essential for the real-time monitoring of the very fast reaction process because of its very fast measuring speed (less than 1 s per spectrum) to ensure the stable operation of the continuous-flow process. Experiment results collected with inline NIR and offline HPLC were compared, and the experiment results were close to each other. The two built calibration models were validated in a continuous flow process.
Figure 11.
(A) Synthesis route was from 3 to 1. (B) Step 1: investigation of residence time in the microreactor by inline NIR and offline HPLC. (C) Step 2: investigation of residence time in the microreactor by inline NIR and offline HPLC.
Conclusions
In multistep synthesis, real-time analysis of the complex reaction mixtures is a significant challenge but provides an opportunity to enhance reaction understanding and control. In this study, a combined multichannel spectrometer system with both NIR and Raman was built, and calibration models were developed by using the PLS chemometric model to quantify the desired products, intermediates, and impurities in real time at multiple points along the synthetic pathway. The calibration model by Raman spectra showed results of 0.982 of R2 and 2.58% of RMSECV for product 3. In real-time NIR analysis, the results of the calibration model were 0.999 of R2 and 0.29% of RMSECV for product 5 and 0.992 of R2 and 3.79% of RMSECV for final product 1. The evaluation of spectra using the calibration model provided real-time information about the component concentrations during the monitoring experiments. The concentrations of the product and reactant calculated from the real-time spectra followed the values from the offline measurements, and there was no separation between the offline and real-time concentrations.
In this work, two calibration models were built by real-time NIR analysis, which was then validated in a continuous flow process. The continuous-flow synthesis process of 3-(methylsulfonyl)-l-phenylalanine phenylmethyl ester 1 in a microreactor was realized according to the heat-release characteristics of the reaction. No urea byproducts were detected in the reaction. The effects of the residence time on the yield were investigated. When the first stage residence time is 0.260 min and the second stage residence time is 0.283 min, the yield could reach 97%. The continuous flow technique had significant advantages since it required only 0.543 min of residence time, while the batch protocol usually took at least 4 h.
Acknowledgments
This work was financially supported by the National Key Research and Development Program of China (2021YFC2102100) and the Shanghai Sailing Program (23YF1445800). The authors are grateful to the China State Institute of Pharmaceutical Industry and Shanghai PROXS Chemical Technology Co., Ltd. for financial support.
Supporting Information Available
The Supporting Information is available free of charge at https://pubs.acs.org/doi/10.1021/acsomega.4c00565.
HPLC spectra for 2 and 1·HCl; NMR spectra for 2 and 1·HCl; HRMS spectra for 2 and 1·HCl; and SCXRD data for 2·Cy2NH (PDF)
Author Contributions
C.W. and Q.L. contributed equally to this manuscript and were cofirst authors. Meanwhile, this work was completed under the supervision of Q.L.; therefore, Q.L. was also the corresponding author of this manuscript. All authors commented on and revised the manuscript.
The authors declare no competing financial interest.
Supplementary Material
References
- U.S. Food and Drug Administration . Guidance for Industry: PAT-A Framework for Innovative Pharmaceutical Development, Manufacturing, and Quality Assurance; U.S. Food and Drug Administration: Rockville, MD, 2004.
- Calhan S. D.; Eker E. D.; Sahin N. O. Quality by design (QbD) and process analytical technology (PAT) Application sin pharmaceutical industry. Eur. J. Chem. 2017, 8, 430–433. 10.5155/eurjchem.8.4.430-433.1667. [DOI] [Google Scholar]
- Simon L. L.; Pataki H.; Marosi G. Y.; Meemken F.; Hungerbuhler K.; Baiker A.; Tummala S.; Glennon B.; Kuentz M.; Steele G.; Kramer H. J. M.; et al. Assessment of Recent Process Analytical Technology (PAT) Trends: A Multiauthor Review. Org. Process Res. Dev. 2015, 19, 3–62. 10.1021/op500261y. [DOI] [Google Scholar]
- Chanda A.; Daly A. M.; Foley D. A.; LaPack M. A.; Mukherjee S.; Orr J. D.; Reid G. L.; Thompson D. R.; Ward H. W. Industry Perspectives on Process Analytical Technology: Tools and Applications in API Development. Org. Process Res. Dev. 2015, 19, 63–83. 10.1021/op400358b. [DOI] [Google Scholar]
- Bordawekar S.; Chanda A.; Daly A. M.; Garrett A. W.; Higgins J. P.; LaPack M. A.; Maloney T. D.; Morgado J.; Mukherjee S.; Orr J. D.; Reid G. L.; Yang B. S.; Ward H. W. Industry Perspectives on Process Analytical Technology: Tools and Applications in API Manufacturing. Org. Process Res. Dev. 2015, 19, 1174–1185. 10.1021/acs.oprd.5b00088. [DOI] [Google Scholar]
- Sallay P.; Szilagyi N.; Csontos I.; Keglevich G. A study on the equilibrium reaction of benzaldehyde and sodium bisulphite by in situ Fourier transform IR spectroscopy. Period. Polytech., Chem. Eng. 2009, 53, 9–12. 10.3311/pp.ch.2009-1.02. [DOI] [Google Scholar]
- Keglevich G.; Puskas R. E.; Grun A.; Csontos I. Monitoring the Phosphorylation of Phenol with Diethyl Chlorophosphate in Aqueous Medium in the Presence of Sodium Hydroxide by in Situ Fourier Transform Infrared Spectroscopy. Phosphorus, Sulfur Silicon Relat. Elem. 2010, 185, 832–837. 10.1080/10426500903002537. [DOI] [Google Scholar]
- Keglevich G.; Fehervari A.; Csontos I. A study on the Kabachnik-Fields reaction of benzaldehyde, propylamine, and diethyl phosphite by in situ Fourier transform IR spectroscopy. Heteroat. Chem. 2011, 22, 599–604. 10.1002/hc.20676. [DOI] [Google Scholar]
- Joiner D.; Billeter J.; McNally M. E. P.; Hoffman R.; Gemperline P.. Kinetic modeling of the reaction and crystallization of acetylsalicylic acid using ATR UV-vis spectroscopy. Research and Creative Achievement Week (RCAW); East Carolina College: Greenville, NC, 2011.
- Thurston T. J.; Brereton R. G.; Foord D. J.; Escott R. E. Principal Components plots for exploratory investigation of reactions using ultraviolet-visible spectroscopy: application to the formation of benzophenone phenylhydrazone. Talanta 2004, 63, 757–769. 10.1016/j.talanta.2003.12.027. [DOI] [PubMed] [Google Scholar]
- Fevotte G. In Situ Raman Spectroscopy for In-Line Control of Pharmaceutical Crystallization and Solids Elaboration Processes: A Review. Chem. Eng. Res. Des. 2007, 85, 906–920. 10.1205/cherd06229. [DOI] [Google Scholar]
- Pataki H.; Markovits I.; Vajna B.; Nagy Z. K.; Marosi G. In-Line Monitoring of Carvedilol Crystallization Using Raman Spectroscopy. Cryst. Growth Des. 2012, 12, 5621–5628. 10.1021/cg301135z. [DOI] [Google Scholar]
- Simone E.; Saleemi A.; Nagy Z. K. Application of quantitative Raman spectroscopy for the monitoring of polymorphic transformation in crystallization processes using a good calibration practice procedure. Chem. Eng. Res. Des. 2014, 92, 594–611. 10.1016/j.cherd.2013.11.004. [DOI] [Google Scholar]
- Zhang F. K.; Liu T.; Wang X. Z.; Liu J. X.; Jiang X. B. Comparative study on ATR-FTIR calibration models for monitoring solution concentration in cooling crystallization. J. Cryst. Growth 2017, 459, 50–55. 10.1016/j.jcrysgro.2016.11.064. [DOI] [Google Scholar]
- Su W. Y.; Hao H. X.; Glennon B.; Barrett M. Spontaneous Polymorphic Nucleation of d-Mannitol in Aqueous Solution Monitored with Raman Spectroscopy and FBRM. Cryst. Growth Des. 2013, 13, 5179–5187. 10.1021/cg400304c. [DOI] [Google Scholar]
- Csontos I.; Pataki H.; Farkas A.; Bata H.; Vajna B.; Nagy Z. K.; Keglevich G.; Marosi G. Feedback Control of Oximation Reaction by Inline Raman Spectroscopy. Org. Process Res. Dev. 2015, 19, 189–195. 10.1021/op500015d. [DOI] [Google Scholar]
- Van Eerdenbrugh B.; Taylor L. S. Application of Mid-IR Spectroscopy for the Characterization of Pharmaceutical Systems. Int. J. Pharm. 2011, 417, 3–16. 10.1016/j.ijpharm.2010.12.011. [DOI] [PubMed] [Google Scholar]
- Haber S. L.; Benson V.; Buckway C. J.; Gonzales J. M.; Romanet D.; Scholes B. Lifitegrast: A novel drug for patients with dry eye disease. Ophthalmol. Eye Dis. 2019, 11, 251584141987036. 10.1177/2515841419870366. [DOI] [PMC free article] [PubMed] [Google Scholar]
- Zhong M.; Gadek T. R.; Bui M.; Shen W.; Burnier J.; Barr K. J.; Hanan E. J.; Oslob J. D.; Yu C. H.; Zhu J.; et al. Discovery and Development of Potent LFA-1/ICAM-1 Antagonist SAR 1118 as an Ophthalmic Solution for Treating Dry Eye. ACS Med. Chem. Lett. 2012, 3, 203–206. 10.1021/ml2002482. [DOI] [PMC free article] [PubMed] [Google Scholar]
- Zheng B. F.; Li S. L.; Gao Q.; Ma Z. B.; Liu G.; Yang C. W.; Mei K.; Sun J. J.; Huang Y. B.. A method for the preparation of lifitegrast intermediate. CN 111471003 A, 2020.
- Zhu W.; Ma D. Synthesis of Aryl Sulfones via L-Proline-Promoted CuI-Catalyzed Coupling Reaction of Aryl Halides with Sulfinic Acid Salts. J. Org. Chem. 2005, 70, 2696–2700. 10.1021/jo047758b. [DOI] [PubMed] [Google Scholar]
- Gillespie R. J.; Robinson E. A. The Raman spectra of sulphuric, deuterosulphuric, fluorosulphuric, chlorosulphuric, and methanesulphonic acids and their anions. Can. J. Chem. 1962, 40, 644–657. 10.1139/v62-100. [DOI] [Google Scholar]
- Yao X.; Zhang Y.; Du L.; Liu J.; Yao J. Review of the applications of microreactors. Renewable Sustainable Energy Rev. 2015, 47, 519–539. 10.1016/j.rser.2015.03.078. [DOI] [Google Scholar]
- Yue J. Green process intensification using microreactor technology for the synthesis of biobased chemicals and fuels. Chem. Eng. Process. 2022, 177 (109002), 109002. 10.1016/j.cep.2022.109002. [DOI] [Google Scholar]
- Elvira K. S.; i Solvas X. C.; Wootton R. C. R.; deMello A. J. The past, present and potential for microfluidic reactor technology in chemical synthesis. Nat. Chem. 2013, 5, 905–915. 10.1038/nchem.1753. [DOI] [PubMed] [Google Scholar]
Associated Data
This section collects any data citations, data availability statements, or supplementary materials included in this article.


