Abstract
Aldose reductase plays a central role in diabetes mellitus (DM) associated complications by converting glucose to sorbitol, resulting in a harmful increase of reactive oxygen species (ROS) in various tissues, such as the heart, vasculature, neurons, eyes, and kidneys. We employed a comprehensive approach, integrating both ligand- and structure-based virtual screening followed by experimental validation. Initially, candidate compounds were extracted from extensive drug and chemical libraries using the DeepChem’s GraphConvMol algorithm, leveraging its capacity for robust molecular feature representation. Subsequent refinement employed molecular docking and molecular dynamics (MD) simulations, which are crucial for understanding compound–receptor interactions and dynamic behavior in a simulated physiological environment. Finally, the candidate compounds were subjected to experimental validation of their biological activity using an aldose reductase inhibitor screening kit. The comprehensive approach led to the identification of a promising compound, demonstrating significant potential as an aldose reductase inhibitor. This comprehensive approach not only yields a potential therapeutic intervention for DM-related complications but also establishes an integrated protocol for drug development, setting a new benchmark in the field.
Introduction
Diabetes mellitus (DM) is an intricate metabolic condition distinguished by persistent high blood sugar levels. Aldose reductase, a key enzyme in the polyol pathway, plays a pivotal role in the pathophysiology of diabetic complications.1,2 In the normal physiological state, aldose reductase plays a minimal role in glucose metabolism. However, under hyperglycemic conditions, as seen in diabetes mellitus (DM), its activity becomes significantly more pronounced. Hyperglycemia leads to an increased level of influx of glucose into cells. Aldose reductase catalyzes the reduction of excess glucose to sorbitol utilizing nicotinamide adenine dinucleotide phosphate (NADPH) as a coenzyme,3,4 a key step in the polyol pathway. The accumulation of sorbitol, which is impermeable to cell membranes, leads to osmotic stress and cellular swelling.5,6 In this pathway, consumption of NADPH has significant implications. NADPH is vital for regenerating reduced glutathione, a primary cellular antioxidant that is crucial for neutralizing reactive oxygen species (ROS). Additionally, it serves as a substrate for NADPH oxidase (NOX) enzymes that generate ROS.7−10 The dual role of NADPH, essential for both ROS neutralization and production, adds a layer of complexity to the cellular redox balance. Consequently, NADPH depletion can limit NOX-mediated ROS production while simultaneously impairing the cell’s antioxidant defenses, potentially exacerbating overall oxidative stress.11 These biochemical changes have profound implications in various tissues. In the lens of the eye, for instance, sorbitol accumulation causes osmotic stress, contributing to cataract formation.12−14 In peripheral nerves, the reduced nerve conduction velocity and nerve blood flow, associated with oxidative stress and osmotic imbalance, lead to diabetic neuropathy.15−17 Similar mechanisms are implicated in diabetic cardiomyopathy, nephropathy, and retinopathy. Given the centrality of aldose reductase in mediating these harmful effects, it is a prime target for therapeutic intervention. Inhibitors of aldose reductase have the potential to mitigate the damaging impact of hyperglycemia on tissues, thereby reducing the risk or severity of diabetic complications.18,19 This underscores the importance of research aimed at identifying and developing effective aldose reductase inhibitors, as they hold promise for improving the quality of life for individuals suffering from DM and its complications.
Computer-aided drug design (CADD) has revolutionized drug discovery, providing a more efficient alternative to traditional methods. By utilizing advanced computational techniques, CADD rapidly screens compound libraries, reducing the need for labor-intensive laboratory testing.20 This expedites drug candidate identification, streamlining synthesis, and evaluation. Integration of artificial intelligence, particularly deep learning (DL), further transforms drug development. DL models process large data sets, offering insights into genetic and clinical data, facilitating new drug target discovery, enhancing efficacy predictions, and optimizing drug properties.21,22 DL’s efficiency in data analysis marks a significant advancement, accelerating drug development for a new era of precision in drug discovery.22,23 Furthermore, molecular docking and molecular dynamics (MD) simulations are essential in modern drug discovery, providing key insights into drug–target interactions. Docking predicts the binding affinity and orientation of small molecules within the target protein, simulating their pose and estimating binding affinity through computational algorithms.24,25 In tandem, MD simulations offer a dynamic perspective, showcasing a drug’s behavior within the binding site over time. These simulations track atomic and molecular movements, allowing researchers to observe complex stability, identify potential binding events, and understand conformational changes.26,27 Collectively, molecular docking and MD simulations offer a comprehensive understanding of drug–target interactions, guiding optimization for increased efficacy and reduced toxicity,26,28 thus enhancing the efficiency of drug discovery.
In this study, we employed a graph neural network algorithm for training, utilizing active and decoy aldose reductase inhibitor data sets. Subsequently, we screened both the FDA-approved drug library and the commercial Enamine library to identify potential aldose reductase inhibitor candidates. These candidates underwent analysis via molecular docking and MD simulations. Finally, the biological activity was confirmed using an aldose reductase inhibitor kit to predict novel aldose reductase inhibitors.
Results and Discussion
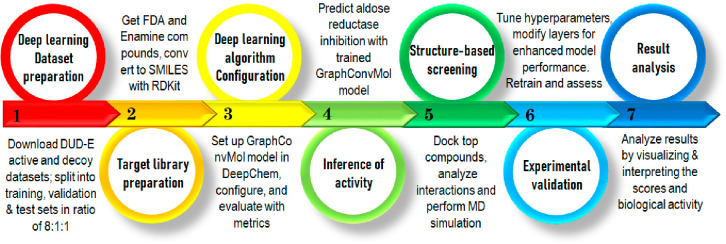
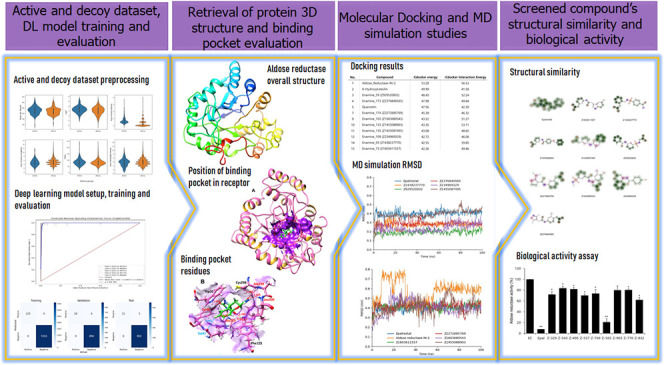
The process of combining ligand-based virtual screening with a deep learning algorithm and structure-based virtual screening utilizing molecular docking and MD simulations for the discovery of novel aldose reductase inhibitors is illustrated in Figure 1. The current study involved seven steps, starting with the download of data sets from the DUD-E database, followed by the preparation of data sets for the deep learning model (1), target data set preparation for deep learning model (2), GraphConvMol algorithm configuration (3), prediction of aldose reductase inhibitory activity with the trained GraphConvMol model (4), structure-based virtual screening of candidates with molecular docking and MD simulations (5), and experimental validation of candidates in an enzyme activity assay (6). Ultimately, a result analysis (7) was conducted to assess the potential of compounds as novel aldose reductase inhibitors.
Figure 1.
Workflow integrates deep learning, molecular docking, MD simulations, and experimental evaluation in the quest for novel aldose reductase inhibitors.
Aldose Reductase Active and Decoy Data Sets and Its Preprocessing Using RDKit
DUD-E (Database of Useful Decoys: Enhanced) provides benchmark sets of protein–ligand complexes, featuring experimentally verified active compounds alongside decoys that lack binding affinity against various diseases. These decoys exhibit comparable physicochemical characteristics to the active compounds, yet they diverge in their two-dimensional topology.29 The DUD-E database is extensively utilized for developing and benchmarking computational docking methods.30,31
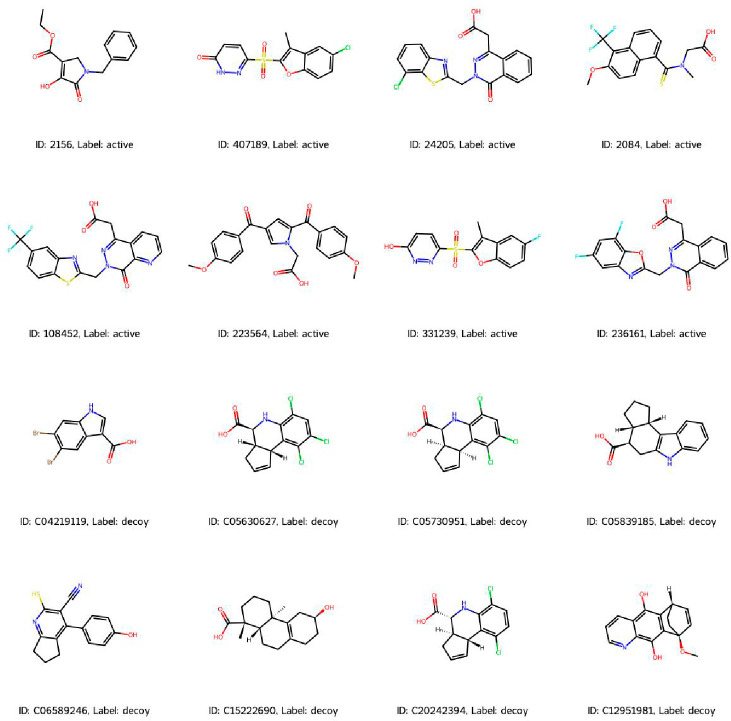
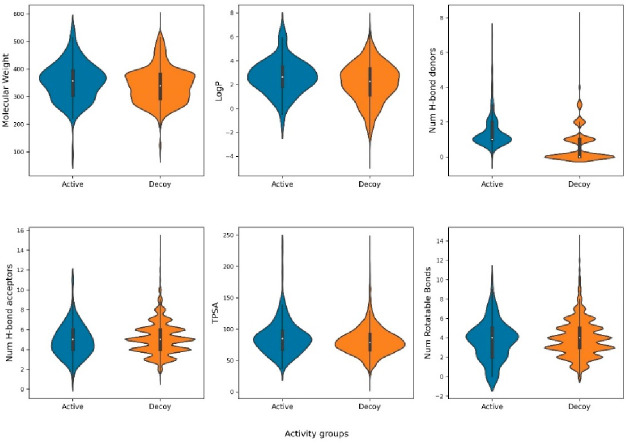
The aldose reductase data set in the DUD-E repository (https://dude.docking.org/targets/ALDR) consist of 444 experimentally validated active compounds. Figure 2 illustrates representative structures of active and decoy compounds with labels identifying their respective classifications. Molecular features, including molecular weight, LogP, Hbond donors, Hbond acceptors, TPSA, and rotatable bonds, were computed using RDKit, a freely available software toolkit for cheminformatics, to facilitate comparison of the physicochemical properties between active and decoy compounds. No significant variance was observed in the distribution of molecular descriptor values between active and decoy compounds (Figure 3).
Figure 2.
Illustrative depiction of active and decoy compounds.
Figure 3.
Distribution of molecular descriptors in active and decoy compounds.
Deep-Learning Model Setup, Training, and Evaluation
DeepChem is a Python library that is freely available and open-source and designed for the application of deep learning in drug discovery and cheminformatics. This versatile library offers an extensive range of tools specifically constructed for the handling of molecular data. DeepChem excels in employing diverse deep learning algorithms to tackle various tasks within the realm of drug discovery, including but not limited to predicting molecular properties, conducting ligand-based virtual screening, and optimizing chemical compounds.32,33
In this study, the GraphConvMol model within the DeepChem library played a crucial role in discerning key distinctions between active and decoy compounds in the aldose reductase data set. The GraphConvMol method offers a means to comprehensively learn molecular representations, establishing itself as a potent tool for cheminformatics applications like predicting molecular properties and facilitating drug discovery.34,35 Therefore, the aldose reductase data set was divided into training, validation, and test sets using an 8:1:1 ratio. The GraphConvMol model was then applied using 5-fold cross-validation.
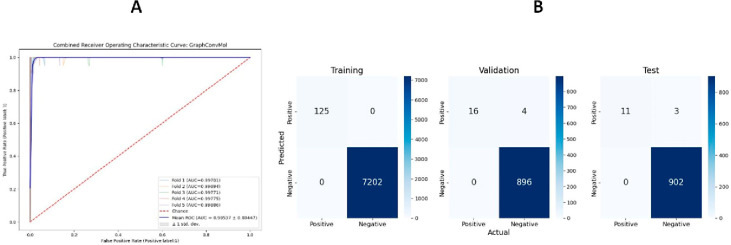
To evaluate the model’s efficacy, various metrics such as the Area Under the Curve (AUC) of the Receiver Operating Characteristic (ROC) curve were calculated for the training, validation, and test data sets. The ROC curve, derived from a 5-fold cross-validation on the training data set, demonstrated a True Positive Rate (TPR) of 1 at an impressively low False Positive Rate (FPR) with an AUC value of 0.995 (Figure 4). These results indicate that the GraphConvMol model displays excellent sensitivity in detecting positive instances, while maintaining a low rate of false positives.
Figure 4.
AUC-ROC curve of 5-fold cross validation of the training data set (A) and the confusion matrix entries for the training, validation, and test data sets (B).
To assess the performance of GraphConvMol on DUD-E data sets, various metrics including precision, recall, F1 score, sensitivity, accuracy, and specificity were calculated for the training, validation, and test data sets (Table 1). The training data set demonstrated optimal performance in all evaluated metrics. In the validation data set, 4 instances out of 900 negatives were incorrectly classified as positives, impacting the precision of the model. Similarly, in the test data set, 3 instances out of 905 negatives were misclassified, reflecting a slight reduction in precision. The recall values of 0.8 and 0.79 for the validation and test data sets, respectively, suggest the model’s effectiveness in identifying true positives. The F1 scores, as detailed in Table 1, corroborate the model’s reliable performance across all data sets.
Table 1. Performance Metrics of GraphConvMol Modela.
| precision | recall | F1 score | accuracy | specificity | |
|---|---|---|---|---|---|
| training | 1.00 | 1.00 | 1.00 | 1.00 | 1.00 |
| validation | 1.00 | 0.80 | 0.89 | 0.99 | 1.00 |
| test | 1.00 | 0.79 | 0.88 | 0.99 | 1.00 |
Precision = true positives/(true positives + false positives); recall = true positives/(true positives + false negatives); F1 score = 2((precision × recall)/(precision + recall)); accuracy = (true positives + true negatives)/total population; specificity = true negatives/(true negatives + false positives).
Given the imbalance in the current data set, with a significantly larger quantity of decoys compared to active molecules, the Matthews correlation coefficient (MCC) was employed to evaluate the GraphConvMol model’s efficacy, given its suitability for unbalanced data sets. The averages of MCC values obtained from 5-fold cross-validations were 1.00 for the training set and 0.89 for the validation set. An MCC of 1 signifies perfect prediction accuracy; thus, the values of 1.0 and 0.89 underscore the robustness and reliability of the model. It is generally acceptable if the MCC value is higher in the test set compared to the validation set. This occurs because the model is trained using the training set and subsequently assessed on new and unseen data, forming the validation data set. Moreover, the fluctuation of the MCC value observed during the 5-fold cross-validations indicates that the model is not overfitting over the training.
Prediction of Aldose Reductase Inhibitory Potential from FDA-Approved Drug and Enamine Compound Libraries
The use of FDA-approved drugs for the discovery of novel aldose reductase inhibitors has several benefits. Given that FDA-approved drugs have undergone thorough preclinical and clinical testing to establish their safety, dosing, and pharmacokinetics, repurposing these drugs can result in expedited timelines, reduced development expenses, and increased probability of success. Besides FDA-approved drugs, commercial small molecule libraries could be valuable sources for the screening of aldose reductase inhibitors. In the present study, a small molecule library, composed of 460160 compounds, from Enamine Ltd. was employed. The SMILES strings of FDA-approved drugs and Enamine compounds underwent analysis using the trained model employing the GraphConvMol algorithm from DeepChem. This analysis aimed to predict the potential for the aldose reductase inhibitory activity. The predictions provided by the trained model ranged from 0 (indicating no activity) to 1 (indicating high activity) for the compounds. Most of the compounds were predicted to be inactive, with only a small proportion predicted as active. Out of a total of 3105 FDA-approved drugs, 13 compounds were predicted to be active with prediction values exceeding 0.95. Similarly, out of 460160 Enamine compounds, 169 compounds were predicted to be active with the prediction values exceeding 0.95. To conduct structure-based virtual screening in the next step, we selected the top 30 FDA-approved drugs and 200 Enamine compounds that were highly predicted by the GraphConvMol model. Besides FDA-approved and Enamine compounds, 50 known aldose reductase inhibitors from MedChemExpress LLC (https://www.medchemexpress.com/Targets/Aldose%20Reductase/) were also included for structure-based virtual screening. These selected compounds were used as inputs for molecular docking and MD simulations.
Structural Analysis of the Aldose Reductase Protein
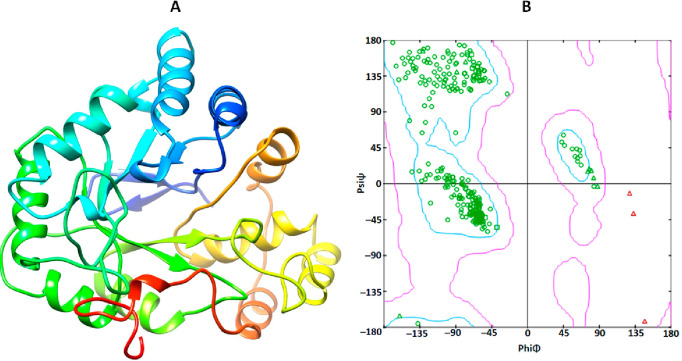
Aldose reductase, part of the prostaglandin G/H synthase family, is also recognized under various aliases such as prostaglandin G/H synthase 2 (PGH2) and prostaglandin-endoperoxide synthase 2 (PTGS2).36 It consists of 316 amino acids forming a single chain. The α-helices, β-sheets, and coils occur in the overall protein structure (Figure 5). Therefore, VADAR 1.8 statical values revealed that aldose reductase consists of 35% α-helices, 24% β-sheets, 40% coils, and 27% turns. As per Ramachandran plot analysis, 98% of all residues were in favored regions and 99.8% of all residues were in the allowed region, while there was one outlier (Glu84) of dihedral angles phi (φ) and psi (ψ).
Figure 5.
3D structure (A) of the aldose reductase protein and the computed Ramachandran plot (B) calculated by Discovery Studio.
Binding Pocket Analysis
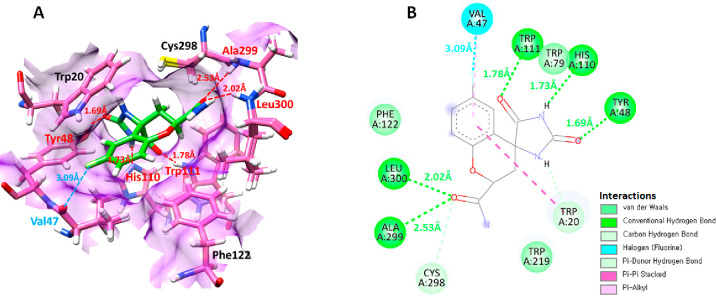
The functionality of a binding pocket is dictated by both its shape and location within a protein as well as the assembly of amino acid residues that encompass it.37 The binding pocket residues of aldose reductase were obtained using Discovery Studio’s ligand interaction approach and mentioned as Val47, Trp111, Trp79, His110, Tyr48, Trp20, Trp219, Cys298, Ala299, Leu300, and Phe122. Furthermore, the active pocket residues were confirmed from already published data.38 Therefore, the binding sphere values were adjusted as X = 16.7143, Y = −7.1528, and Z = 16.5962, and the radius value was fixed as 6.1040 concerning the binding pocket residues to study the interaction of screened compounds in the active region of aldose reductase (Figure 6).
Figure 6.
(A) manifests the 3D interaction of the bound ligand (green) with the target protein (aldose reductase). Additionally, the 2D interactions between the ligand (fidarestat) and aldose reductase are depicted using different colors based on the interaction type (B).
Molecular Docking Analysis
The CDocker module within Discovery Studio was employed to forecast negative energy values, comprising the CDocker energy and the CDocker interaction energy. CDocker energy encompasses the holistic docking energy stemming from the 3D structural and physicochemical attributes of the ligand and protein. Conversely, the CDocker interaction energy specifically denotes the energy linked with interactions between the ligand and the receptor. This includes contributions from various intermolecular forces, for instance, hydrogen bonding, van der Waals forces, and electrostatic interactions, collectively influencing the binding affinity. CDocker interaction energy offers detailed insights into the intensity and nature of specific interactions between the ligand and the receptor.39 Therefore, FDA-approved and Enamine compound libraries, as well as known aldose inhibitors from MCE such as Epalrestat and Ponalrestat, were docked against aldose reductase individually scored based on the minimum docking energy and interaction energy values (Table 2). Aldose reductase-IN-2 (compound 5f), which is an investigational potent aldose reductase inhibitor, demonstrated the most stable interaction with the enzyme. Additionally, flavonoid compounds, such as hydroxyleuteolin and quercetin, exhibited strong interactions. Certain Enamine compounds also displayed stable interactions with the enzyme. Interestingly, known inhibitors such as Epalrestat and Ponalrestat showed relatively weaker interactions (Table 2).
Table 2. Docking Energy Values (kcal/mol) of FDA-Approved, Enamine Library, and Known Inhibitors Compounds against Aldose Reductase, Calculated by Discovery Studio.
| no. | compound | CDocker energy | CDocker interaction energy |
|---|---|---|---|
| 1 | Aldose_Reductase-IN-2 | –53.28 | –56.53 |
| 2 | 6-Hydroxyluteolin | –49.99 | –41.58 |
| 3 | Enamine_59 (Z929520832) | –48.43 | –52.24 |
| 4 | Enamine_173 (Z2376840565) | –47.98 | –49.84 |
| 5 | Quercetin | –47.56 | –42.30 |
| 7 | Enamine_174 (Z2272685769) | –45.39 | –46.32 |
| 9 | Enamine_103 (Z1603680543) | –43.52 | –51.27 |
| 10 | Enamine_133 (Z1455088903) | –43.35 | –53.11 |
| 11 | Enamine_135 (Z1455087495) | –43.08 | –48.65 |
| 12 | enamine_109 (Z234969329) | –42.72 | –46.08 |
| 14 | Enamine_93 (Z1438237770) | –42.55 | –39.85 |
| 15 | Enamine_73 (Z1603611557) | –42.26 | –49.46 |
| 34 | Adrenalone Hydrochloride | –38.10 | –29.57 |
| 40 | Glycylglycine | –37.07 | –28.83 |
| 42 | Epinephrine Hydrochloride | –36.57 | –31.61 |
| 47 | Akrl B10-IN-1 | –36.16 | –42.48 |
| 85 | Ponalrestat | –30.90 | –44.22 |
| 255 | Epalrestat | –5.42 | –38.12 |
Molecular Dynamics (MD) Simulations
To assess the stability of the screened compounds against aldose reductase, the docked complexes were subjected to MD simulations using GROMACS. These simulations were performed for a duration of 100 ns to investigate the behavior and stability of the complexes over time.
Root-Mean-Square Deviation (RMSD)
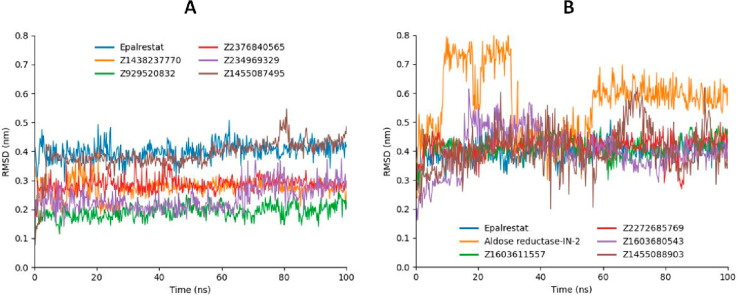
The analysis of molecular dynamics trajectories involved the computation of RMSD to assess ligand fluctuations within the JAK2 protein’s active site. Figure 7 illustrates the RMSD plot of the ligands, providing valuable insights into the dynamic behavior and stability of the ligand–protein interactions over the course of the simulation.
Figure 7.
RMSD values of screened compounds Z2376840565 (red), Z1438237770 (orange), Z234969329 (purple), Z929520832 (green), and Z1455087495 (brown) in contrast to Epalrestat (blue) depicted in graph A, while RMSD values of Z2272685769 (red), Z1603611557 (green), Z1603680543 (purple), Z1455088903 (brown), and Aldose Reductase-IN-2 (orange) in comparison with Epalrestat (blue) manifested in graph B.
The enamine compounds, namely, Z2376840565, Z1438237770, Z234969329, and Z929520832, exhibited consistently low RMSD values compared to the reference compound (Epalrestat). Z1455087495 demonstrated fluctuations similar to those of Epalrestat. Furthermore, Z2272685769 and Z1603611557 also displayed a consistent fluctuating pattern similar to that of Epalrestat, while Z1603680543 and Z1455088903 revealed more fluctuating RMSD values. Additionally, Aldose Reductase-IN-2 underwent three conformational changes during the simulation. Initially, it showed RMS deviation values of σ = 0.45 nm, which increased to σ = 0.75 nm from 10 to 36 ns. Subsequently, it returned to the initial position with σ = 0.4 RMSD values. From 60 to 100 ns, it continued to fluctuate between σ = 0.6 nm and σ = 0.65 nm.
The varying RMSD patterns observed in molecular dynamics simulations of enamine compounds suggest distinct dynamic behaviors and structural stabilities. Enamine compounds Z2376840565, Z1438237770, Z234969329, and Z929520832 exhibit low RMSD values, indicative of stable conformations, possibly due to strong and consistent interactions with the target protein. Furthermore, Z1455087495 demonstrates fluctuations similar to those of the reference compound Epalrestat, suggesting comparable binding characteristics. Moreover, compounds Z2272685769 and Z1603611557 display consistent fluctuations, possibly reflecting dynamic binding modes. In addition, Z1603680543 and Z1455088903 exhibit fluctuating RMSD values, implying variable structural stability, while Aldose Reductase-IN-2 undergoes conformational changes, indicating dynamic structural transitions.
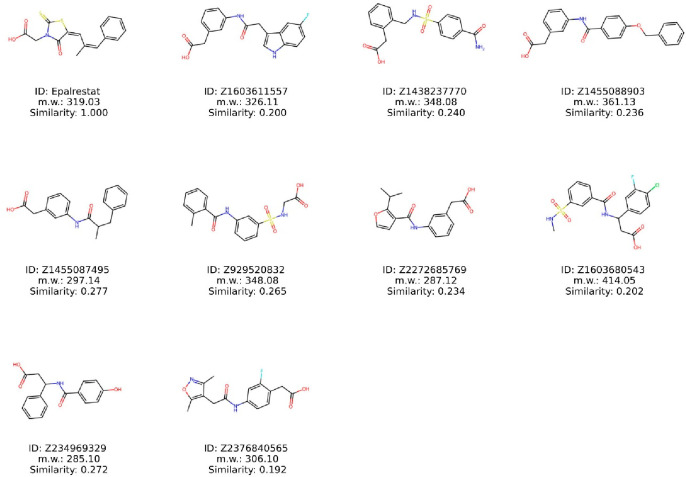
From the MD simulations of 100 ns, we identified the top 9 compounds that displayed stable RMSD values throughout the trajectory (Figure 8). These selected compounds were further evaluated in experimental assessments.
Figure 8.
Structures of compounds exhibiting stable RMSD values compared to the reference compound of Epalrestat.
Structural Evaluation and Similarity Comparison
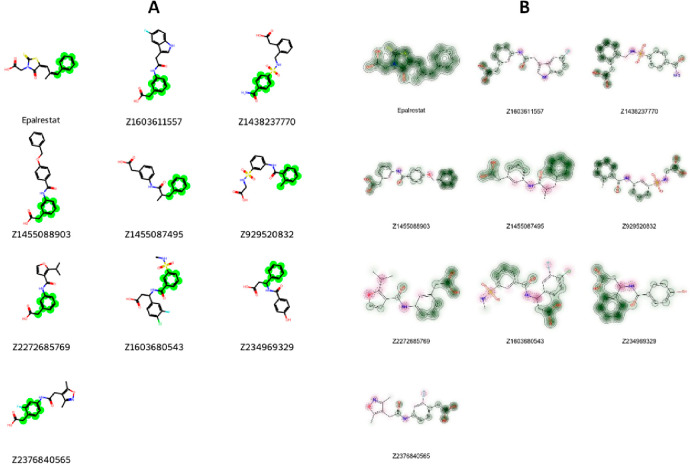
To assess the structural resemblance among the chosen compounds for experimental assessment, the RDKit’s Tanimoto similarity measure was employed. The analysis revealed no significant structural likeness between the selected compounds and Epalrestat, as indicated by Tanimoto similarity E (Table 3). While no precise threshold exists for defining similarity, a Tanimoto similarity score of 0.8 or higher is often regarded as indicative of similarity, ranging from 0 to 1. Here, 0 represents no similarity, while 1 indicates complete similarity. Even though the selected compounds show limited overall similarity to Epalrestat, it is still possible that these compounds share specific common structural patterns. To detect these common substructures, we employed the Maximum Common Substructure (MCS) algorithm, which utilizes SMARTS (SMILES Arbitrary Target Specification) in RDKit. No clear recurrent structural motifs, apart from the benzene ring highlighted in the red color, were obvious (Figure 9). This observation suggests that factors other than structural motif, such as the spatial orientation of particular conformations, could potentially influence the inhibitory activity against aldose reductase. Furthermore, we utilized similarity maps generated by fingerprints in RDKit to ascertain whether the selected compounds exhibit the structural motif present in Epalrestat (Figure 9). The similarity maps of the selected compounds revealed the presence of structural motifs of Epalrestat in their chemical structures. These findings from the MCS and similarity mapping offer valuable insights for guiding additional optimization of the selected compounds.
Table 3. Tanimoto Similarity Comparison of Selected Compounds.
| similarity | Epalrestat | Z1603611557 | Z1438237770 | Z1455088903 | Z1455087495 | Z929520832 | Z2272685769 | Z1603680543 | Z234969329 | Z2376840565 |
|---|---|---|---|---|---|---|---|---|---|---|
| Epalrestat | 0.246 | 0.217 | 0.215 | 0.186 | 0.226 | 0.237 | 0.26 | 0.207 | 0.255 | |
| Z1603611557 | 0.246 | 0.243 | 0.35 | 0.4 | 0.271 | 0.351 | 0.308 | 0.211 | 0.411 | |
| Z1438237770 | 0.217 | 0.243 | 0.307 | 0.232 | 0.415 | 0.285 | 0.381 | 0.243 | 0.253 | |
| Z1455088903 | 0.215 | 0.35 | 0.307 | 0.432 | 0.379 | 0.473 | 0.269 | 0.312 | 0.299 | |
| Z1455087495 | 0.186 | 0.4 | 0.232 | 0.432 | 0.236 | 0.376 | 0.238 | 0.243 | 0.323 | |
| Z929520832 | 0.226 | 0.271 | 0.415 | 0.379 | 0.236 | 0.352 | 0.373 | 0.239 | 0.283 | |
| Z2272685769 | 0.237 | 0.351 | 0.285 | 0.473 | 0.376 | 0.352 | 0.258 | 0.213 | 0.315 | |
| Z1603680543 | 0.26 | 0.308 | 0.381 | 0.269 | 0.238 | 0.373 | 0.258 | 0.509 | 0.268 | |
| Z234969329 | 0.207 | 0.211 | 0.243 | 0.312 | 0.243 | 0.239 | 0.213 | 0.509 | 0.196 | |
| Z2376840565 | 0.255 | 0.411 | 0.253 | 0.299 | 0.323 | 0.283 | 0.315 | 0.268 | 0.196 |
Figure 9.
Visual depiction of the common structural motif identified through Maximum Common Substructure (MCS) analysis using SMARTS (A) and graphical representation illustrating the shared common structural motif through similarity maps (B).
gmx_MMPBSA Analysis
The gmxMMPBSA calculations for a series of compounds alongside the reference compound Epalrestat were further investigated to predict the binding affinity. The ΔG values indicate the total binding free energy between each compound and the target protein, with more negative values reflecting stronger binding affinity (Table 4). Comparing the ΔG values with Epalrestat revealed that Z929520832 exhibits the most negative binding free energy (−35.78 kcal/mol), suggesting the strongest binding affinity among the screened compounds. Z1438237770 (−23.81 kcal/mol) and Z1603611557 (−30.38 kcal/mol) also demonstrate relatively strong binding affinities compared with Epalrestat (−21.48 kcal/mol). The compounds Z2376840565 and Z1455087495 show less favorable binding free energies (−25.76 and −26.47 kcal/mol, respectively) compared to Epalrestat but still indicate potential binding interactions. Overall, Z929520832 is considered the most promising compound due to its significantly more negative ΔG value, indicating a stronger predicted binding affinity with the target protein.
Table 4. Binding Free Energy Calculation of Top Simulated Compounds.
| Sr | compounds | ΔG(TOTAL) | std dev |
|---|---|---|---|
| 1 | Z1438237770 | –23.81 | 5.75 |
| 2 | Z929520832 | –35.78 | 4.04 |
| 3 | Z1603611557 | –30.38 | 5.47 |
| 4 | Z2272685769 | –18.34 | 8.64 |
| 5 | Z2376840565 | –25.76 | 6.83 |
| 6 | Z234969329 | –15.95 | 5.42 |
| 7 | Z1603680543 | –18.72 | 7.49 |
| 8 | Z1455088903 | –17.91 | 5.52 |
| 9 | Z1455087495 | –26.47 | 8.72 |
| 10 | Epalrestat | –21.48 | 4.39 |
Experimental Validation
To validate the Insilco results, we further investigated aldose reductase inhibitory activity of nine compounds at a 10 μM concentration, aligned with the reported IC50 range of Epalrestat for relevant efficacy.40 Epalrestat demonstrated a remarkable inhibition of aldose reductase, achieving 90% inhibition. Noticeably, Z-565 (Z2376840565) also displayed a significant inhibition of aldose reductase, reaching 80% inhibition (Figure 10). Considering that Epalrestat is recognized as a potent aldose reductase inhibitor due to its irreversible inhibition mechanism, it is reasonable to speculate that the inhibition potency of the Z-565 compound might be quite noticeable. Other selected compounds also demonstrated a certain degree of inhibition. It may be worth considering that structural modifications could be considered to enhance the inhibitory activity of Z-565. This approach could potentially lead to further improvements in its effectiveness as an aldose reductase inhibitor.
Figure 10.
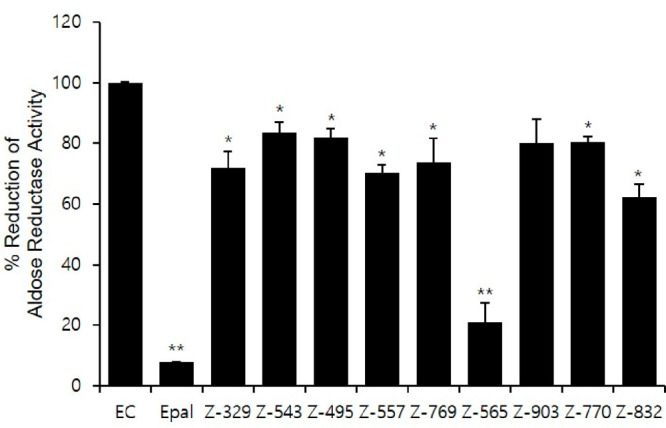
Aldose reductase inhibitory activity of selected compounds in comparison to Epalrestat.
Epalrestat showed the most significant reduction activity, achieving a 92.22% decrease. This is followed by Z2376840565, which demonstrates a 69.11% reduction. In contrast, Z1603680543 exhibits the least reduction, lowering the activity by only 16.35%. Comparing these with the binding free energy (ΔG) results, Z929520832 displays the most negative value at −35.78 kcal/mol, indicating strong binding affinity despite its lower reduction activity percentage compared to Epalrestat and Z2376840565. Z1438237770 and Z1603611557 also manifest relatively negative ΔG values, suggesting remarkable binding affinity despite their low reduction activity percentages. Z2376840565, with its 69.11% reduction activity, exhibits a negative ΔG value (−25.76) comparable to the reference Epalrestat (−21.48), indicating significant inhibition and binding affinity. Z1603680543 demonstrates the least reduction activity (16.35%) and high ΔG values (−18.72 kcal/mol). Z2376840565 and Z929520832 occupied third and fourth rank in molecular docking studies, while Z1603611557 also comes under top 15 screened compounds with docking energy values of −48.43, −47.98, and 42.26 kcal/mol, respectively. Overall, Z2376840565 found a promising candidate compound against aldose reductase from screened compounds based on interaction inhibition, whereas Z929520832 and Z1603611557 also appear encouraging due to strong binding affinity and relative inhibition.
However, our study identified an inconsistency between molecular docking results and biological evaluations, highlighting a significant challenge in using computational models alone for predicting compound efficacy. This discrepancy underlines the limitations of computational methods such as molecular docking and MD simulations, especially in accurately modeling complex biochemical interactions. This finding emphasizes the need for caution in relying solely on computational predictions and reaffirms the critical role of experimental validation in drug discovery. It serves as a reminder that computational tools should be used as initial guides, complemented by thorough experimental testing to ensure a comprehensive understanding of a compound’s therapeutic potential. Acknowledging the observed discrepancies between our computational predictions and biological evaluations, we recognize the imperative need for comprehensive biophysical analyses in future studies. Techniques such as isothermal titration calorimetry (ITC), differential scanning fluorometry (DSF), and surface plasmon resonance (SPR) are essential not only for accurately determining the binding affinity of compounds to the target enzyme but also for assessing their selectivity toward other proteins. This will provide a more robust understanding of the compound interactions at the molecular level and will be a crucial step in our ongoing research efforts.
Conclusion
In conclusion, our study presents a comprehensive approach in the identification and development of potential therapeutic agents targeting aldose reductase, a key enzyme implicated in complications associated with diabetes mellitus (DM). By employing ligand-based and structure-based virtual screening, we have successfully integrated advanced computational methodologies with experimental validation to identify a promising inhibitor of aldose reductase. Our research methodology not only led to the discovery of a compound with significant potential as an aldose reductase inhibitor but also exemplifies a novel and efficient pathway for drug discovery and development. Further enhancement of the effectiveness of Z-565 through structural modifications might provide a valuable therapeutic potential for the treatment of DM-mediated complications.
Methodology
Aldose Reductase Data Set, FDA-Approved Drug Library, and Commercial Enamine Compound Library
The DUD-E Web site was utilized to retrieve aldose reductase active and decoy (https://dude.docking.org/). The active data set consisted of 159 compounds, while the decoy data set comprised 9000 compounds. All molecules were depicted as canonicalized SMILES strings along with corresponding DUD-E ID and ChEMBL ID numbers. The compounds were differentiated as either active or decoy in the legend. Furthermore, a FDA-approved drug library comprising 3105 compounds was sourced from the Selleck Chemicals Web site (https://www.selleckchem.com). Enamine compound library was obtained from the Web site of Enamine Ltd. (https://enamine.net/compound-libraries/diversity-libraries). The Hit Locator Library (HLL-460) consists of 460160 compounds, encompassing a wide range of chemical structures and functionalities. The FDA-approved drugs and HLL-460 were initially expressed in SDF (structure-data file) format and transformed to SMILES strings by employing RDKit. In addition, known 50 aldose inhibitors, as reference drugs, were acquired from MedChemExpress (https://www.medchemexpress.com/) in the SMILES strings format.
Molecular Descriptor Generation Using RDKit
To derive molecular descriptors from the compounds, we employed RDKit (https://www.rdkit.org), an open-source, high-performance cheminformatics and machine learning toolkit implemented in Python. The toolkit includes capabilities for calculating molecular descriptors, generating chemical features, and visualizing chemical data.
Deep Learning Architecture
The aldose reductase active and decoy data sets underwent division into training, validation, and test sets at an 8:1:1 ratio. Subsequently, deep learning evaluation was performed using the GraphConvMol model within DeepChem (https://deepchem.io/models). The GraphConvMol, a graph convolutional neural network, excels in learning features from graph-structured input data, like molecular graphs. This model preprocesses molecular structures into graphs, where atoms and bonds serve as nodes and edges, respectively. Subsequent convolutional graph layers are stacked to extract hierarchical features from these molecular graphs. These layers consist of trainable parameters with adjustable weights, enabling optimization of the learning process to effectively capture molecular structure traits.
During the training phase, the model minimizes the loss function concerning input molecular data sets. Through back-propagation, the weights of the convolutional layers are optimized, aiming to predict properties such as solubility, bioactivity, and toxicity based on the given molecular structures.
Aldose Reductase Structure Retrieval
The three-dimensional structure of the human aldose reductase protein, identified by the PDB ID 1PWM with a resolution of 0.92 Å, was acquired from the Protein Data Bank (PDB) accessible at https://www.rcsb.org/. The aldose reductase protein, comprising alpha-helices, beta-sheets, coils, and turns, underwent a comprehensive quantitative structural analysis utilizing the VADAR Internet server (http://vadar.wishartlab.com/). Subsequently, energy minimization and Ramachandran plot analysis were carried utilizing UCSF Chimera and Discovery Studio.41,42
Prediction of Active Binding Site
The positioning of a ligand within a protein’s holo structure is a key determinant of the protein’s binding pocket.43 The aldose reductase and inhibitor (fidarestat) complex already available on PDB (PDB ID: 1PWM) was further utilized for binding pocket analysis. The identification of interacting amino acids was accomplished through Discovery Studio’s ligand interaction approach, ensuring precision in the generation of the binding site. Additionally, the bound ligand was chosen, and the binding sphere was created using the current selection approach within the define Binding Site window of Discovery Studio. Subsequently, the binding sphere was reduced with restrictions specific to the selected amino acids for the accuracy and precision of docking.
Molecular Docking
Molecular docking stands as the extensively employed approach for assessing the interactions between ligands and receptor.44 It forecasts the strength of association or binding energy of a protein–ligand complex by assessing its preferred orientation using scoring algorithms in the process.37 The already bound ligand molecules and water molecules were deleted from the protein. Furthermore, the hydrogens were appended to the protein utilizing Discovery Studio’s receptor preparation module. Moreover, the ligand preparations for both reference and candidate compounds included the generation of tautomers, adjustment of the ionization states, and correction of any bad valences. These tasks were performed by using the Ligands Preparation module in Discovery Studio.
The molecular docking of ligands against the target protein aldose reductase was conducted using the CDocker module in Discovery Studio, employing default orientation and conformation settings. Therefore, the assessment of the best docked complexes relied on selecting the lowest docking energy values, measured in kcal/mol.
Molecular Dynamics (MD) Simulations
The protocols for the MD simulation experiment were adapted as previously published data of a 100 ns simulation.20 The top compounds exhibiting the lowest docking energy were selected for a 100 ns MD simulation. Additionally, Epalrestat, serving as a reference compound, underwent MD simulations for comparative analysis. The CHARMM36 force field was set up using the solution builder protocol on the Web server of CHARMM-GUI (https://www.charmm-gui.org/?doc=input/solution). This same interface was employed to generate input files for MD simulations using GROMACS.45 The solvation of the system utilized the TIP3P-3 point water model within a cubic box, employing periodic boundary conditions. Neutralization was achieved by introducing counterions. Electrostatic and van der Waals interactions were computed using the Verlet method with a cutoff radius of 10, while the LINCS algorithm was employed to maintain bond lengths during simulations. Additionally, the particle mesh Ewald (PME) approach was used for accurate electrostatic interaction calculations. The steepest descent energy minimization method was applied to prepare the solvated systems. Subsequently, two equilibration phases were carried out, initially under constant temperature and constant volume (NVT) conditions, followed by constant temperature and constant pressure (NPT) conditions. A Python script from CHARMM-GUI facilitated the conversion of GROMACS topology (top) and parameter (top) files for MD simulations. Furthermore, the investigation of the structural behavior of protein–ligand complexes was conducted using GROMACS version 2019.3 in a Linux system.46 A 2 fs time step was utilized to run MD simulations in GROMACS.
Gmx_MMPBSA Analysis
A software tool named gmx_MMPBSA (https://valdes-tresanco-ms.github.io/gmx_MMPBSA/dev/) was developed to compute binding free energies using trajectory data from molecular dynamics simulations, basically for the assessment of binding free energies of protein–ligand interactions. In this study, we employed the MM/PBSA technique to predict binding free energies from molecular dynamics trajectories conducted in explicit solvent, analyzing the complex, receptor, and ligand components separately. The trajectories ranging from 0 to 100 ns were utilized to evaluate the binding free energy of the top complexes. The calculation of the binding free energy (ΔG) of the lead compounds when bound to the protein was performed using a specific equation:
| 1 |
In the preceding equation, Gcomplex represents the energy of the ligand–protein complex, while Gprotein and Gligand denote the energies of the protein and ligand, respectively, in a solvent environment.
Aldose Reductase Enzyme Inhibition Assay
Nine enamine compounds were purchased from Enamine Ltd. Eplarestat, a reference compound, and the nine compounds were dissolved in DMSO. Aldose reductase activity was measured using the Aldose Reductase Inhibitor Screening Kit (colorimetric) from Abcam (#ab283360, Abcam, UK) following the manufacturer’s instructions at a final concentration of 10 μM. The reactions were monitored at 340 nm in the kinetic mode for 60–90 min at 37 °C using a microplate spectrophotometer (Molecular Devices, San Jose, CA). To address concerns about potential colorimetric interferences due to the compounds’ structures, absorbance values were corrected using corresponding controls which contained all components except the substrate. All assays were performed in triplicate.
Statistical Analysis
All values presented in Figure 9 were expressed as the mean ± SD, derived from a minimum of three independent experiments. Statistical significance was assessed using a two-tailed Student’s t test, with a value of p < 0.05 considered statistically significant. The single (∗) and double (∗∗) asterisks denote statistical significance at p < 0.05 and p < 0.01, respectively.
Acknowledgments
This work was supported by the Korea Basic Science Institute (National Research Facilities and Equipment Center) grant funded by the Ministry of Education (Grant 2022R1A6C101A739).
Data Availability Statement
The information about DeepChem library is available on Github at https://github.com/deepchem/deepchem. The data that support the findings of this study are available from the corresponding author upon reasonable request.
Author Contributions
M.Y. and J.Y.P. were involved in the experimental operation and data analysis. W.C. was involved in the conceptualization, writing, reviewing, and editing of the manuscript. M.Y. and W.C. confirmed the authenticity of all the raw data. All authors have read and approved the final manuscript.
The authors declare no competing financial interest.
References
- Singh M.; Kapoor A.; Bhatnagar A. Physiological and pathological roles of aldose reductase. Metabolites 2021, 11 (10), 655. 10.3390/metabo11100655. [DOI] [PMC free article] [PubMed] [Google Scholar]
- Tang W. H.; Martin K. A.; Hwa J. Aldose reductase, oxidative stress, and diabetic mellitus. Front Pharmacol. 2012, 3, 87. 10.3389/fphar.2012.00087. [DOI] [PMC free article] [PubMed] [Google Scholar]
- Kazeem M. I.; Umukoro O. G.; Ogunrinola O. O.; Nafiu M. O.; Akanji M. A. Leafy vegetables inhibit activities of aldose reductase and sorbitol dehydrogenase in vitro. International Journal of Vegetable Scienc 2021, 27 (6), 552–560. 10.1080/19315260.2021.1887422. [DOI] [Google Scholar]
- Yapar G.; Duran H. E.; Lolak N.; Akocak S.; Türkeş C.; Durgun M.; Işık M.; Beydemir Ş. J. B. C. Biological effects of bis-hydrazone compounds bearing isovanillin moiety on the aldose reductase. Bioorg Chem. 2021, 117, 105473. 10.1016/j.bioorg.2021.105473. [DOI] [PubMed] [Google Scholar]
- Srikanth K. K.; Orrick J. A.. Biochemistry, Polyol Or Sorbitol Pathways. In StatPearls; StatPearls Publishing LLC.: 2024. [PubMed] [Google Scholar]
- Willermain F.; Scifo L.; Weber C.; Caspers L.; Perret J.; Delporte C. Potential Interplay between Hyperosmolarity and Inflammation on Retinal Pigmented Epithelium in Pathogenesis of Diabetic Retinopathy. Int. J. Mol. Sci. 2018, 19 (4), 1056. 10.3390/ijms19041056. [DOI] [PMC free article] [PubMed] [Google Scholar]
- Franco R.; Serrano-Marín J.; Navarro G.; Rivas-Santisteban R. The NADPH Link between the Renin Angiotensin System and the Antioxidant Mechanisms in Dopaminergic Neurons. Antioxidants (Basel, Switzerland) 2023, 12 (10), 1869. 10.3390/antiox12101869. [DOI] [PMC free article] [PubMed] [Google Scholar]
- Moon D. O. NADPH Dynamics: Linking Insulin Resistance and β-Cells Ferroptosis in Diabetes Mellitus. Int. J. Mol. Sci. 2024, 25 (1), 342. 10.3390/ijms25010342. [DOI] [PMC free article] [PubMed] [Google Scholar]
- Rohman M. M.; Islam M. R.; Habib S. H.; Choudhury D. A.; Mohi-Ud-Din M. NADPH oxidase-mediated reactive oxygen species, antioxidant isozymes, and redox homeostasis regulate salt sensitivity in maize genotypes. Heliyon 2024, 10 (5), e26920 10.1016/j.heliyon.2024.e26920. [DOI] [PMC free article] [PubMed] [Google Scholar]
- Chen I. T.; Lee D.-Y.; Huang Y.-T.; Kou G.-H.; Wang H.-C.; Chang G.-D.; Lo C.-F. Six Hours after Infection, the Metabolic Changes Induced by WSSV Neutralize the Host’s Oxidative Stress Defenses. Sci. Rep. 2016, 6 (1), 27732. 10.1038/srep27732. [DOI] [PMC free article] [PubMed] [Google Scholar]
- Maraldi T.; Angeloni C.; Prata C.; Hrelia S. NADPH Oxidases: Redox Regulators of Stem Cell Fate and Function. Antioxidants (Basel, Switzerland) 2021, 10 (6), 973. 10.3390/antiox10060973. [DOI] [PMC free article] [PubMed] [Google Scholar]
- Lim J. C.; Vorontsova I.; Martis R. M.; Donaldson P. J.. Animal Models in Cataract Research. In Animal Models for the Study of Human Disease; Elsevier: 2017; pp 103–116. [Google Scholar]
- Pescosolido N.; Barbato A.; Giannotti R.; Komaiha C.; Lenarduzzi F. Age-related changes in the kinetics of human lenses: prevention of the cataract. Int. J. Ophthalmol 2016, 9 (10), 1506. [DOI] [PMC free article] [PubMed] [Google Scholar]
- Braakhuis A. J.; Donaldson C. I.; Lim J. C.; Donaldson P. J. Nutritional strategies to prevent lens cataract: current status and future strategies. Nutrients 2019, 11 (5), 1186. 10.3390/nu11051186. [DOI] [PMC free article] [PubMed] [Google Scholar]
- Gonçalves N. P.; Vægter C. B.; Andersen H.; Østergaard L.; Calcutt N. A.; Jensen T. S. Schwann cell interactions with axons and microvessels in diabetic neuropathy. Nat. Rev. Neurol 2017, 13 (3), 135–147. 10.1038/nrneurol.2016.201. [DOI] [PMC free article] [PubMed] [Google Scholar]
- Niimi N.; Yako H.; Takaku S.; Chung S. K.; Sango K. Aldose Reductase and the Polyol Pathway in Schwann Cells: Old and New Problems. Int. J. Mol. Sci. 2021, 22 (3), 1031. 10.3390/ijms22031031. [DOI] [PMC free article] [PubMed] [Google Scholar]
- Vincent A. M.; Russell J. W.; Low P.; Feldman E. L. Oxidative Stress in the Pathogenesis of Diabetic Neuropathy. Endocrine Reviews 2004, 25 (4), 612–628. 10.1210/er.2003-0019. [DOI] [PubMed] [Google Scholar]
- Singh Grewal A.; Bhardwaj S.; Pandita D.; Lather V.; Singh Sekhon B. Updates on aldose reductase inhibitors for management of diabetic complications and non-diabetic diseases. Mini Rev. Med. Chem. 2015, 16 (2), 120–162. 10.2174/1389557515666150909143737. [DOI] [PubMed] [Google Scholar]
- Sonowal H.; Ramana K. V. Development of aldose reductase inhibitors for the treatment of inflammatory disorders and cancer: Current drug design strategies and future directions. Curr. Med. Chem. 2021, 28 (19), 3683–3712. 10.2174/0929867327666201027152737. [DOI] [PubMed] [Google Scholar]
- Yasir M.; Park J.; Han E. T.; Park W. S.; Han J. H.; Kwon Y. S.; Lee H. J.; Chun W. Machine Learning-Based Drug Repositioning of Novel Janus Kinase 2 Inhibitors Utilizing Molecular Docking and Molecular Dynamic Simulation. J. chem inf model 2023, 63 (21), 6487–6500. 10.1021/acs.jcim.3c01090. [DOI] [PubMed] [Google Scholar]
- Kunduru A. Machine Learning in Drug Discovery: A Comprehensive Analysis of Applications, Challenges, and Future Directions. Int. J. Orange Tech. 2023, 5 (8), 29–37. [Google Scholar]
- Jing Y.; Bian Y.; Hu Z.; Wang L.; Xie X.-Q. S. Deep learning for drug design: an artificial intelligence paradigm for drug discovery in the big data era. AAPS J. 2018, 20, 1–10. 10.1208/s12248-018-0210-0. [DOI] [PMC free article] [PubMed] [Google Scholar]
- Zhao L.; Ciallella H. L.; Aleksunes L. M.; Zhu H. Advancing computer-aided drug discovery (CADD) by big data and data-driven machine learning modeling. Drug Dicov Today 2020, 25 (9), 1624–1638. 10.1016/j.drudis.2020.07.005. [DOI] [PMC free article] [PubMed] [Google Scholar]
- Pantsar T.; Poso A. J. M. Binding affinity via docking: fact and fiction. Molecules 2018, 23 (8), 1899. 10.3390/molecules23081899. [DOI] [PMC free article] [PubMed] [Google Scholar]
- Pagadala N. S.; Syed K.; Tuszynski J. Software for molecular docking: a review. Biophys Rev. 2017, 9, 91–102. 10.1007/s12551-016-0247-1. [DOI] [PMC free article] [PubMed] [Google Scholar]
- Salo-Ahen O. M. H.; Alanko I.; Bhadane R.; Bonvin A. M. J. J.; Honorato R. V.; Hossain S.; Juffer A. H.; Kabedev A.; Lahtela-Kakkonen M.; Larsen A. S.; Lescrinier E.; Marimuthu P.; Mirza M. U.; Mustafa G.; Nunes-Alves A.; Pantsar T.; Saadabadi A.; Singaravelu K.; Vanmeert M. Molecular Dynamics Simulations in Drug Discovery and Pharmaceutical Development. Processes 2021, 9 (1), 71. 10.3390/pr9010071. [DOI] [Google Scholar]
- Pieroni M.; Madeddu F.; Di Martino J.; Arcieri M.; Parisi V.; Bottoni P.; Castrignanò T. MD-Ligand-Receptor: A High-Performance Computing Tool for Characterizing Ligand–Receptor Binding Interactions in Molecular Dynamics Trajectories. Int. J. Mol. Sci. 2023, 24 (14), 11671. 10.3390/ijms241411671. [DOI] [PMC free article] [PubMed] [Google Scholar]
- Phillips M. A.; Stewart M. A.; Woodling D. L.; Xie Z.-R.. Has Molecular Docking Ever Brought Us a Medicine; IntechOpen: London, UK, 2018; Vol. 141. [Google Scholar]
- Mysinger M. M.; Carchia M.; Irwin J. J.; Shoichet B. K. Directory of useful decoys, enhanced (DUD-E): better ligands and decoys for better benchmarking. J. Med. Chem. 2012, 55 (14), 6582–6594. 10.1021/jm300687e. [DOI] [PMC free article] [PubMed] [Google Scholar]
- Zhang Y.; Vass M.; Shi D.; Abualrous E.; Chambers J. M.; Chopra N.; Higgs C.; Kasavajhala K.; Li H.; Nandekar P. J.; et al. Modeling, Benchmarking refined and unrefined AlphaFold2 structures for hit discovery. J. Chem. Inf Model 2023, 63 (6), 1656–1667. 10.1021/acs.jcim.2c01219. [DOI] [PubMed] [Google Scholar]
- Sabe V. T.; Ntombela T.; Jhamba L. A.; Maguire G. E.; Govender T.; Naicker T.; Kruger H. G. Current trends in computer aided drug design and a highlight of drugs discovered via computational techniques: A review. Eur. J. Med. Chem. 2021, 224, 113705. 10.1016/j.ejmech.2021.113705. [DOI] [PubMed] [Google Scholar]
- Minnich A. J.; McLoughlin K.; Tse M.; Deng J.; Weber A.; Murad N.; Madej B. D.; Ramsundar B.; Rush T.; Calad-Thomson S.; Brase J.; Allen J. E. modeling, AMPL: a data-driven modeling pipeline for drug discovery. J. Chem. Inf Model 2020, 60 (4), 1955–1968. 10.1021/acs.jcim.9b01053. [DOI] [PMC free article] [PubMed] [Google Scholar]
- Ramsundar B.; Eastman P.; Walters P.; Pande V.. Deep Learning for the Life Sciences: Applying Deep Learning to Genomics, Microscopy, Drug Discovery, and More; O’Reilly Media, Inc.: 2019. [Google Scholar]
- Grebner C.; Matter H.; Kofink D.; Wenzel J.; Schmidt F.; Hessler G. Application of deep neural network models in drug discovery programs. ChemMedChem. 2021, 16 (24), 3772–3786. 10.1002/cmdc.202100418. [DOI] [PubMed] [Google Scholar]
- Grebner C.; Matter H.; Hessler G. J. Artificial intelligence in compound design. Methods Mol. Biol. 2022, 2390, 349–382. 10.1007/978-1-0716-1787-8_15. [DOI] [PubMed] [Google Scholar]
- Sirois J.; Sayasith K.; Brown K. A.; Stock A. E.; Bouchard N.; Doré M. Cyclooxygenase-2 and its role in ovulation: a 2004 account. Hum Reprod Update 2004, 10 (5), 373–385. 10.1093/humupd/dmh032. [DOI] [PubMed] [Google Scholar]
- Yasir M.; Park J.; Han E.-T.; Park W. S.; Han J.-H.; Kwon Y.-S.; Lee H.-J.; Hassan M.; Kloczkowski A.; Chun W. Exploration of Flavonoids as Lead Compounds against Ewing Sarcoma through Molecular Docking, Pharmacogenomics Analysis, and Molecular Dynamics Simulations. Molecules 2023, 28 (1), 414. 10.3390/molecules28010414. [DOI] [PMC free article] [PubMed] [Google Scholar]
- El-Kabbani O.; Darmanin C.; Schneider T. R.; Hazemann I.; Ruiz F.; Oka M.; Joachimiak A.; Schulze-Briese C.; Tomizaki T.; Mitschler A.; Podjarny A. Ultrahigh resolution drug design. II. Atomic resolution structures of human aldose reductase holoenzyme complexed with Fidarestat and Minalrestat: implications for the binding of cyclic imide inhibitors. Proteins 2004, 55 (4), 805–13. 10.1002/prot.20001. [DOI] [PubMed] [Google Scholar]
- Yasir M.; Park J.; Lee Y.; Han E. T.; Park W. S.; Han J. H.; Kwon Y. S.; Lee H. J.; Chun W. Discovery of GABA Aminotransferase Inhibitors via Molecular Docking, Molecular Dynamic Simulation, and Biological Evaluation. Int. J. Mol. Sci. 2023, 24 (23), 16990. 10.3390/ijms242316990. [DOI] [PMC free article] [PubMed] [Google Scholar]
- Zhang H.; Xu C.; Tian Q.; Zhang Y.; Zhang G.; Guan Y.; Tong S.; Yan J. Screening and characterization of aldose reductase inhibitors from Traditional Chinese medicine based on ultrafiltration-liquid chromatography mass spectrometry and in silico molecular docking. J. Ethnopharmacol 2021, 264, 113282. 10.1016/j.jep.2020.113282. [DOI] [PubMed] [Google Scholar]
- Pettersen E. F.; Goddard T. D.; Huang C. C.; Couch G. S.; Greenblatt D. M.; Meng E. C.; Ferrin T. E. UCSF Chimera—a visualization system for exploratory research and analysis. J. Comput. Chem. 2004, 25 (13), 1605–1612. 10.1002/jcc.20084. [DOI] [PubMed] [Google Scholar]
- Discovery Studio, 2008.
- Yasir M.; Park J.; Han E.-T.; Park W. S.; Han J.-H.; Kwon Y.-S.; Lee H.-J.; Chun W. Vismodegib Identified as a Novel COX-2 Inhibitor via Deep-Learning-Based Drug Repositioning and Molecular Docking Analysis. ACS Omega 2023, 8 (37), 34160–34170. 10.1021/acsomega.3c05425. [DOI] [PMC free article] [PubMed] [Google Scholar]
- Yasir M.; Park J.; Han E.-T.; Park W. S.; Han J.-H.; Kwon Y.-S.; Lee H.-J.; Hassan M.; Kloczkowski A.; Chun W. Investigation of Flavonoid Scaffolds as DAX1 Inhibitors against Ewing Sarcoma through Pharmacoinformatic and Dynamic Simulation Studies. Int. J. Mol. Sci. 2023, 24 (11), 9332. 10.3390/ijms24119332. [DOI] [PMC free article] [PubMed] [Google Scholar]
- Jo S.; Kim T.; Iyer V. G.; Im W. CHARMM-GUI: a web-based graphical user interface for CHARMM. J. Comput. Chem. 2008, 29 (11), 1859–1865. 10.1002/jcc.20945. [DOI] [PubMed] [Google Scholar]
- Berendsen H. J.; van der Spoel D.; van Drunen R. GROMACS: A message-passing parallel molecular dynamics implementation. Comput. Physics 1995, 91 (1–3), 43–56. 10.1016/0010-4655(95)00042-E. [DOI] [Google Scholar]
Associated Data
This section collects any data citations, data availability statements, or supplementary materials included in this article.
Data Availability Statement
The information about DeepChem library is available on Github at https://github.com/deepchem/deepchem. The data that support the findings of this study are available from the corresponding author upon reasonable request.


