Abstract
The influence of oil-based drilling fluid on the geochemical characteristics of source rocks has been widely reported in the northern South China Sea. However, contamination from water-based HEM drilling fluid has long been neglected in previous deep-water petroleum exploration. To further understand the impacts of HEM drilling fluid on deep-water source rocks, the organic matter abundance and type, kerogen maceral composition, and saturated biomarkers of the deep-water source rocks in the Qiongdongnan Basin were investigated. The influence of HEM drilling fluid on the organic geochemistry data of cuttings is significant but minor for sidecores. It is evident that the organic drilling additives in HEM drilling fluid can increase the organic matter abundance and optimize the organic matter types of shale cuttings. Specifically, the total organic carbon, S1, S2, and hydrogen index are increased by 28.5 ± 6.1, 90.8 ± 2.0, 34.2 ± 2.0, and 51.9 ± 4.0%, respectively. Furthermore, the organic drilling additives will greatly enhance the levels of C29 regular steranes, especially for C29-ααα-20R sterane, with the influence still persisting even when conducting GC-MS-MS analysis. The highly abundant 17α (H) -22, 29, 30-trisnorhopane, 17β (H)-22, 29, 30-trisnorhopane, C29−3117α (H), 21β (H) hopanes, and C29−31 17β (H), 21α (H) hopanes may directly originate from the organic drilling additives. It is dangerous to directly use organic geochemical data from deep-water source rock cuttings contaminated by HEM drilling fluid as it may lead to conclusions that are entirely inconsistent with the basin’s geological background.
1. Introduction
Drilling fluid is an indispensable medium in the well drilling process, serving to carry rock cuttings, cool and lubricate the drill bit, and maintain formation pressure.1 The most common types of drilling fluid are water- and oil-based. Water-based drilling fluid is currently the most widely used in petroleum exploration, while oil-based drilling fluid is predominantly utilized in high-temperature and high-pressure geological settings.2−4 In recent years, petroleum exploration in the Qiongdongnan Basin has increasingly focused on deep-water areas (high-temperature and high-pressure), with water depths exceeding 2000 m. This trend has introduced new requirements for current drilling technologies.5,6 Traditional water-based drilling fluid softens the drilling cuttings, while oil-based drilling fluid will seriously contaminate geological samples. The HEM water-based fluid system was developed and successfully applied in the Qiongdongnan Basin.7 Its fundamental compositions include seawater, Na2CO3, PF-FLO, XCH, PF-UHIB, PF-HLUB, KCl, PF-UCAP, NaCl, and Barite.7 In practical applications, additional organic drilling additives may also be incorporated to overcome different geological conditions. Advancements in drilling technology have led to the discovery of a series of gas fields in the deep-water areas of the Qiongdongnan Basin.8 Extensive research on the influence of oil-based drilling fluid on source rocks has been conducted in the past,9 whereas the contamination from HEM drilling fluid has not received sufficient attention. This oversight could increase petroleum exploration risks in the deep-water areas of the Qiongdongnan Basin. It is essential to understand the impact of the HEM drilling fluid on the geochemical data of the source rocks.
In this study, we conducted systematic organic geochemical analyses of shale cutting and sidecore samples from seven wells in the Qiongdongnan Basin to further understand the influences of HEM drilling fluid on total organic carbon (TOC), rock pyrolysis parameters, kerogen maceral composition, and molecular fossils.
2. Geological Setting
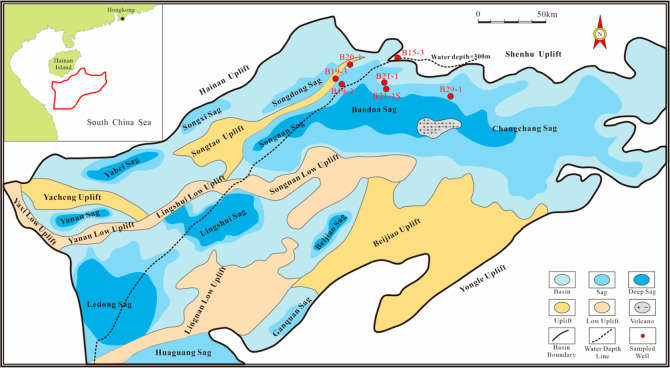
The Qiongdongnan Basin is an extensional sedimentary basin developed against the background of a Cenozoic fault depression and quasi-passive continental margin, located in the northern South China Sea, with an area of approximately 80,000 km2.10 The water depth line divides the Qiongdongnan basin into deep- and shallow-water areas, with the deep-water area covering the majority of the Basin.11 According to the tectonic framework, this basin can be divided into three depressions: the Northern Depression contains Yabei, Yanan, Songxi, and Songdong Sags; the Central Depression contains Ledong, Lingshui, Beijiao, Songnan, Baodao, and Changchang Sags, and the Southern Depression contains Huaguang and Ganquan Sags (Figure 1). From bottom to top, the stratigraphy of the Qiongdongnan Basin consists of the Eocene Lingtou Formation, the Oligocene Yacheng and Lingshui Formation, the Miocene Sanya, Meishan, and Huangliu Formation, the Pliocene Yinggehai Formation, and the Quaternary Ledong Formation. The sedimentary facies are predominantly characterized as deltaic, littoral, and neritic during the Oligocene.
Figure 1.
Geological profile map of the Qiongdongnan Basin and the locations of the wells mentioned in this study.
High formation temperature and ultrahigh formation pressure, caused by the rapid subsidence of Neogene sediments and the thinning of the lithosphere, are critical geological signatures of the Qiongdongnan Basin.12 The complex geological conditions present great challenges for deep-water petroleum exploration. The Oligocene marine terrigenous source rocks, widely distributed throughout the Qiongdongnan Basin, received substantial terrestrial organic material transported by fluvial-delta systems and are regarded as the primary oil and gas sources in the deep-water areas.13,14 These source rocks are characterized by huge thickness but relatively low organic matter abundance, mainly comprising Type III to II2 organic matter, which is predominantly associated with gas generation and supplemented by oil generation.15 In the past decade, a series of deep-water gas fields, such as LS17, LS18, LS22, LS25, and BD21, have been discovered in the Central Depression of the Qiongdongnan Basin.8
3. Materials and Method
A total of 214 Oligocene and upper Miocene shales (including 29 sidecores and 185 cuttings) were obtained from all seven wells located in Baodao Sag and Songdong Sag (Figure 1). For wells B21-1, B21-1S, and B29-1 located in the deep-water area, HEM drilling fluids were utilized, while traditional water-based drilling fluids were employed for wells B15-3, B19-2, B19-3, and B20-1 in the shallow-water area.
3.1. TOC and Rock Pyrolysis Analysis
The TOC analysis was conducted on all 214 samples (including 185 cuttings and 29 sidecores) using a LECO CS744 analyzer. Prior to analysis, shale samples were crushed to 100 mesh and treated with HCl to eliminate carbonate rocks. Rock pyrolysis analysis was carried out using a Rock-Eval VI analyzer to measure parameters including free hydrocarbons (S1), pyrolyzed hydrocarbons (S2), and the peak temperature of S2 (Tmax). The temperature procedure of Rock pyrolysis analysis refers to the national standard GB/T 18602-2012.
3.2. Kerogen Maceral Composition
A total of 90 cutting samples from wells B15-3, B19-2, B19-3, B20-1, and B21-1 were treated with 10% hydrochloric acid and 70% hydrofluoric acid to remove carbonates and silica, respectively. Then, the kerogen fractions were embedded in Lucite and examined under a Leica DM4000B microscope using both transmission and fluorescent light. The analysis method adhered to the industry standard (SY/T 5125-1996).
3.3. GC–MS and GC–MS–MS
Saturated fractions were obtained from shale cuttings and sidecores from wells B21-1, B21-1S, and B29-1 using Soxhlet extraction and column chromatography. GC–MS analyses of the saturated fractions were performed on an Agilent 7890A gas chromatography-5795C mass spectrometer equipped with an HP-5MS (60 m × 0.25 mm × 0.25 μm) fused silica capillary column. Helium served as the carrier gas at a constant flow rate of 1.5 mL/min. Operating conditions for the GC were as follows: the inlet temperature was set to 300 °C, the oven was ramped from 40 to 300 °C at a programmed rate of 3 °C/min, and then held for 30 min. The electron ionization energy of the MS ion source was 70 eV.
GC–MS/MS analyses of saturated fractions were performed on a Trace GC Ultra-TSQ Quantum XLS instrument equipped with a DB-5MS column (30 m × 0.25 mm × 0.25 μm). The mass spectrometer operated in parent ion mode, with argon used as the collision gas at a collision pressure of approximately 0.5 Torr and a collision energy of 10 eV. The GC temperature program was as follows: hold for 1 min at 50 °C, ramp to 100 °C at 20 °C/min, then ramp to 315 °C at 3 °C/min, and hold for 16 min at 315 °C.
4. Results
4.1. TOC and Rock Pyrolysis
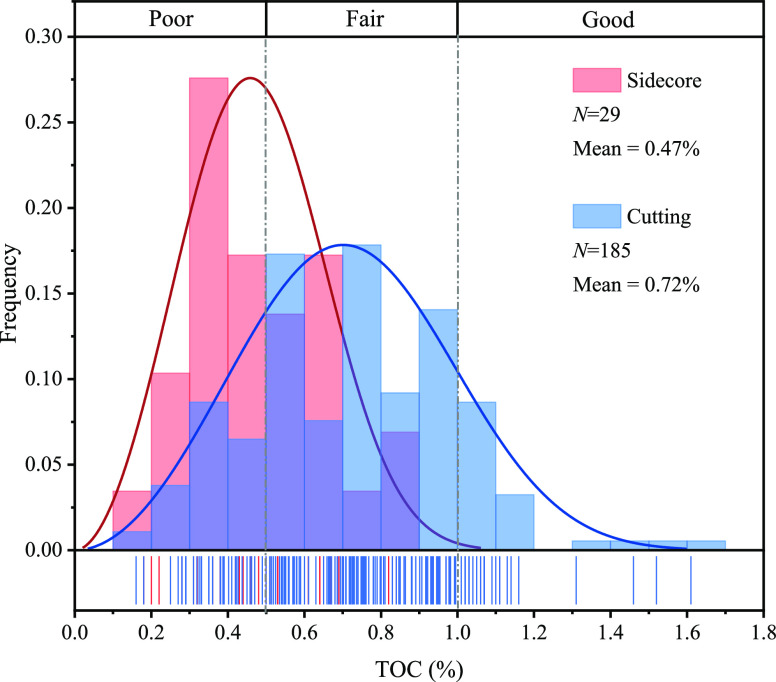
The TOC distribution of shale samples in the study generally ranged from 0.16 to 1.61%, with an average of 0.69%. Overall, the samples were predominantly characterized as poor to fair hydrocarbon source rocks, with a relatively small proportion classified as good hydrocarbon source rocks, according to the enterprise standard Q/HS 1017-2006. There was a certain difference in organic matter abundance between shale sidecore and cutting samples. The average TOC of sidecore samples was 0.47%, with most of them classified as poor source rock. The average TOC of cutting samples was 0.72%, significantly higher than that of sidecores and predominantly categorized as fair source rock (Figure 2).
Figure 2.
TOC distribution of sidecore and cutting samples from seven wells. The fitted curve types are Weibull.
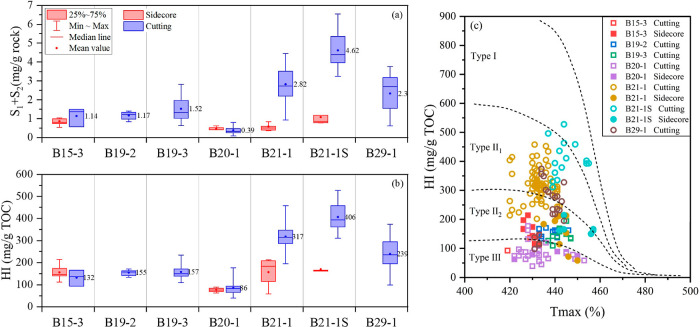
Similar to the TOC, S1 + S2 can also be used to evaluate organic matter abundance. The hydrogen index (HI) is defined as the S2/TOC, which can be used to characterize the oil and gas generation potential. The S1 + S2 values of all shale samples ranged from 0.08 to 6.54 mg/g rock, with an average of 2.02 mg/g rock. The HI ranged from 39 to 528 mg/g of TOC, with an average of 229 mg/g of TOC.
According to Figure 3a,b, for wells using traditional drilling fluids (B15-1, B19-2, B19-3, and B20-1), there was minimal difference between sidecores and cuttings in terms of S1 + S2 and HI values. For wells using HEM drilling fluids (B21-1, B21-1S, and B29-1), the S1 + S2 and HI values of cuttings were noticeably higher than sidecores, but there is not much difference between their sidecores and those from wells using traditional drilling fluids. Figure 3c provides a more intuitive representation of the difference in organic matter types between cuttings and sidecores. The organic matter types of all sidecore and cutting samples from wells using traditional water-based drilling fluids were determined to be types III and II2. However, cuttings from wells using HEM drilling fluids fall within the interval of types II2 to II1. It appears that HEM drilling fluid has optimized the organic matter types of the cutting samples, which contradicts the geological background reported in previous research.15
Figure 3.
(a) S1 + S2 distribution across different wells, (b) distribution characteristics of the HI, and (c) classification of organic matter types. Solid patterns represent sidecores, and hollow patterns represent cuttings. Squares represent normal samples, and circles represent contaminated samples.
4.2. Maceral Composition of Kerogen
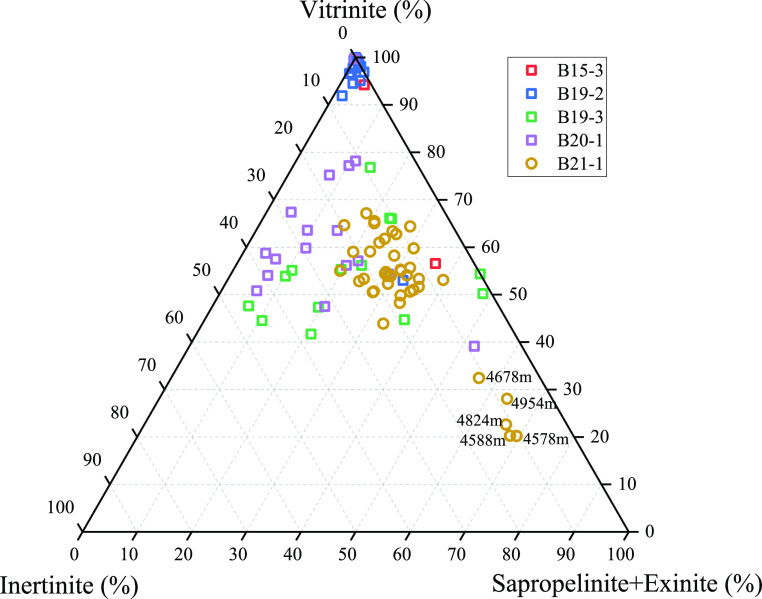
As shown in Figure 4, vitrinite dominated the maceral composition in most samples, ranging from 20.19 to 100%, with an average value at 63.03%. There were significant differences between the organic matter types of cuttings determined by kerogen maceral composition and those classified by rock pyrolysis parameters. It was clear that the majority of cuttings in the Qiongdongnan Basin are determined into III and II2 based on the maceral composition, even in well B21-1(using HEM drilling fluids). It was worth mentioning that in well B21-1, the proportions of sapropelinite + exinite in five samples deposited in neritic facies exceeded 60%, which may be related to their lesser influence by the delta.8
Figure 4.
Maceral triangular chart of marine source rock cuttings in the Qiongdongnan Basin. Squares represent normal samples, and circles represent contaminated samples.
In general, the organic drilling additives had little effect on the kerogen maceral components of the cutting samples; this was because the organic drilling additives would be removed by organic solvents during the preparation of kerogen.
4.3. Saturated Hydrocarbon Biomarkers
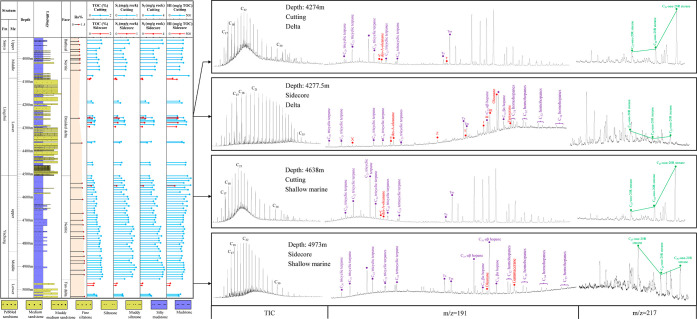
We conducted saturated hydrocarbon biomarker analysis on a total of 104 cuttings and 31 sidecore samples from wells B21-1, B21-1S, and B29-1, which used HEM drilling fluid. Surprisingly, we observed a peculiar phenomenon: entirely different biomarker characteristics between the cuttings and their adjacent sidecores. Moreover, all cutting samples from the depth intervals of 4074−5096 m in well B21-1, 3010−4648 m in well B21-1S, and 3884−5030 m in well B29-1 exhibited identical biomarker characteristics, as presented in Figure 5. This special feature of the m/z 191 mass chromatogram was also observed in the Pearl River Mouth Basin.9
Figure 5.
Well profile and saturated hydrocarbon biomarker characteristics of typical cutting and side-core samples from well B21−1. Note: Compounds I, II, and III are determined into rearranged oleananes,18 compounds X, Y, and Z are terpanes and derived from oleananes.19 Compound T is trans-trans-trans bicadinane.
It seems that the biomarkers in the cuttings have been contaminated by the HEM drilling fluid. In order to compare the differences in biomarkers between the cuttings and sidecores, samples from well B21-1 were chosen as a case study. As shown in Figure 5, cutting samples at 4274 m (delta face) and 4638 m (shallow marine face) deposited in different sedimentary facies exhibited similar biomarker profiles. Precisely, they were characterized by an unimodal distribution pattern of the n-alkane distribution with a main peak n-C21, along with a notable unresolved complex mixture (UCM) evident in the total ion chromatogram (TIC). These cutting samples exhibited well-distributed tricyclic terpanes, but the distribution of hopanoids was particularly unusual, showing four remarkable unknown peaks, which will be further discussed later. The regular steranes are characterized by the high prevalence of C29- to C27 regular steranes, with the C29-ααα-20R sterane peak being notably outstanding. All samples from different sedimentary facies exhibit the same biomarker characteristics, which apparently contradict geological principles.
On the contrary, the biomarkers in sidecore samples from different depths exhibit significant differences, generally corresponding to their sedimentary facies. At a depth of 4277.5 m (delta face), the sidecore sample was characterized by a high level of waxy n-alkanes (reaching up to n-C36), relatively low levels of C23 tricyclicterpane, and high abundances of oleanoids (including oleanane, de-A-oleanane, rearranged oleanane, and XYZ compounds). T-bicadinane and taraxerane were also detected in the m/z 191 mass chromatogram. The signatures of saturated biomarker suggesting that sidecore at 4277.5 m received plenty of terrestrial organic matter, particularly angiosperm materials,16−21 which is consistent with previous scholars.22 The sidecore sample at 4973 m (shallow marine face) showed a relatively high abundance of C23 tricyclicterpanes, gammacerane, and C27 regular steranes, while oleanoids are extremely low. These indicated an important contribution from marine organic matter.23,24
5. Discussions
5.1. Influences of HEM Drilling Fluids on the Organic Matter Abundances and Types
Considering the results of rock pyrolysis from the sidecores (Figure 3c), the kerogen maceral compositions (Figure 4), and previous studies,15,25 the organic matter type in the Qiongdongnan Basin are dominated by type III−II2. As shown in Figures 2 and 3, and the well profile of B21-1, shale cutting samples from wells using HEM drilling fluid appear to be significantly contaminated by organic drilling additives, while sidecore samples are minimally affected. The comparisons in the geochemical profile in Figure 5 clearly reflect the lower TOC, S1, and S2 of the sidecores. The organic drilling additives adhered to the sample surfaces have increased the TOC, S1, and S2 of the cuttings and optimized the types of organic matter.
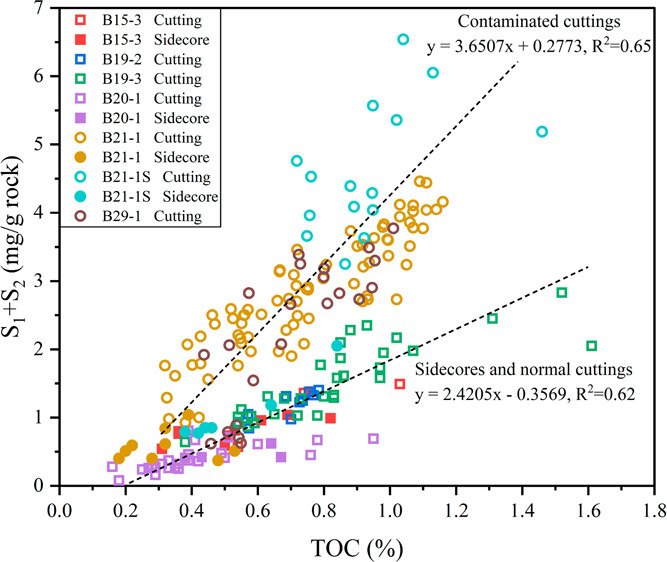
There are two distinct trendlines in Figure 6, which can identify the contaminated cuttings and normal cuttings easily. Sidecore and normal cutting samples share a common lower slope, while contaminated cutting samples exhibit a higher slope. This indicates that the increase in S1 and S2 due to HEM drilling fluids seems to be greater than that of TOC.
Figure 6.
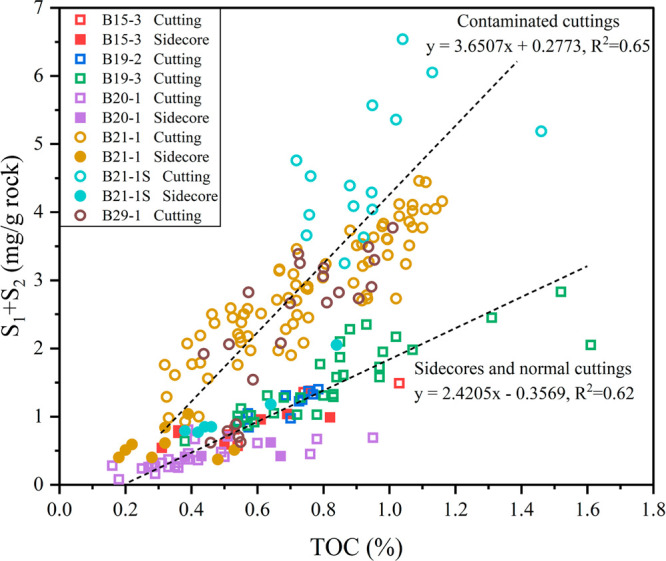
Scatter plot of TOC and S1 + S2 for shale cuttings and sidecores from all seven wells. Solid patterns represent the side-cores, and hollow patterns represent the cuttings. Squares represent normal samples, and circles represent contaminated samples.
The rock pyrolysis spectra clearly reveal contamination in the cuttings of B21-1S. For instance, in Figure 7a, the S1 and S2 peaks of a sidecore at 4610 m display unimodal distributions, with the S2 peak being relatively symmetrical. However, it is obvious that the adjacent cutting sample at 4628 m exhibits double peaks in both S1 and S2, along with a greatly enhanced signal intensity (Figure 7b). By comparison with the core sample at 4610 m, we suggest that the organic drilling additives should be responsible for the second peak of S1 and the first peak of S2.
Figure 7.
Rock pyrolysis primary spectra of the (a) sidecore and (b) contaminated cutting sample.
Recovering accurate rock pyrolysis data from contaminated cuttings is a challenging task. We attempted to split the pyrolysis spectra to determine the actual S1 and S2 values, thereby quantitatively characterizing the extent of contamination in the cuttings. Splitting from the lowest point of coeluted peaks in GC–MS analysis seems to be a common practice for most geochemists, but it is based on the precondition of two peaks being relatively symmetrical. However, due to the irregular nature of rock pyrolysis curves from contaminated samples, as well as the low degree of separation between contaminant peaks and the actual S1 and S2 peaks, splitting based on the lowest point of coeluted peaks (red dash in Figure 7b) may not be appropriate. In fact, this approach may underestimate the influence of contaminant peaks on S1 and S2 after several samples. Finally, we determined to recognize the contaminant peaks as gray areas in Figure 7b. In this method, contaminant peaks in S1 and S2 are relatively symmetrical, and the end time of contaminant peaks was uniformly set at 15 min for comparison. It is important to note that this is just a rough approach for quantifying the degree of contamination, and a more accurate method still deserves further investigation.
The actual S1 (S1-corr), actual S2 (S2-corr), contaminated S1 (S1-cont), and contaminated S2 (S2-cont) peaks are determined through splitting the S1-meas and S2-meas based on their peak areas, which were calculated by the integration tool. The S1-corr and S2-corr are calculated by formulas 1 and 2. S1-meas and S2-meas are measured by a rock pyrolysis analyzer.
| 1 |
| 2 |
| 3 |
| 4 |
The actual TOC (TOCcorr) of contaminated cuttings can be calculated using empirical formula 3, just as previous researchers do. S0 represents the gaseous hydrocarbon remaining in the cutting samples, which is usually difficult to detect due to its high volatility. S4 represents dead carbon at a high pyrolysis temperature, largely unaffected by organic drilling additives. In accordance with formula 3, we utilize formula 4 to calculate the TOCcorr of contaminated cutting samples. The TOCmeas in formula 4 represents the TOC of contaminated cutting measured by the CS744 analyzer.
The actual S1, S2, and TOC of a total of 15 contaminated cutting samples from well B21-1S are corrected through formulas 1–3. The results presented in Table 1 indicate that contamination from organic drilling additives significantly increased the TOC and rock pyrolysis parameters. Accurately, the TOC increased by 19.6–40.2%, with an average of 28.5 ± 6.1%; S1 increased by 87.4–96.1%, with an average of 90.8 ± 2.0%; S2 increased by 30.9–38.8%, with an average of 34.2 ± 2.0%; HI increased by 45.2–56.5%, with an average of 51.9 ± 4.0%.
Table 1. Measured and Corrected Data of TOC and Rock Pyrolysis Parameters of Samples from Well B21-1Sa.
| well name | depth (m) | sample type | Tmax (°C) | measured data |
organic additive
contribution |
actual data |
|||||||
|---|---|---|---|---|---|---|---|---|---|---|---|---|---|
| S1-meas (mg/g rock) | S2-meas (mg/g rock) | TOCmeas (%) | HImeas (mg/g TOC) | S1-cont (mg/g rock) | S2-cont (mg/g rock) | S1-corr (mg/g rock) | S2-corr (mg/g rock) | TOCcorr (%) | HIcorr (mg/g TOC) | ||||
| B21-1S | 4038 | sidecore | 444 | 0.25 | 1.8 | 0.84 | 214 | ||||||
| B21-1S | 4137 | sidecore | 442 | 0.09 | 0.68 | 0.42 | 162 | ||||||
| B21-1S | 4160 | sidecore | 444 | 0.09 | 0.76 | 0.46 | 165 | ||||||
| B21-1S | 4525 | sidecore | 456 | 0.22 | 0.96 | 0.64 | 150 | ||||||
| B21-1S | 4610 | sidecore | 457 | 0.16 | 0.63 | 0.38 | 166 | ||||||
| B21-1S | 4630 | sidecore | 457 | 0.14 | 0.71 | 0.44 | 161 | ||||||
| B21-1S | 3490 | cutting | 437 | 1.38 | 5.16 | 1.04 | 496 | 1.16 | 3.35 | 0.13 | 1.81 | 0.67 | 272 |
| B21-1S | 3520 | cutting | 439 | 0.39 | 2.86 | 0.864 | 331 | 0.19 | 1.85 | 0.02 | 1.01 | 0.69 | 145 |
| B21-1S | 3568 | cutting | 439 | 0.65 | 4.54 | 1.46 | 311 | 0.49 | 2.95 | 0.05 | 1.59 | 1.17 | 135 |
| B21-1S | 3638 | cutting | 440 | 0.58 | 3.51 | 0.891 | 394 | 0.46 | 2.28 | 0.06 | 1.23 | 0.66 | 185 |
| B21-1S | 3700 | cutting | 440 | 0.62 | 3.42 | 0.948 | 361 | 0.51 | 2.25 | 0.06 | 1.17 | 0.72 | 163 |
| B21-1S | 3792 | cutting | 441 | 0.54 | 3.09 | 0.922 | 335 | 0.40 | 2.04 | 0.04 | 1.05 | 0.72 | 146 |
| B21-1S | 3912 | cutting | 442 | 0.66 | 3.3 | 0.757 | 436 | 0.54 | 2.02 | 0.06 | 1.28 | 0.54 | 235 |
| B21-1S | 4086 | cutting | 443 | 0.71 | 3.58 | 0.946 | 378 | 0.56 | 2.33 | 0.06 | 1.25 | 0.71 | 177 |
| B21-1S | 4148 | cutting | 444 | 0.97 | 3.79 | 0.718 | 528 | 0.91 | 2.57 | 0.12 | 1.22 | 0.43 | 284 |
| B21-1S | 4274 | cutting | 444 | 1.18 | 4.39 | 0.948 | 463 | 0.92 | 2.86 | 0.11 | 1.53 | 0.63 | 241 |
| B21-1S | 4326 | cutting | 445 | 1.41 | 4.64 | 1.13 | 411 | 1.17 | 3.02 | 0.16 | 1.62 | 0.78 | 207 |
| B21-1S | 4424 | cutting | 449 | 1.04 | 3.49 | 0.761 | 459 | 0.89 | 2.41 | 0.12 | 1.08 | 0.49 | 222 |
| B21-1S | 4552 | cutting | 454 | 1.26 | 4.1 | 1.02 | 402 | 1.04 | 2.83 | 0.13 | 1.27 | 0.70 | 182 |
| B21-1S | 4628 | cutting | 454 | 0.72 | 2.94 | 0.749 | 393 | 0.54 | 2.00 | 0.07 | 0.94 | 0.54 | 175 |
| B21-1S | 4648 | cutting | 455 | 0.93 | 3.46 | 0.88 | 393 | 0.70 | 2.25 | 0.08 | 1.21 | 0.64 | 191 |
The effectiveness of our correction results can be evaluated by comparing them with the sidecore samples. According to Figure 8, based on the measured pyrolysis data, the organic matter type of most cuttings from well B21-1S is classified as type II1 to I, which obviously does not match the geological background of type III to II2 in the Qiongdongnan Basin.15,25 After our correction, the sample points of the contaminated cuttings regress to type III to II2, which parallels with the associated sidecores, indicating the reliability of our correction method.
Figure 8.
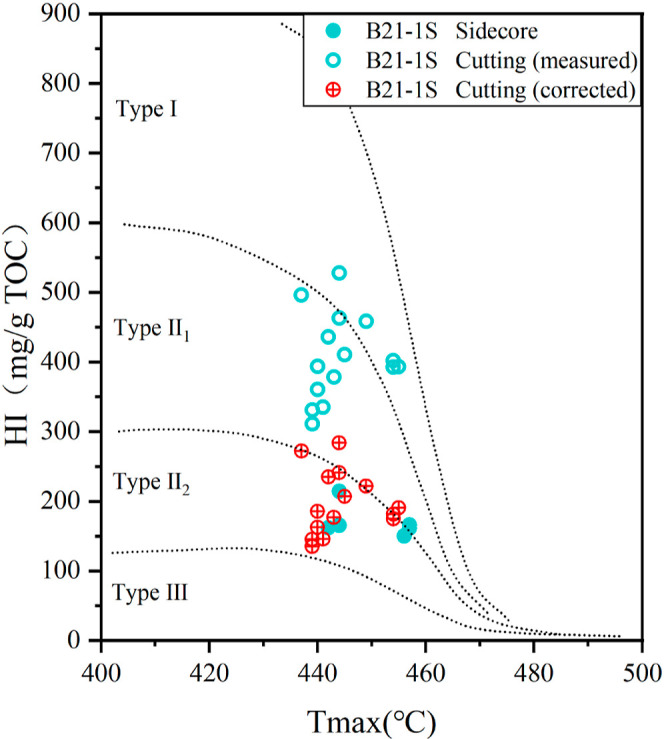
Comparison of organic matter type determined by rock pyrolysis data of sidecores, cuttings (measured), and cuttings (corrected) from well B21-1S.
5.2. Influences on Steroids
Figure 5 depicts anomalies biomarker characteristics in the cuttings, which may be related to two factors theoretically: the true nature of the shales or contamination during the drilling process.
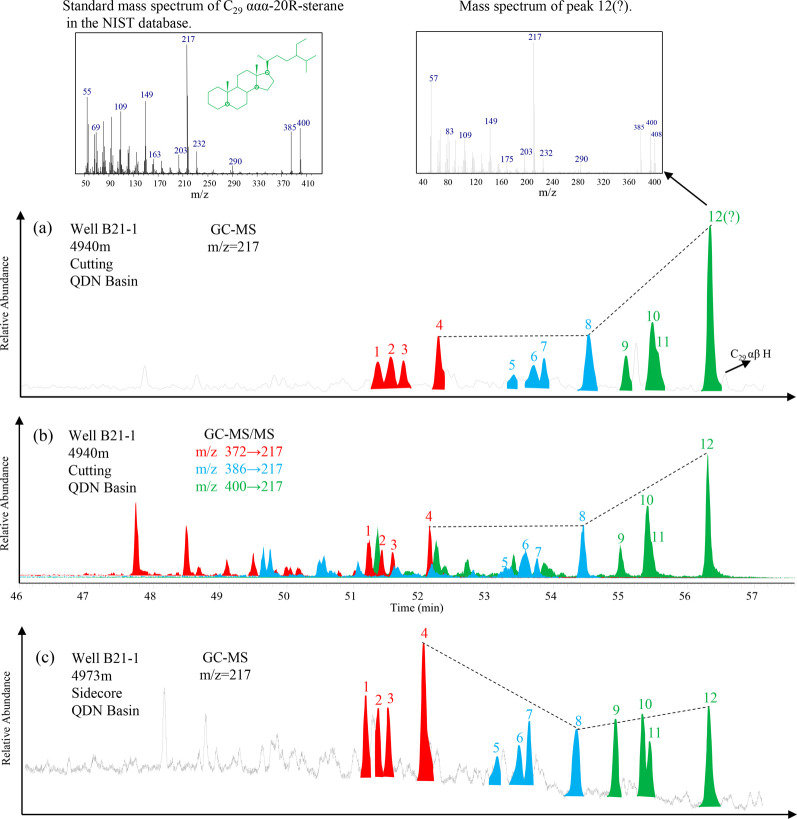
The C29/C27 regular steranes from the cutting sample at 4940 m of well B21−1 are 1.95, with a remarkable level of C29-ααα-20R-sterane (Figure 9a). This distribution pattern of regular steranes typically indicates the terrestrial higher plant inputs.23 However, the adjacent sidecore at 4973 m exhibited a slight prevalence pattern of C27- over C29 regular steranes (Figure 9c), with a C29/C27 regular sterane value at 0.98, indicating an increasing contribution from the aquatic organisms. Furthermore, as mentioned earlier, all cuttings from the depth interval of 4074−5096 m in well B21-1 exhibit the same biomarker characteristics, which is inconsistent with the basic geological background. Sidecore samples have a greater advantage in characterizing the true nature of geological samples when using HEM drilling fluid. Therefore, we suggest that the anomalous sterane pattern in the cutting samples is caused by organic drilling additives rather than the true nature of the source rocks. More reliable evidence can be found from the mass spectrum. According to Figure 9, the mass spectrum of peak 12 in the contaminated cutting sample differs from the standard mass spectrum of C29-ααα-20R-sterane, indicating that peak 12 does not consist solely of C29-ααα-20R-sterane. The molecular ion of peak 12 is m/z 408 rather than m/z 400 as in the standard mass spectrum. Although GC-MS-MS is an effective method for separating coeluting compounds, it also cannot completely eliminate the influence of organic drilling additives on C29 regular steranes (Figure 9b).
Figure 9.
Comparison of steranes feature between contaminated cutting (a,b are the GC–MS and GC–MS/MS results of the same cutting, respectively) and (c) adjacent sidecore samples. Note: Peak 1 to 12 are C27-ααα-20S-sterane, C27-αββ-20R-sterane, C27-αββ-20S-sterane, and C27-ααα-20R-sterane, C28-ααα-20S-sterane, C28-αββ-20R-sterane, C28-αββ-20S-sterane, and C28-ααα-20R-sterane, C29-ααα-20S-sterane, C29-αββ-20R-sterane, C29-αββ-20S-sterane, and C29-ααα-20R-sterane, respectively.
5.3. Influences on Hopanoids
The abnormally high peaks observed on the m/z 191 mass chromatogram are identified as Ts, C27 α H (Tm), C27 β H, C29−31 αβ H, and C27−31 βα H series by restricting retention times and comparing with standard mass spectra (Figure 10). Similar to steroids, these hopaniods may also originate from source rocks or organic drilling additives; their actual origins will be discussed below.
Figure 10.
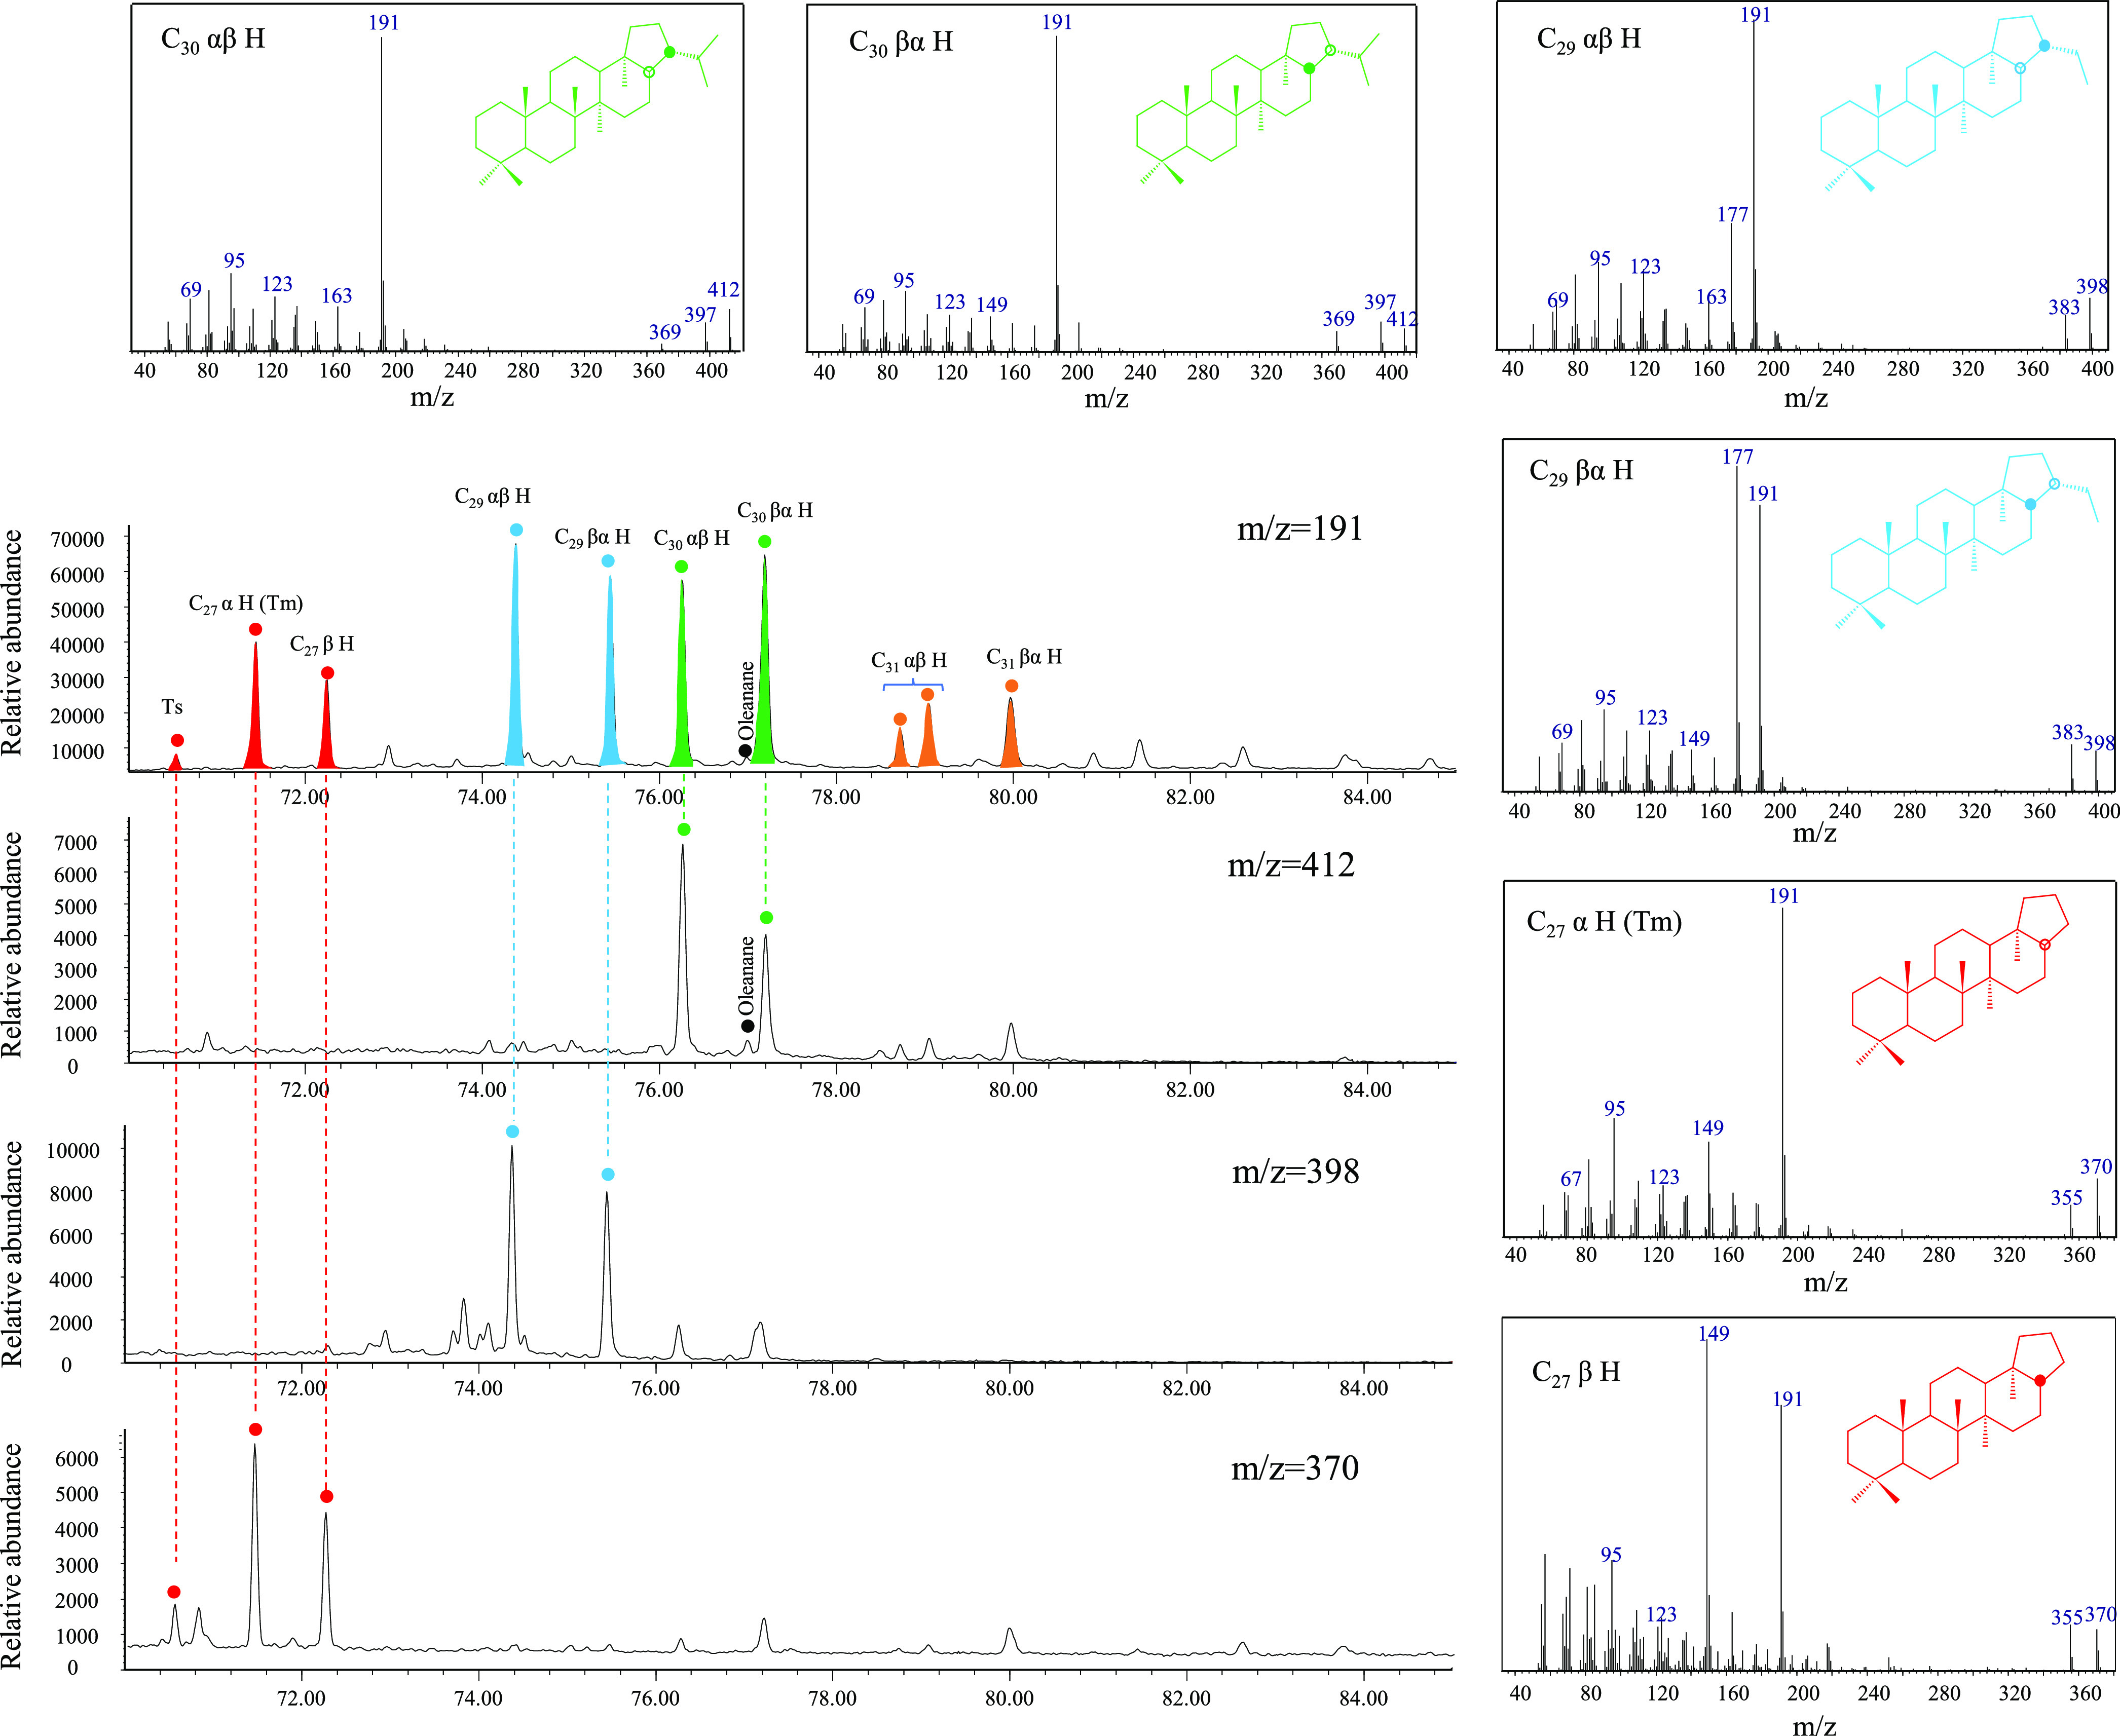
Partial mass chromatograms and mass spectrum of the hopane series of the cutting sample at 4940 m in well B21-1. Note: Ts = 18α (H) -22, 29, 30-trisnorneohopane; C27 α H = 17α (H) -22, 29, 30-trisnorhopane; C27 β H = 17β (H) -22, 29, 30-trisnorhopane; C29 αβ H = 17α (H), 21β (H) norhopane; C29 βα H = 17β (H), 21α (H) norhopane; C30 αβ H = 17α (H), 21β (H) hopane; C30 βα H = 17β (H), 21α (H) hopane; C31 αβ H = 17α (H), 21β (H) homohopane; C31 βα H = 17β (H), 21α (H) homohopane.
Both Ts and Tm are commonly detected in the petroleum system, and their relative abundance is an effective thermal maturity indicator.26 Cutting samples from the contaminated depth interval of well B21-1 show unusually low Ts/(Ts + Tm) values that are inconsistent with the measured vitrinite reflectance (0.8–1.2% Ro, Figure 5). It is noteworthy that Ts/(Ts + Tm) appears to be sensitive to clay-catalyzed reactions and carbonate source rocks.27 However, the absence of carbonate hydrocarbon source rocks in the Qiongdongdong Basin suggests that lithology should not be responsible for a high level of Tm. Similarly, the outstanding C29 αβ H are not associated with lithology as they are commonly observed in carbonatite-evaporite sediments.28,29 C27 β H has seldom been reported in petroleum systems in the past; its identification relies on the mass spectrum, where the intensity of the m/z 149 ion fragment exceeding that of m/z 191 indicates the β-hydrogen at the carbon position 17; otherwise, it is an α-hydrogen.30 Burhan (2002) detected C27 β H in sulfur biogenic mats associated with the Be’eri sulfur mine in Israel. It was suggested that C27 β H originated from methanotrophic bacteria and acidophilic archaea thriving in extreme environments. Clearly, the oxidized geological background of the Qiongdongnan Basin is entirely different from that of the Be’eri sulfur mine.31 Therefore, it is unlikely that the high abundance of C27 β H originates from the source rocks. C30 αβ H can be detected in almost all sediments due to the ubiquity of bacteria in the biosphere.32 However, the abundance of C30 αβ H appears to be significantly enhanced since they overshadow the adjacent oleanane in all cutting samples (Figures 5 and 10). The high content of C30 βα H is typically associated with low maturity; it is obvious that the abundance of C30 βα H in the cutting sample does not match its maturity level.
Based on the comprehensive analysis of the geological background, it was concluded that the high abundance of C27 α H (Tm), C27 β H, C29−31 αβ H, and C27−31 βα H is unlikely to originate from source rocks. Instead, it is more likely attributable to components present in organic drilling additives, just like C29 regular steranes.
6. Conclusions
The influence of HEM drilling fluid on the TOC, rock pyrolysis parameters, and saturated hydrocarbon biomarkers of cutting samples in the Qiongdongnan Basin is significant but minor for sidecore samples. We developed the TOC − (S1 + S2) plot to identify the contaminated cutting samples easily based on two trendlines. The organic geochemical data of contaminated cuttings can be corrected by splitting the contaminant peak area in the rock pyrolysis spectra, allowing for a quantitative assessment of the contributions of contaminants to the S1, S2, and TOC of the cuttings. It is evident that the organic drilling additives can increase the organic matter abundance and optimize the organic matter types of the cuttings. Specifically, the TOC increased by 28.5 ± 6.1%, S1 increased by 90.8 ± 2.0%, S2 increased by 34.2 ± 2.0%, and HI increased by 51.9 ± 4.0%. The saturated hydrocarbon biomarkers are also profoundly affected by the HEM drilling fluid. At first, organic drilling additives produce a UCM on the baseline of the TIC and then greatly enhance the abundance of C29 regular steranes, particularly C29-ααα-20R sterane, with the influence still persisting even when conducting GC-MS-MS analysis. Moreover, the anomalous m/z 191 mass chromatograms of cuttings also indicate the presence of contaminants, as highly abundant C27 α H (Tm), C27 β H, C29−31 αβ H, and C29−31 βα H may directly originate from the organic drilling additives.
Acknowledgments
This project was funded by the National Natural Science Foundation of China (grant no. 42302189).
The authors declare no competing financial interest.
References
- Sun J.; Jiang G.; He Y.; Shi H.; Du M.; Dong T.; Yang L. Technical difficulties and challenges faced by oil-based drilling fluid. J. China Univ. Pet., Ed. Nat. Sci. 2023, 47 (5), 76–89. [Google Scholar]
- Abduo M. I.; Dahab A. S.; Abuseda H.; AbdulAziz A. M.; Elhossieny M. S. Comparative study of using Water-Based mud containing Multiwall Carbon Nanotubes versus Oil-Based mud in HPHT fields. Egypt. J. Pet. 2016, 25 (4), 459–464. 10.1016/j.ejpe.2015.10.008. [DOI] [Google Scholar]
- Aftab A.; Ismail A. R.; Khokhar S.; Ibupoto Z. H. Novel zinc oxide nanoparticles deposited acrylamide composite used for enhancing the performance of water-based drilling fluids at elevated temperature conditions. J. Pet. Sci. Eng. 2016, 146, 1142–1157. 10.1016/j.petrol.2016.08.014. [DOI] [Google Scholar]
- Oseh J. O.; Mohd N. M. N. A.; Gbadamosi A. O.; Agi A.; Blkoor S. O.; Ismail I.; Igwilo K. C.; Igbafe A. I. Polymer nanocomposites application in drilling fluids: A review. Geoenergy Sci. Eng. 2023, 222, 211416. 10.1016/j.geoen.2023.211416. [DOI] [Google Scholar]
- Echt T.; Stoxreiter T.; Plank J. Impact of the drilling fluid system on the effectiveness of a high pressure jetting assisted rotary drilling system. Heliyon. 2020, 6 (6), e04179 10.1016/j.heliyon.2020.e04179. [DOI] [PMC free article] [PubMed] [Google Scholar]
- Zhu T. Y.; Dai X. D.; Ai F. Design of drilling fluid of high temperature and high pressure resistance in well drilling of deepwater area. J. Coastal Res. 2019, 83, 62–67. 10.2112/SI83-011.1. [DOI] [Google Scholar]
- Luo J.; Li Z.; Liu G.; Li H.; Guo L.; Geng T. Practical application of HEM polyamine fluid for deepwater drilling in South China Sea. Oil Drill. Prod. Technol. 2015, 37 (1), 119–120. [Google Scholar]
- Xu C. G.; Deng Y.; Wu K. Q.; You L. Discovery and geological significance of the large gas field Baodao 21−1 in a passive epicontinental basin with strong activity in the northern South China Sea. Acta Petrolei. Sinica. 2023, 44 (5), 713–728. 10.7623/syxb202305001. [DOI] [Google Scholar]
- Yuan L.; Jiang W.; Li Y.; Lei R.; Cheng B.; Wu L.; Xiong Y. Reconstruction of geochemical characteristics of original organic matter in drilling cuttings contaminated by oil-based mud. Mar. Petrol. Geol. 2022, 143, 105817. 10.1016/j.marpetgeo.2022.105817. [DOI] [Google Scholar]
- Hutchison C. S. Marginal basin evolution: the southern South China Sea. Mar. Petrol. Geol. 2004, 21 (9), 1129–1148. 10.1016/j.marpetgeo.2004.07.002. [DOI] [Google Scholar]
- Zhu W. L.; Huang B. J.; Mi L. J.; Wilkins R. W. T.; Fu N.; Xiao X. Geochemistry, origin, and deep-water exploration potential of natural gases in the Pearl River Mouth and Qiongdongnan basins, South China Sea. AAPG Bull. 2009, 93 (6), 741–761. 10.1306/02170908099. [DOI] [Google Scholar]
- Shi W.; Xie Y.; Wang Z.; Li X.; Tong C. Characteristics of overpressure distribution and its implication for hydrocarbon exploration in the Qiongdongnan Basin. J. Asian Earth Sci. 2013, 66, 150–165. 10.1016/j.jseaes.2012.12.037. [DOI] [Google Scholar]
- Wang D. D.; Dong G. Q.; Zhang G. C.; Li Z. X.; Mao Q.; Song G. Z. Coal seam development characteristics and distribution predictions in marginal sea basins: Oligocene Yacheng Formation coal measures, Qiongdongnan Basin, northern region of the South China Sea. Aust. J. Earth Sci. 2020, 67 (3), 393–409. 10.1080/08120099.2019.1661286. [DOI] [Google Scholar]
- Zhu W. L.; Shi H. S.; Huang B. J.; Zhong K.; Huang Y. Geology and geochemistry of large gas fields in the deepwater areas, continental margin basins of northern South China Sea. Mar. Petrol. Geol. 2021, 126, 104901. 10.1016/j.marpetgeo.2021.104901. [DOI] [Google Scholar]
- Huang B. J.; Tian H.; Li X. S.; Wang Z. F.; Xiao X. M. Geochemistry, origin and accumulation of natural gases in the deepwater area of the Qiongdongnan Basin, South China Sea. Mar. Petrol. Geol. 2016, 72, 254–267. 10.1016/j.marpetgeo.2016.02.007. [DOI] [Google Scholar]
- Woodhouse A.; Oung J. N.; Philp R. P.; Weston R. J. Triterpanes and Ring-a Degraded Triterpanes as Biomarkers Characteristic of Tertiary Oils Derived from Predominantly Higher-Plant Sources. Org. Geochem. 1992, 18 (1), 23–31. 10.1016/0146-6380(92)90140-s. [DOI] [Google Scholar]
- Moldowan J. M.; Dahl J.; Huizinga B. J.; Fago F. J.; Hickey L. J.; Peakman T. M.; Taylor D. W. The molecular fossil record of oleanane and Its relation to angiosperms. Science 1994, 265 (5173), 768–771. 10.1126/science.265.5173.768. [DOI] [PubMed] [Google Scholar]
- Nytoft H. P.; Kildahl-Andersen G.; Samuel O. J. Rearranged oleananes: Structural identification and distribution in a worldwide set of Late Cretaceous/Tertiary oils. Org. Geochem. 2010, 41 (10), 1104–1118. 10.1016/j.orggeochem.2010.06.008. [DOI] [Google Scholar]
- Samuel O. J.; Kildahl-Andersen G.; Nytoft H. P.; Johansen J. E.; Jones M. Novel tricyclic and tetracyclic terpanes in Tertiary deltaic oils: Structural identification, origin and application to petroleum correlation. Org. Geochem. 2010, 41 (12), 1326–1337. 10.1016/j.orggeochem.2010.10.002. [DOI] [Google Scholar]
- Aarssen B. G. K. v.; Cox H. C.; Hoogendoorn P.; Leeuw J. W. d. A cadinene biopolymer in fossil and extant dammar resins as a source for cadinanes and bicadinanes in crude oils from South East Asia. Geochim. Cosmochim. Acta 1990, 54 (11), 3021–3031. 10.1016/0016-7037(90)90119-6. [DOI] [Google Scholar]
- Versteegh G. J. M.; Schefuß E.; Dupont L.; Marret F.; Sinninghe Damsté J. S.; Jansen J. H. F. Taraxerol and Rhizophora pollen as proxies for tracking past mangrove ecosystems. Geochim. Cosmochim. Acta 2004, 68 (3), 411–422. 10.1016/S0016-7037(03)00456-3. [DOI] [Google Scholar]
- Ding W.; Li Y.; Lei L.; Li L.; Yang S.; Yang Y.; Hou D. Biomarkers reveal the terrigenous organic matter enrichment in the late Oligocene-early Miocene marine shales in the Ying-Qiong Basin, South China Sea. Acta Oceanol. Sin. 2023, 42 (3), 31–53. 10.1007/s13131-022-2081-6. [DOI] [Google Scholar]
- Huang W. Y.; Meinschein W. G. Sterols as ecological indicators. Geochim. Cosmochim. Acta 1979, 43, 739–745. 10.1016/0016-7037(79)90257-6. [DOI] [Google Scholar]
- Azevedo D. A.; Neto F. R. A.; Simoneit B. R. T.; Pinto A. C. Novel series of tricyclic aromatic terpanes characterized in Tasmanian tasmanite. Org. Geochem. 1992, 18 (1), 9–16. 10.1016/0146-6380(92)90138-n. [DOI] [Google Scholar]
- Wu P.; Hou D.; Gan J.; Li X.; Ding W.; Liang G.; Wu B. Paleoenvironment and controlling factors of Oligocene source rock in the eastern deep-water area of the Qiongdongnan Basin: evidences from organic geochemistry and palynology. Energy Fuels 2018, 32 (7), 7423–7437. 10.1021/acs.energyfuels.8b01190. [DOI] [Google Scholar]
- Moldowan J. M.; Sundararaman P.; Schoell M. Sensitivity of biomarker properties to depositional environment andor source input in the Lower Toarcian of SW-Germany. Org. Geochem. 1986, 10, 915–926. 10.1016/S0146-6380(86)80029-8. [DOI] [Google Scholar]
- Rullkotter J.; Spiro B.; Nissenbaum A. Biological marker characteristics of oils and asphalts from carbonate source rocks in a rapidly subsiding Graben, Dead-Sea, Israel. Geochim. Cosmochim. Acta 1985, 49 (6), 1357–1370. 10.1016/0016-7037(85)90286-8. [DOI] [Google Scholar]
- Connan J.; Bouroullec J.; Dessort D.; Albrecht P. The microbial input in carbonate-anhydrite facies of a sabkha palaeoenvironment from Guatemala: A molecular approach. Org. Geochem. 1986, 10, 29–50. 10.1016/0146-6380(86)90007-0. [DOI] [Google Scholar]
- Clark J. P.; Philp R. P. Geochemical characterization of evaporite and carbonate depositional environments and correlation of associated crude oils in the Black Creek basin, Alberta. B. Can. Petrol. Geol. 1989, 37 (4), 401–416. 10.35767/gscpgbull.37.4.401. [DOI] [Google Scholar]
- Seifert W. K.; Moldowan J. M. The effect of thermal stress on source-rock quality as measured by hopane stereochemistry. Phys. Chem. Earth. 1980, 12, 229–237. 10.1016/0079-1946(79)90107-1. [DOI] [Google Scholar]
- Burhan R. Y. P.; Trendel J. M.; Adam P.; Wehrung P.; Albrecht P.; Nissenbaum A. Fossil bacterial ecosystem at methane seeps: Origin of organic matter from Be’eri sulfur deposit, Israel. Geochim. Cosmochim. Acta 2002, 66 (23), 4085–4101. 10.1016/S0016-7037(02)00979-1. [DOI] [Google Scholar]
- Ourisson G.; Albrecht P.; Rohmer M. The hopanoids: palaeochemistry and biochemistry of a group of natural products. Pure Appl. Chem. 1979, 51, 709–729. 10.1351/pac197951040709. [DOI] [Google Scholar]


