Abstract
Background
In a critically ill patient, when an arterial blood sample is processed on an arterial blood gas (ABG) analyzer, it also measures electrolytes apart from analyzing the blood gases. The turnaround time for ABG analysis is way too less compared to the conventional electrolyte analysis with a serum sample.
Objective
This study intends to investigate whether values of electrolytes estimated in arterial blood can substitute the routinely practiced method.
Materials and methods
This is a retrospective cross-sectional study. The source of data is patients’ reports of serum electrolytes and ABG analysis from the Clinical Biochemistry laboratory, CIMS Teaching Hospital, Chamarajanagar between January and June 2021. The electrolytes report of 200 patients from whom both arterial and venous blood samples were sent to the Clinical Biochemistry laboratory on the same day and at the same time for analysis were selected. The data was compiled, compared, and correlated using a suitable statistical tool.
Results
The mean and standard deviation of sodium (135.62 ± 5.20 in venous vs 134.08 ± 8.49 in arterial blood), potassium (4.20 ± 0.64 vs 3.80 ± 0.75), and chloride (102.28 ± 4.99 vs 96.33 ± 8.11) were observed. However, when the concordance correlation coefficient and Bland-Altman plot analysis were made there was no agreement between electrolytes analyzed on serum in an autoanalyzer with that of ABG analyzer.
Conclusion
We conclude that the electrolytes measured by a conventional autoanalyzer on a serum sample cannot be replaced by values analyzed on a blood gas analyzer.
How to cite this article
Devaki RN, Kasargod P, Roopa Urs AN, Chandrika N. A Retrospective Database Analysis to Investigate if Electrolytes in Venous Blood are Equivalent to the Levels in Arterial Blood. Indian J Crit Care Med 2024;28(5):442–446.
Keywords: Chloride, Laboratory research, Potassium, Sodium, Turnaround time
Clinical Significance/Highlights
We retrieved data of 200 patients admitted to the intensive care unit (ICU), from whom venous and arterial blood samples were drawn at the same time and analyzed for electrolytes on two separate analyzers. There was no agreement between the reports. Pre-analytical variables restrict the use of arterial blood gas (ABG) analyzer-derived electrolyte values for intervention.
Introduction
Electrolytes are elements or minerals which when dissolved in water dissociate to carry charge.1 Sodium, calcium, potassium, phosphorus, chloride, and magnesium are a few of the many electrolytes found in our body. These electrolytes are involved in an array of functions in the human body such as muscle contraction, nerve impulse generation, maintenance of osmotic balance, and endocrine and excretory system regulation. They are vital for normal growth, development, and maintenance of health.2
Electrolyte imbalance can be encountered in individuals affected by common ailments like diarrhea-vomiting and also in seriously ill patients admitted to ICU. Irrespective of the scenario, timely detection and correction of electrolyte imbalance is mandatory for life to sustain.3 Assessment of electrolyte status is one of the baseline investigations in critically ill patients. The laboratory decision tree early warning score (LDT-EWS) which has been developed to predict patient outcomes after ICU admission and in-hospital mortality includes analysis of hemoglobin, urea, creatinine, sodium, potassium, and albumin in patients at the time of induction to ICU.4 This emphasizes the importance of the fact that early detection and rectification of electrolyte imbalance can be lifesaving.
Sodium, potassium, and chloride are the routinely measured electrolytes in day-to-day laboratory practice. These electrolytes are conventionally measured in serum derived from a venous blood sample of an individual in a clinical biochemistry laboratory by ion selective electrode (ISE) method.5 However, it is also possible to acquire values of sodium, potassium, chloride, and calcium in an arterial blood sample when processed on an ABG analyzer.6 This has become feasible ever since the electrodes for electrolyte measurement have been incorporated into the new generation ABG analyzers. Arterial blood gas analysis is a crucial biochemical investigation done in critically ill patients. As the name suggests ABG analysis is primarily done to assess blood gas levels and assess acid-base imbalance in an individual. The turn-around time (TAT) for ABG analysis is 10–15 minutes.7 The TAT for serum electrolytes estimation is anywhere up to one and a half hours.8
These facts intrigued us to explore the possibility of substituting electrolyte levels estimated in a venous blood sample with the values measured on an ABG analyzer in critically ill patients. There have been many similar studies earlier, however the outcome is indecisive.9,10 The ABG report is immediately available aiding in timely intervention. Furthermore, the patient can be spared of giving an additional blood sample for venous blood electrolyte analysis and paying for the same. Thus, we stepped in to investigate whether the electrolytes analyzed on the blood gas analyzer were in concordance with the levels measured on the electrolyte autoanalyzer (AA), so that the methods could be used interchangeably. This is the objective of our study.
Materials and Methods
This is a retrospective cross-sectional study. The research was conducted in the Clinical Biochemistry laboratory of Chamarajanagar Institute of Medical Sciences Teaching Hospital, Chamarajanagar, Karnataka, India. The Institutional Ethics Committee approval (Letter no: IEC Ref no: CIMS/IEC-03/02/2022, dated,13/07/2022) was obtained before the commencement of the study. The research project involved the retrieval of biochemical investigation reports from the Hospital Information System (e-Hospital portal) of patients admitted to the ICU of the hospital between January 2021 and June 2021. These patients who were admitted during this period of the year were those being treated for SARS-CoV-2 infection in the intensive care unit. Thus, the blood samples are those of critically ill COVID patients The data inclusion was made irrespective of the age and gender of the patient. The next important step was to scrutinize thoroughly and incorporate the biochemical investigation reports of only those patients whose arterial blood sample was sent for ABG analysis and a venous blood sample was sent for electrolyte analysis on the same day and between an interval of not more than twenty minutes. We could thus get access to two hundred such patient reports who met our unambiguous inclusion criteria. Two hundred is also the sample size required to endorse the power of study based on local population size. Yamane equation was used to calculate and derive the sample size in the current study.11
The analysis of electrolytes in the venous blood samples involved the collection of 3 mL of a venous blood sample under aseptic precautions in a plain non-vacuum evacuated tube from the patient admitted in the ICU and the sample would be transported to the clinical biochemistry laboratory immediately. Here, after 20 minutes, when the sample would clot, it would be centrifuged and the serum-derived was aspirated into Roche 9180 electrolyte analyzer, which processed electrolytes: Sodium, potassium, and chloride based on direct ISE principle.12 This instrument is programmed for auto-calibration every fourth hour and quality control (one level) serum was run every day to ensure dispatch of accurate reports.
The ABG analysis involved the collection of a 2 mL arterial blood sample from the patient in the ICU in a heparinized syringe under all aseptic precautions. The syringe would be sealed and immediately sent to the clinical biochemistry laboratory for processing. The sample was at once processed on a radiometer ABL Flex 80 ABG analyzer, which has the provision to measure sodium, potassium, and chloride in the fed arterial blood sample also by direct ISE principle.13
The reliability of the data retrieved for the present project is ensured as the standard protocol was followed during the collection, processing, and dispatch of serum electrolytes as well as ABG reports of every patient in the institute.
The electrolyte values of two hundred ICU patients processed on two types of blood samples (venous and arterial) and on two separate analyzers on the same day and at the same time were meticulously collected, and compiled for a detailed statistical analysis.
Statistical Analysis
The data was compiled on a Microsoft Excel sheet. The electrolyte values were presented using descriptive statistics like mean and standard deviation. Paired ‘t’ tests were used to compare the electrolytes in the two different samples, p-value of < 0.05 was considered statistically significant. Arterial and venous blood electrolyte levels were correlated using Pearson's correlation. Concordance Correlation coefficient (CCC) was used to look for agreement between electrolyte values analyzed on an AA and ABG analyzer. The results were reported at 95% confidence intervals. The consensus between the electrolyte values analyzed on a venous and arterial sample was also assessed using Bland‐Altman plot analysis.
Results
The mean age of the two hundred subjects whose laboratory reports were analyzed was 52.87 years. Of the 200, there were 77 females and 123 males.
In Table 1, we can observe that there is a statistically significant difference between the values of electrolytes analyzed on an AA and ABG analyzer. Table 2 represents Pearson's correlation analysis between mean ± SD of venous and arterial sodium, potassium, and chloride. We have observed a positive and statistically significant correlation.
Table 1.
Comparison of mean ± SD between AA and ABG analyzer measured electrolytes
| Biochemical parameter | Mean ± SD of autoanalyzer (venous sample) measured values | Mean ± SD of blood gas analyzer (arterial sample) measured values | p-value |
|---|---|---|---|
| Sodium (mmoL/L) | 135.6 ± 5.2 | 134.08 ± 8.4 | 0.02 |
| Potassium (mmoL/L) | 4.20 ± 0.64 | 3.80 ± 0.75 | <0.0001 |
| Chloride (mmoL/L) | 102.28 ± 4.99 | 96.33 ± 8.11 | <0.0001 |
Table 2.
Pearson's correlation between electrolytes analyzed on AA and arterial blood ABG analyzer
| Correlation analysis | r-value | p-value |
|---|---|---|
| Arterial Na+ vs venous Na+ | 0.439 | <0.0001 |
| Arterial K+ vs venous K+ | 0.517 | <0.0001 |
| Arterial Cl− vs venous Cl− | 0.474 | <0.0001 |
The concordance correlation coefficient is a valid statistical tool used in this study to interpret the agreement between electrolytes estimation in the same person but on two different analyzers. In all the comparisons made between arterial sodium (Ar Na) and venous sodium (Vn Na) (Fig. 1); arterial potassium (Ar K) and venous potassium (Vn K) (Fig. 2); and arterial chloride (Ar Cl) vs venous chloride levels (Vn Cl) (Fig. 3) (strength of agreement) concordance correlation coefficient is poor as it < 0.90 (Table 3).
Fig. 1.
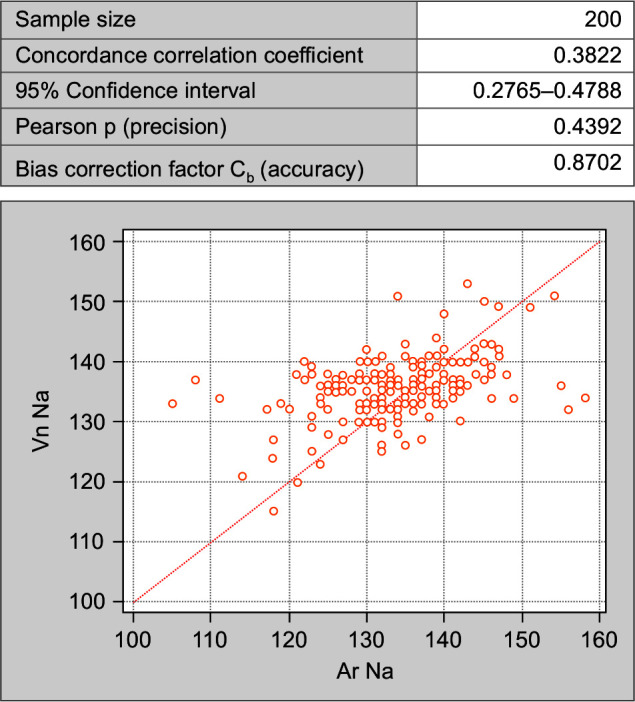
Concordance correlation coefficient between arterial and venous sodium values
Fig. 2.
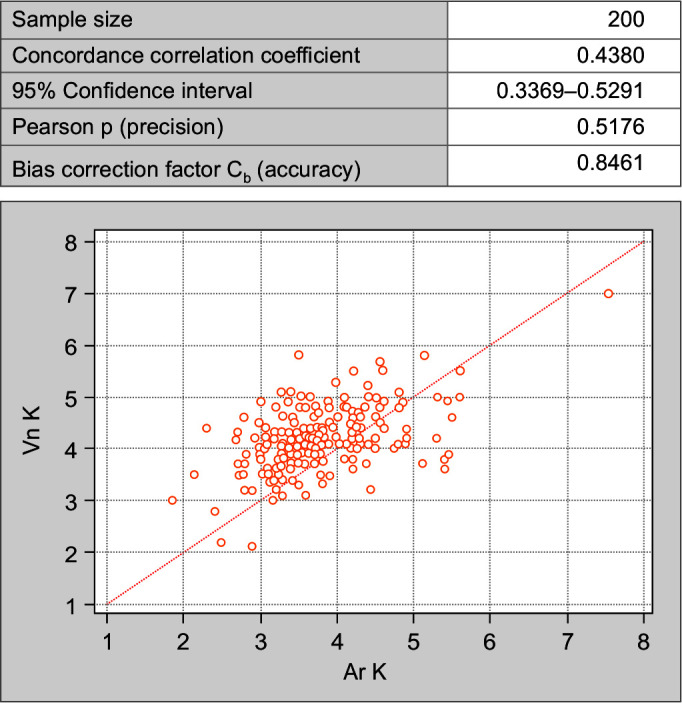
Concordance correlation coefficient between arterial and venous potassium values
Fig. 3.
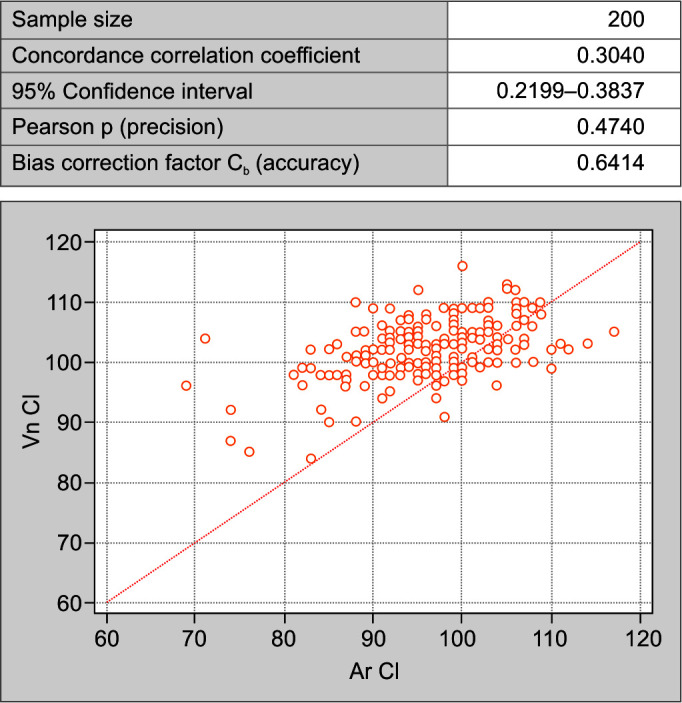
Concordance correlation coefficient between arterial and venous chloride values
Table 3.
Interpretation of concordance correlation coefficient
| Strength-of-agreement | Continuous variables | QuantiTray methods |
|---|---|---|
| Almost perfect | >0.99 | >0.90 |
| Substantial | 0.95–0.99 | 0.8–0.9 |
| Moderate | 0.90–0.95 | 0.65–0.8 |
| Poor | <0.90 | <0.65 |
When compared using Bland-Altman Plot for the mean difference, the difference of arterial sodium (Ar Na) and venous sodium (Vn Na) (Fig. 4); arterial potassium (Ar K) and venous potassium (Vn K) (Fig. 5); and arterial chloride (Ar Cl) vs venous chloride levels (Vn Cl) (Fig. 6); it was noted that the values are not within the lower limit of agreement (LLA) and upper limit of agreement (ULA). Thus, there is weak agreement in values of electrolytes between two samples. There is a significant difference between the levels of electrolytes assayed on the two samples (p < 0.05).
Fig. 4.
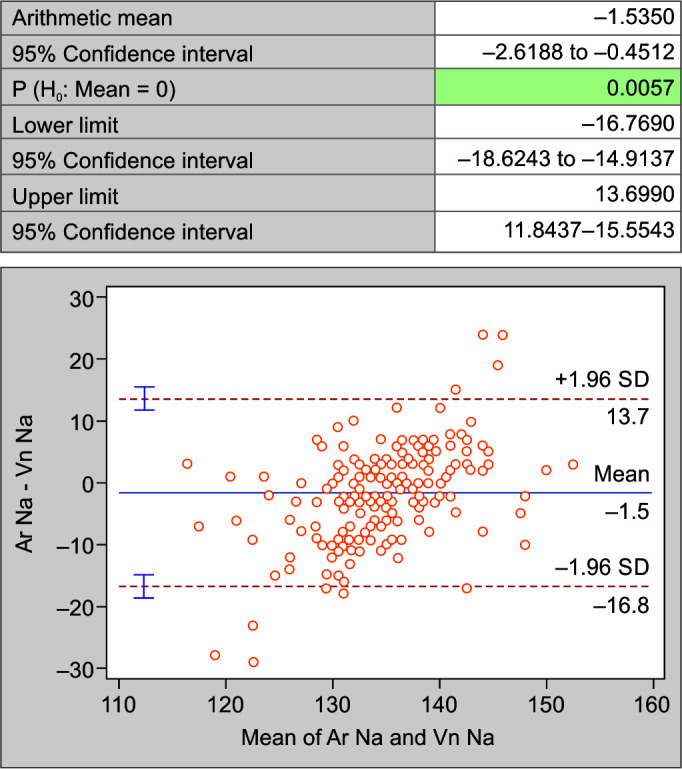
Bland-Altman plot of sodium in arterial and venous blood
Fig. 5.
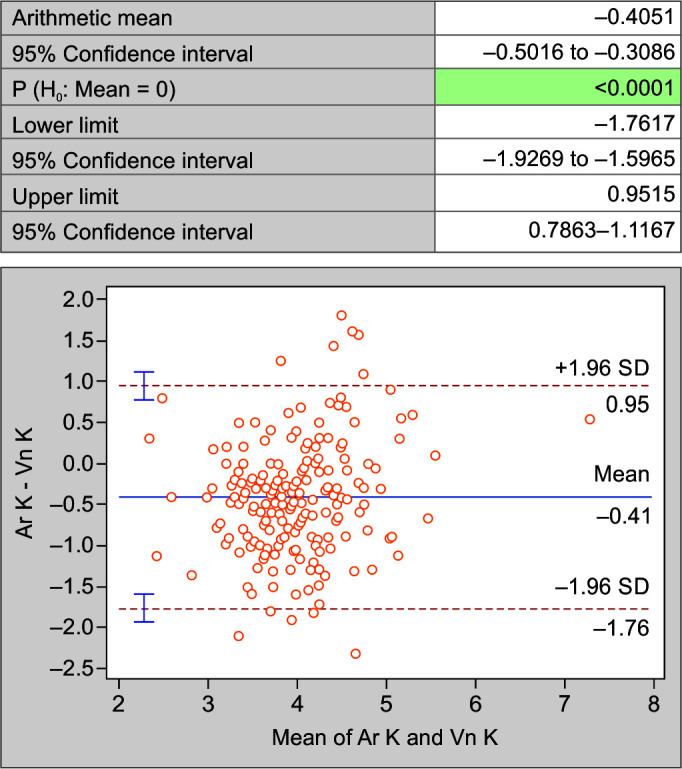
Bland-Altman plot of potassium in arterial and venous blood
Fig. 6.
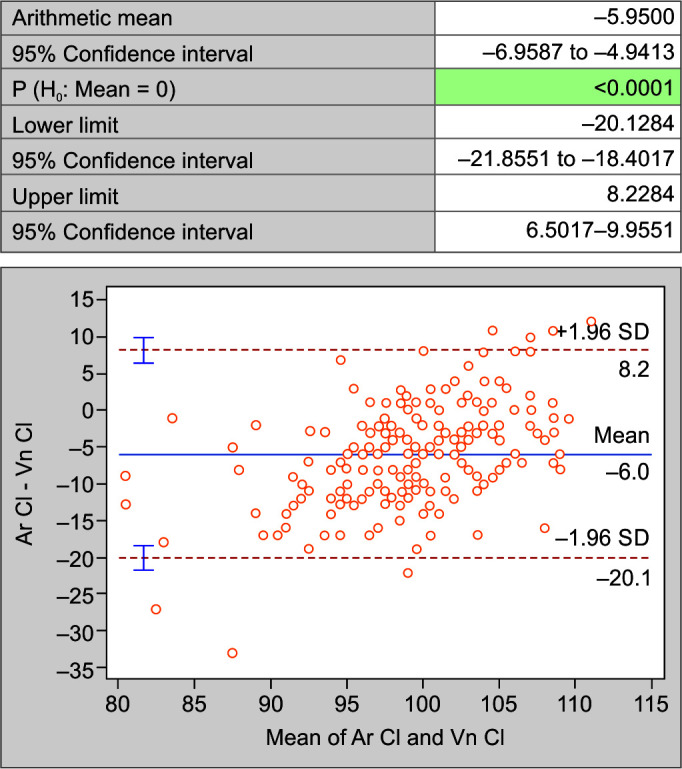
Bland-Altman plot of chloride in arterial and venous blood
Discussion
The electrolytes sodium, potassium, and chloride level fluctuation are the cause of concern to intensivists treating critically ill patients. Accurate and in-time evaluation of these parameters is thus a requisite in critical care. Estimation of sodium, potassium, and chloride by conventional electrolyte auto-analyzer in serum derived from a venous blood sample is widely standardized and validated. However, it involves centrifugation and separation of serum prior to sample processing which is time consuming. On the other hand, ABG analyzer-generated values of sodium, potassium, and chloride can be obtained immediately, though the heparin in the arterial sample can be an interference for these electrolytes assay.
The present study did not demonstrate any agreement between levels of sodium, potassium, and chloride estimated in the venous sample with that of values analyzed in the arterial sample. The outcome of our study is analogous to the outcome seen in some of the other akin studies of the recent past. Following are the observations made by researchers whose studies were retrospective as ours. Shalini et al. and Budak et al. rule out the possibility of any concordance between venous and arterial blood electrolyte values.10,14 On the contrary, Nanda et al. mention arterial and venous sodium agree, and Parveen Doddamani et al. report that arterial and venous potassium agree.15,16 Few of the researchers have done prospective study design-based projects, the outcome of which is as mentioned here: Madhavi et al. have reported similar outcomes in their study where they mention that physicians should be cautious to utilize auto-analyzer and ABG analyzer generated electrolytes report interchangeably.17 The research project of Shivesh Prakash et al. suggests that the two tests’ methods cannot be used interchangeably, except for potassium.18 Dipti Basavaraj Sanakal et al. in their research have found that benchtop auto-analyzers and ABG analyzers may be used interchangeably for the measurement of potassium but not for sodium.19 Binila Chacko et al. after their research have recommended that concordance between two different methods of electrolytes estimation be drawn using a correction factor.20
The explanation for the variation in electrolyte values is that, though both instruments are based on the direct ISE principle, they differ in instrumentation and this may cause a 2–5% variance between the values quantified.21 The heparin used in ABG samples can cause dilution and interfere with the measurement of positively charged ions.22,23
The limitations of the present study are:
Retrospective design of the study.
No data on treatment interventions like fluid infusions and blood transfusions which can affect the results of both methods.
We have restricted the study to look for concordance and have not further derived any correction factor.
Conclusion
We conclude that the electrolytes measured in serum derived from venous blood samples by conventional autoanalyzer cannot be replaced by values of arterial blood samples analyzed on a blood gas analyzer.
Orcid
RN Devaki https://orcid.org/0009-0009-3180-3950
Prajna Kasargod https://orcid.org/0009-0007-3192-888X
AN Roopa Urs https://orcid.org/0000-0002-8150-0191
N Chandrika https://orcid.org/0000-0001-5500-6643
Footnotes
Source of support: Nil
Conflict of interest: None
References
- 1.Andreev M, de Pablo JJ, Chremos A, Douglas JF. Influence of ion solvation on the properties of electrolyte solutions. J Phys Chem B. 2018;122(14):4029–4034. doi: 10.1021/acs.jpcb.8b00518. [DOI] [PubMed] [Google Scholar]
- 2.Shrimanker I, Bhattarai S. Treasure Island (FL): StatPearls Publishing; 2024. Electrolytes. In: StatPearls.https://www.ncbi.nlm.nih.gov/books/NBK541123/ Available from: [PubMed] [Google Scholar]
- 3.Schiefermeier-Mach N, Egg S, Erler J, Hasenegger V, Rust P, König J, et al. Electrolyte intake and major food sources of sodium, potassium, calcium and magnesium among a population in western Austria. Nutrients. 2020;12(7):1956. doi: 10.3390/nu12071956. [DOI] [PMC free article] [PubMed] [Google Scholar]
- 4.Dervishi A. A deep learning backcasting approach to the electrolyte, metabolite, and acid-base parameters that predict risk in ICU patients. PLoS One. 2020;15(12):e0242878. doi: 10.1371/journal.pone.0242878. [DOI] [PMC free article] [PubMed] [Google Scholar]
- 5.Burnett RW, Covington AK, Fogh-Andersen N, Külpmann WR, Lewenstam A, Maas AH, et al. Recommendations for measurement of and conventions for reporting sodium and potassium by ion-selective electrodes in undiluted serum, plasma or whole blood. International Federation of Clinical Chemistry and Laboratory Medicine (IFCC). IFCC Scientific Division Working Group on Selective Electrodes. Clin Chem Lab Med. 2000;38(10):1065–1071. doi: 10.1515/CCLM.2000.159. [DOI] [PubMed] [Google Scholar]
- 6.Lopez J. Carl A Burtis, Edward R Ashwood, David E Bruns (Eds): Tietz Textbook of Clinical Chemistry and Molecular Diagnosis, 5th edition. St. Louis, USA: Elsevier; 2012, p. 2238. Indian J Clin Biochem. 2013;28(1):104–105. doi: 10.1007/s12291-012-0287-7. [DOI] [Google Scholar]
- 7.Castro D, Patil SM, Zubair M, Keenaghan M. Treasure Island (FL): StatPearls Publishing; 2024. Arterial Blood Gas. In: StatPearls.https://www.ncbi.nlm.nih.gov/books/NBK536919/ Available from: [PubMed] [Google Scholar]
- 8.Yi HC, Shi WS, Zhang YH, Zhu XZ, Yu Y, Wang XX, et al. Comparison of electrolyte and glucose levels measured by a blood gas analyzer and an automated biochemistry analyzer among hospitalized patients. J Clin Lab Anal. 2020;34(7):e23291. doi: 10.1002/jcla.23291. [DOI] [PMC free article] [PubMed] [Google Scholar]
- 9.Yilmaz S, Uysal HB, Avcil M, Yilmaz M, Dağlı B, Bakış M, et al. Comparison of different methods for measurement of electrolytes in patients admitted to the intensive care unit. Saudi Med J. 2016;37(3):262–267. doi: 10.15537/smj.2016.3.13539. [DOI] [PMC free article] [PubMed] [Google Scholar]
- 10.Gupta S, Gupta AK, Singh K, Verma M. Are sodium and potassium results on arterial blood gas analyzer equivalent to those on electrolyte analyzer? Indian J Crit Care Med. 2016;20(4):233–237. doi: 10.4103/0972-5229.180044. [DOI] [PMC free article] [PubMed] [Google Scholar]
- 11.Taro Yamane. 2nd edition. New York: Harper & Row; 1973. Statistics: An introductory analysis, pp. 579–583. [Google Scholar]
- 12.Priest G, Smith B, Heitz B. 9180 Electrolyte Analyzer Operator's Manual, 2nd edition. AVL Scientific corporation 1996;http://www.frankshospitalworkshop.com/equipment/documents/photometer/user_manuals/ Available from: [Google Scholar]
- 13.Radiometer - Blood Gas Analyzer . Abl80 Flex operator manual.http://www.rfbms.com/Portals/0/ABL800%20Operators%20Manual%20994-909C.pdf Available from: [Google Scholar]
- 14.Budak YU, Huysal K, Polat M. Use of a blood gas analyzer and a laboratory autoanalyzer in routine practice to measure electrolytes in intensive care unit patients. BMC Anesthesiol. 2012;12:17. doi: 10.1186/1471-2253-12-17. [DOI] [PMC free article] [PubMed] [Google Scholar]
- 15.Nanda SK, Ray L, Dinakaran A. Agreement of arterial sodium and arterial potassium levels with venous sodium and venous potassium in patients admitted to intensive care unit. J Clin Diagn Res. 2015;9(2):BC28–30. doi: 10.7860/JCDR/2015/12418.5602. [DOI] [PMC free article] [PubMed] [Google Scholar]
- 16.Doddamani P, Kasapura Shivashankar K, Chikkavaddaragudi Ramachandra S, Aman I, Maduvanahalli Nataraj S. Agreement of measurement between arterial and venous electrolyte levels in neonates in a Tertiary Care Hospital. J Lab Physicians. 2020;12(1):20–26. doi: 10.1055/s-0040-1713061. [DOI] [PMC free article] [PubMed] [Google Scholar]
- 17.Trivedi M, Mohammad J, Mohd S. A comparative study on ABG analyzer versus laboratory analyzer for estimation of Electrolytes. Int J Health & Clin Res. 2021;4(21):46–49. https://www.ijhcr.com/index.php/ijhcr/article/view/3329 Available from: [Google Scholar]
- 18.Prakash S, Bihari S, Lim ZY, Verghese S, Kulkarni H, Bersten AD. Concordance between point-of-care blood gas analysis and laboratory autoanalyzer in measurement of hemoglobin and electrolytes in critically ill patients. J Clin Lab Anal. 2018;32(6):e22425. doi: 10.1002/jcla.22425. [DOI] [PMC free article] [PubMed] [Google Scholar]
- 19.Dipti Basavaraj Sanakal, Sagar Chandrakant Mhetre, Patil RS, Abdul Kayyum Shaikh. Reliability of blood gas analyzer for the measurement of electrolytes – A comparative study. Int J Clin Biochem Res. 2016;3(4):376–379. doi: 10.18231/2394-6377.2016.0007. [DOI] [Google Scholar]
- 20.Chacko B, Peter JV, Patole S, Fleming JJ, Selvakumar R. Electrolytes assessed by point-of-care testing - Are the values comparable with results obtained from the central laboratory? Indian J Crit Care Med. 2011;15(1):24–29. doi: 10.4103/0972-5229.78219. [DOI] [PMC free article] [PubMed] [Google Scholar]
- 21.Burritt MF. Current analytical approaches to measuring blood analytes. Clin Chem. 1990;36(8 Pt 2):1562–1566. 2387068 [PubMed] [Google Scholar]
- 22.Lima-Oliveira G, Lippi G, Salvagno GL, Montagnana M, Picheth G, Guidi GC. Different manufacturers of syringes: A new source of variability in blood gas, acid-base balance and related laboratory test? Clin Biochem. 2012;45(9):683–687. doi: 10.1016/j.clinbiochem.2012.03.007. [DOI] [PubMed] [Google Scholar]
- 23.van Berkel M, Scharnhorst V. Electrolyte-balanced heparin in blood gas syringes can introduce a significant bias in the measurement of positively charged electrolytes. Clin Chem Lab Med. 2011;49(2):249–252. doi: 10.1515/CCLM.2011.047. [DOI] [PubMed] [Google Scholar]


