

Summary
Changes in gene regulatory elements play critical roles in human phenotypic divergence. However, identifying the base-pair changes responsible for the distinctive morphology of Homo sapiens remains challenging. Here, we report a noncoding single-nucleotide polymorphism (SNP), rs41298798, as a potential causal variant contributing to the morphology of the skull base and vertebral structures found in Homo sapiens. Screening for differentially regulated genes between Homo sapiens and extinct relatives revealed 13 candidate genes associated with basicranial development, with TBX1, implicated in DiGeorge syndrome, playing a pivotal role. Epigenetic markers and in silico analyses prioritized rs41298798 within a TBX1 intron for functional validation. CRISPR editing revealed that the 41-base-pair region surrounding rs41298798 modulates gene expression at 22q11.21. The derived allele of rs41298798 acts as an allele-specific enhancer mediated by E2F1, resulting in increased TBX1 expression levels compared to the ancestral allele. Tbx1-knockout mice exhibited skull base and vertebral abnormalities similar to those seen in DiGeorge syndrome. Phenotypic differences associated with TBX1 deficiency are observed between Homo sapiens and Neanderthals (Homo neanderthalensis). In conclusion, the regulatory divergence of TBX1 contributes to the formation of skull base and vertebral structures found in Homo sapiens.
Keywords: Homo sapiens, Homo neanderthalensis, 22q11.2 deletion syndrome, DiGeorge syndrome, velocardiofacial syndrome, cranial base, basicranium, vertebrae, craniovertebral junction, foramen magnum
Graphical abstract
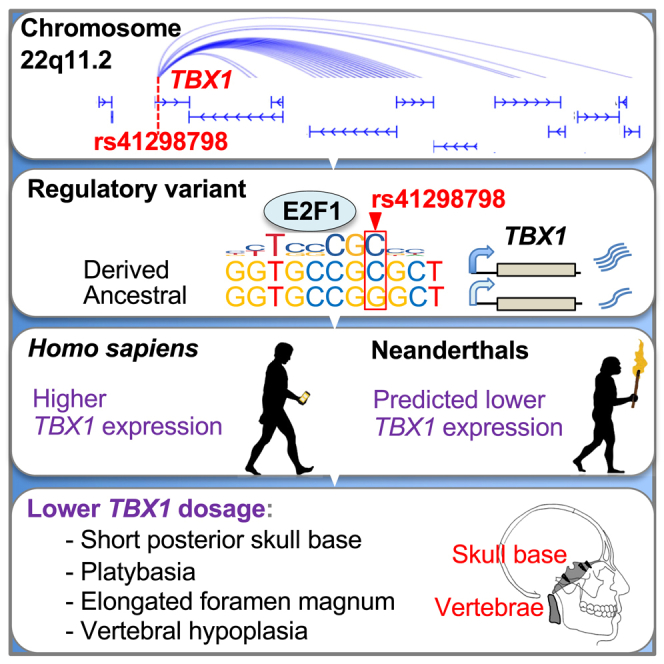
Changes in gene regulatory elements are crucial for human phenotypic divergence. However, identifying the changes responsible for the distinct morphology of Homo sapiens remains challenging. Here, we report a noncoding SNP, rs41298798, in TBX1 as a potential causal variant contributing to the basicranial morphology found in Homo sapiens.
Introduction
Genetic variants that distinguish Homo sapiens from closely related extinct hominins, for whom high-coverage genomes are available, are predominantly located in the noncoding regions of the genome.1,2,3,4 These noncoding variants, particularly in regulatory regions, have the potential to affect gene expression.5,6,7 Changes in this regulatory program are likely to have had a significant impact on human evolution, with evidence suggesting that these changes underlie morphological differences between our closest relatives.2,8,9,10 Noncoding single-nucleotide polymorphisms (SNPs) often affect gene expression by altering the function of enhancer elements and are under evolutionary pressure.6,7,11,12 In addition, these noncoding SNPs have also been implicated in human disease by playing a critical role in controlling the expression of target genes during development,13 although most noncoding variants associated with disease susceptibility are unlikely to be strongly deleterious.14 To improve our understanding of the genetic and molecular basis of morphological differences in Homo sapiens, the identification of causal variants and the interpretation of the biological impact of regulatory divergence on human evolution are essential.9,15 However, pinpointing these causal variants remains extremely challenging.16
The skull of Homo sapiens has acquired unique cranial features among primates, including a highly flexed skull base, with an increase in absolute and relative brain size during hominin evolution.17,18 Compared to modern humans (Homo sapiens), closely related extinct hominins and other great apes have different skull base phenotypes, including a flatter basicranium, a shorter length of the posterior skull base, and an anteroposteriorly elongated foramen magnum.16,17,19,20 It is hypothesized that the distinctive morphology and evolution of the human skull are influenced, at least in part, by changes in brain development and embryonic brain-skull interactions.18,21 The synchondroses of the skull base play a critical role in embryonic and postnatal skull elongation.22 To retain their capacity for accelerated fetal and postnatal growth, synchondroses must remain unmineralized as cartilage.22,23 In particular, the spheno-occipital synchondrosis (SOS) persists in the endochondral basicranium and does not ossify until 16–18 years of age in humans, contributing to the longitudinal growth of the skull.22 In the vertebral column, dysmorphic vertebrae and platyspondyly are frequently observed in our closest extinct relatives.24,25
Studying the mechanisms driving human diseases and pathological conditions in skeletal morphology can provide clues to evolutionary anatomical changes.16 Chromosome 22q11.2 deletion is one of the most common genetic microdeletions in humans.26 A 1.5 Mb hemizygous deletion of 22q11.2 causes most craniofacial phenotypes of DiGeorge syndrome (DGS [MIM: 188400]) and velocardiofacial syndrome (VCFS [MIM: 192430]). TBX1 (MIM: 602054), located at 22q11.21, encodes T-box transcription factor 1. Heterozygous loss-of-function mutations in TBX1 also cause DGS, VCFS, and conotruncal anomaly face syndrome (MIM: 217095).26,27,28,29 Some individuals with DGS/VCFS show changes in the structure of the skull base and the vertebral column.30,31,32,33,34 Tbx1 (GenBank: 21380) knockout (KO) mice exhibit cardiac and craniofacial phenotypes that mirror those observed in individuals with DGS/VCFS.35,36,37,38 During mouse embryonic development, TBX1 is localized in the cartilaginous primordium of the posterior skull base and plays a critical role in maintaining the undifferentiated phenotype of chondroprogenitors in the SOS.39 In Tbx1-KO mice, the SOS in the skull base is completely mineralized at birth,39 and the anterior arch of the first cervical vertebra is aplastic.35,37,38 Using the similar skeletal phenotypes of Tbx1-KO mice and DGS/VCFS to investigate the morphological effects of Tbx1 and TBX1 dosage may provide a basis for understanding morphological changes in modern human lineage.
In the present study, we identified an ancestral allele within the TBX1 locus that may contribute to the basicranial morphology found in Homo sapiens. To elucidate how the TBX1 locus influences basicranial morphology, we identified the target genes regulated by SNP rs41298798 and the mechanism by which this SNP controls TBX1 expression. Furthermore, we analyzed the effects of TBX1 dosage on the basicranial morphology found in Homo sapiens.
Material and methods
Bioinformatic analysis
We identified mouse genes associated with annotated anatomical abnormalities in the skull base from the Mouse Genome Informatics (MGI) (accessed on July 31, 2023) and PubMed databases (supplemental methods). The allele frequencies of the SNPs were compiled from the 1000 Genomes Project dataset.40 To characterize and obtain functional annotations of ancestral alleles at the 22q11.21 locus, we used combined annotation-dependent depletion (CADD) v1.6,41 HaploReg v4.2,42 3DSNP v2.0,43 and RegulomeDB v2.0.3.44 Histone markers in the 22q11.21 locus were queried using Encyclopedia of DNA Elements (ENCODE) phase 345 across mesenchymal stem cells and MG63 cells. Reads per million (rpm)/base-pair (bp) plots were generated for H3K27ac, H3K4me3, H3K36me3, H3K27me3, and H3K9me3 using the UCSC Genome Browser. To identify candidate causal genome-wide association study (GWAS) variants that alter gene expression, we searched for available the expression quantitative trait locus (eQTL) data using the Genotype-Tissue Expression (GTEx) project.46 The eQTL data are summarized in Table S1. We visualized and intersected variants with chromatin annotations in H1 mesendoderm cells47 using the 3D Interaction Viewer (3DIV).48 The mRNA expression data for normal tissues and tumors were obtained from the Gene Expression Profiling Interactive Analysis (GEPIA)49 web application using The Cancer Genome Atlas (TCGA) database.50 The correlation of mRNA-mRNA pairs of the gene set from human tumors was analyzed by calculating the Pearson’s correlation coefficient.
The differential effect of rs41298798 alleles on transcription factor (TF) binding was predicted for all human TF motif sets using JASPAR51 with a relative score >0.85 as the threshold for significance. Twenty base pairs surrounding rs41298798 were evaluated, and the putative TF-binding motifs for rs41298798-C and -G were compared.
CRISPR/Cas9 guide selection and genome editing
Genome editing experiments were performed using MG63 cells to identify the target genes of rs41298798. Using the CRISPR design tool CHOPCHOP,52 we selected single-guide RNA (sgRNA) sequences within 100 bp of rs41298798. Annealed oligomers, including guide RNA sequences, were subcloned into pSpCas9(BB)-2A-GFP (PX458) or pSpCas9(BB)-2A-Puro (PX459) V2.0 (plasmids #48138 and #62988; Addgene, Watertown, MA, USA; gifted by Feng Zhang)53 containing expression cassettes for the guide RNA and human-codon-optimized Cas9. Plasmids were transformed into chemically competent E. coli (DH5-alpha), and after culturing the cells, the plasmid DNA was extracted and purified. MG63 cells (TKG0294; the Cell Resource Center for Biomedical Research, Tohoku University, Sendai, Japan) were routinely grown in Dulbecco’s modified Eagle’s medium (DMEM) supplemented with 10% fetal bovine serum (FBS) and 1% antibiotics (100 U/mL penicillin and 0.1 mg/mL streptomycin) until transfection.
To delete 41 bp of noncoding sequence around rs41298798, we employed a dual-guide RNA strategy using two Cas9-guide RNA constructs with a 29-bp spacing between them. We plated MG63 cells in 24-well plates and co-transfected with 250 ng of each CRISPR construct using Lipofectamine 2000 (Thermo Fisher Scientific, Waltham, MA, USA). Clones with genomic deletions were screened using agarose gel electrophoresis of the PCR amplicons. The Δ41/Δ41 clones were expanded along with the wild-type clones, which were also exposed to the CRISPR/Cas9 complex. In each cell line, three wild-type and three biallelic 41 bp deletions were selected for further study. To generate isogenic MG63 cells that were either C/C or G/G at rs41298798, we plated MG63 cells in 12-well plates and transfected 500 ng of CRISPR plasmid constructs and 313 ng of a 100 bp single-stranded oligodeoxynucleotide donor template containing either the C or G allele. After transfection, the MG63 cells were selected using 0.25 μg/mL puromycin for 5 days. After cell growth, single colonies were isolated and genomic DNA was extracted. A 163-bp region flanking rs41298798 was PCR amplified, purified, and genotyped at rs41298798 using restriction fragment-length polymorphism assays. The purified product was digested with HhaI and electrophoresed on a 2% agarose gel, and the cleavage patterns were qualitatively analyzed. To account for off-target effects of the Cas9 nuclease, we selected three derived rs41298798-C/C and three ancestral rs41298798-G/G clones for further study. The primer sequences used for genome editing are listed in supplemental methods.
Quantitative PCR (qPCR) analysis
Total RNA was extracted from cultured cells using TRIzol (Thermo Fisher Scientific) and an RNeasy Mini Kit (Qiagen, Hilden, Germany). mRNA analysis was performed using SuperScript IV VILO Master Mix (Thermo Fisher Scientific) and PowerUP SYBR Green PCR Master Mix (Thermo Fisher Scientific). The amplification and detection of mRNAs were performed using the StepOnePlus Real-Time PCR System (Thermo Fisher Scientific). mRNA expression levels were normalized to GAPDH (GenBank: 2597) levels. The relative quantity was calculated using the 2−ΔΔCt method.54 All qPCR assays were performed in duplicate in at least three independent experiments using three different samples. The primer sequences used for qPCR are listed in supplemental methods.
Luciferase assay
Luciferase reporter vectors were constructed by cloning the TBX1 promoter (−912/+63; sense: 5′-GTTGGTACCCTCCTCAGTGCTTCCCTTTG-3′ and antisense: 5′-ACTCTCGAGAGTGTTCCTCCCTCC CTCAC-3′) with or without oligonucleotides (sense: 5′-AGGCGGGTGCCGSGCTGTGTCTAAT-3′ and antisense: 5′-ATTAGACACAGCSCGGCACCCGCCT-3′) containing either derived or ancestral alleles of rs41298798 into the pGL2-Basic vector (Promega, Madison, WI, USA). The E2F1 (MIM: 189971) expression vector has been described previously.55
MG63 and COS1 cells (RCB0143; RIKEN Cell Bank, Tsukuba, Japan) were cultured in DMEM supplemented with 10% FBS and 1% antibiotics. The cells were seeded into 24-well plates at 1 × 10⁵ cells/well. The cells were transfected with 250 ng of the pGL2 constructs with 50 ng of a lacZ (GenBank: 945006) expression vector using TransFectin reagent (Bio-Rad Laboratories, Hercules, CA, USA). Cell lysates were harvested after 48 h and assayed on a FLUOstar OPTIMA-6 instrument (BMG Labtech, Ortenberg, Germany) using a Luciferase Reporter Assay System (Promega) according to the manufacturer’s instructions.
Electrophoretic mobility shift assays (EMSAs)
We prepared probes for the derived (C) and ancestral (G) alleles of rs41298798 by annealing 25-bp complementary oligonucleotides (sense: 5′-AGGCGGGTGCCGSGCTGTGTCTAAT-3′ and antisense: 5′-ATTAGACACAGCSCGGCACCCGCCT-3′) and labeling them using a biotin 3′ End DNA Labeling Kit (Thermo Fisher Scientific). Nuclear proteins were isolated from E2F1-overexpressing COS1 and HeLa cells (TKG 0331; Cell Resource Center for Biomedical Research). DNA-protein binding reactions were performed using a LightShift Chemiluminescent EMSA kit (Thermo Fisher Scientific) according to the manufacturer’s instructions. For competition assays, nuclear proteins were pre-incubated with excess unlabeled probes before adding biotin 3′ end-labeled probes in band shift buffer (10 mM Tris-HCl [pH 7.5], 100 mM KCl, 10 mM EDTA, 2.5% glycerol, 50 ng/μL of poly(dI-dC)). For supershift assays, 2 μg of anti-E2F1 antibody (sc-251X; Santa Cruz Biotechnology, Dallas TX, USA) was added to the reaction mixture and it was incubated for 30 min at room temperature. The binding reaction mixtures were separated by electrophoresis on a 4.5% polyacrylamide gel in 0.5× Tris-borate-EDTA buffer and transferred onto Hybond-N+ membranes (Amersham, Stafford, UK). The biotin-labeled DNA was detected using a Chemiluminescent Nucleic Acid Detection Module (Thermo Fisher Scientific). Images of uncropped gels are shown in Figure S9.
Mouse lines
Tbx1tm1Dsr (synonym: Tbx1neo; MGI: 3510038; gifted by Deepak Srivastava)37 has been used for tissue-specific deletion of Tbx1 in mice.38 ICR.Cg-Mesp1tm2(cre)Ysa/YsaRbrc (hereafter referred to as Mesp1-Cre; stock no. RBRC01145, RIKEN)56 and B6.129X1-Twist2tm1.1(cre)Dor/J (hereafter referred to as Twist2-Cre; stock no. 008712; Jackson Laboratory, Bar Harbor, ME, USA)57 mice have been described previously. Heterozygous mice (Tbx1loxP/+)38 were mated with Meox2tm1(cre)Sor (also known as More-Cre mice; gifted by Michelle Tallquist),58 resulting in the heterozygous Tbx1 null allele (Tbx1KO/+).38 Subsequently, Tbx1tm1.1Dsr (synonym: Tbx1null; MGI: 3510040; Tbx1-KO mice; mixed genetic strain background) were generated in which the gene is knocked out in all tissues.37,38 Wild-type and Tbx1loxP/+ littermates were used as controls. All experimental animal procedures were reviewed and approved by the Institutional Animal Care and Use Committee of the Tokyo Medical and Dental University (permit number 0126215C, February 24, 2016). All experiments and methods were performed in accordance with relevant guidelines and regulations.
Micro-computed tomography (micro-CT)
Mineralized tissue formation of Tbx1-KO neonates was assessed using micro-CT. Images were scanned at a voltage of 100 kV and 30 μA in beam current using an inspeXio SMX-100CT instrument (Shimadzu, Kyoto, Japan) at a pixel size of 512 × 512 and voxel size of 0.049 mm/voxel. The results were further analyzed using a TRI-3D-BON imaging system (Ratoc, Santa Clara, CA, USA). 3D images were rotated at specific angles to generate sagittal and bird’s-eye views of the skull base.
Bone staining and histology
For bone staining, Tbx1-KO, Tbx1loxP/KO;Twist2-Cre, and Tbx1loxP/KO;Mesp1-Cre neonates were harvested and fixed in 95% ethanol. Bones were stained with alizarin red and Alcian blue to detect mineralized and cartilaginous regions, respectively. For histology, Tbx1-KO and Tbx1loxP/KO;Mesp1-Cre mouse embryos were harvested and fixed in 4% paraformaldehyde at 4°C overnight. Paraffin-embedded sections were stained with safranin O/haematoxylin/Fast Green to detect cartilage.
Cephalometric analysis
Lateral cephalometric radiographs were obtained to record the cephalometric values in the clinical records for orthodontic diagnosis and treatment. Cephalometric values of children with DGS/VCFS (22q11.2 deletion syndrome; mean age 8.5 years, range 5.8–12.9 years, both sexes) were compared with the values of 41 healthy age- and sex-matched controls, as previously reported.34 The research protocol was approved by the Helsinki University Hospital (HUS/234/2020 §57, December 22, 2020) and adhered to the principles outlined in the Declaration of Helsinki. In accordance with the Medical Research Act (Ministry of Social Affairs and Health, Finland), ethical approval was not required for the retrospective archival cephalometric study. The Register and Privacy Statement was formulated and approved in accordance with the European Union (EU) General Data Protection Regulation to ensure secure data protection.
Statistics
Experiments were performed on at least three independent occasions and the results are presented as the mean ± standard error of the mean for n experiments. Data were analyzed using PRISM software (version 9.0; GraphPad, San Diego, CA, USA) or Microsoft Excel. Unpaired or paired two-tailed Student’s t tests were used to compare two groups of independent samples. One-way analysis of variance (ANOVA) with Dunnett’s post-hoc test was used to analyze the differences among three or more groups. A two-way ANOVA with Sidak’s multiple comparison test was performed to compare the transcriptional activity between genotypes and in response to E2F1 overexpression. We used binomial tests to compare phenotypes across groups where success was defined as a match in the phenotypes between two pairs, with 50% concordance expected by chance. We compared differences between Tbx1-KO and wild-type mice to differences between modern humans and Neanderthals. Similarly, we compared how phenotypes differed between individuals with DGS/VCFS and unaffected individuals to differences found between modern humans and Neanderthals. The overlapping phenotypes shown in detail in Table S4 are summarized in Table 2. Statistical significance is presented as ∗p < 0.05, ∗∗p < 0.01, ∗∗∗p < 0.001, and ∗∗∗∗p < 0.0001.
Table 2.
The skull base and vertebral phenotypes in Neanderthals and individuals with DGS/VCFS compared to modern humans, and the phenotypes that differ between Tbx1-KO and wild-type mice
|
Humans |
Newborn mice |
|||||
|---|---|---|---|---|---|---|
| Modern | DGS/VCFS | Neanderthals | Tbx1-KO | Wild-type | ||
|
TBX1, Tbx1 |
gene dosage | 100% | 50% | N/A | 0% | 100% |
| gene expression | 100% | predicted to be lower | predicted to be lower | 0% | 100% | |
| Skull base and vertebral morphology | ||||||
| Skull base | platybasia | control | + | + | + (this study) | control |
| shorter length of posterior skull base | control | + | + | + | control | |
| elongated foramen magnum | control | + (this study) | + | + (this study) | control | |
| basilar impression | control | + | N/A | N/A | control | |
| Vertebral column |
hypoplastic or anomalous atlas (C1) | control | + | + | + | control |
| dysmorphic axis (C2) | control | + | + | + | control | |
| fusion of C1–C2 | control | + | + | N/A | control | |
| fusion of C2–C3 | control | + | + | N/A | control | |
| lower dorsal height of the C2–C7 | control | + | + | + (this study) | control | |
| platyspondyly (cervical and thoracic) | control | + | + | + (this study) | control | |
| Other traits | ||||||
| Limb | distal shortening of limbs | control | N/A | + | + (this study) | control |
| Neck | short neck | control | + | + | + | control |
| Height | short stature | control | + | + | + | control |
“+” represents the present phenotype. N/A, not available. Full details are presented in Table S4.
Results
Prioritization of candidate genes and variants
To identify genes that may be involved in the development of the skull base in modern humans, we screened putative positively selected genes that may be differentially regulated at the skull base between Homo sapiens and other hominins using a list of predicted target genes of ancestral alleles that underwent positive selection on the human lineage,4 a list of human genes with human-lineage high-frequency missense changes,3 and a list of mouse genes associated with “abnormal basicranium morphologies” from the MGI and PubMed databases (Figure 1A). Thirteen genes (EVC2, TBX1, DISP1, GLI3, OTX1, SP3, TBX15, BCL11B, DYRK2, TRPS1, BRD2, HMGXB3, and CSGALNACT1) were annotated as candidate genes that may be differentially regulated at the skull base between Homo sapiens and other hominins (Figures 1A and S1A). EVC2, encoding EvC ciliary complex subunit 2, is associated with Ellis-van Creveld syndrome (MIM: 225500). EVC2 has two nucleotide changes distinguishing modern humans from extinct hominins3 and the regulatory divergence of EVC2 contributes to the unique craniofacial morphology of the human lineage.9 Abnormalities have been reported in the frontal region of the skull base of Evc2-KO mice.59 In contrast, Tbx1 was annotated for abnormalities in the posterior region of the skull base, including an abnormal SOS (Figure S1A). For the ancestral alleles of the seven SNPs at the TBX1 locus (Table 1), the Neanderthal and Denisova genomes are homozygous for the ancestral alleles.4 The derived-to-ancestral genotype substitutions were present in chimpanzees and gorillas, whereas they were rare (minor allele frequency [MAF] < 0.02) in modern humans (Tables 1 and S1). These ancestral alleles in the TBX1 locus were revealed to be more prevalent in South Asians (MAF = 0.041–0.043) and Japanese (MAF = 0.034–0.077) from the 1000 Genomes Project data (Figures S1B and S1C; Tables S1 and S2). The ENCODE project annotates histone marks at genetic loci.60,61 The introns of TBX1 were enriched within active histone modification peaks (H3K27ac; Figure 1B), suggesting that the introns of TBX1 contain functional enhancers. Strong H3K4me3 enhancer signals that overlapped with H3K27ac peaks included SNPs rs41298798, rs72646954, and rs80179718 in seven cell lines (Figure 1B). This element also contains enhancers in stem cells, as indicated by the enrichment of activating marks (H3K4me3 and H3K9ac) and the depletion of H3K9me3 repressive marks (Figure 1B). These data suggest that the introns of TBX1 contain regulatory elements that may regulate the expression of genes critical for mesenchymal development. Within the region surrounding rs41298798, rs72646954, and rs80179718, a large portion of the sequence was not conserved among mammals (Figure 1B). Algorithms can be used to predict the functional consequences of noncoding SNPs (3DSNP43) and to annotate SNPs at a signal (HaploReg42 and RegulomeDB44). To assess the deleterious effects of SNPs, multi-nucleotide substitutions, and insertion/deletion variants, the CADD tool can be used.41 To identify potential causal SNPs within the TBX1 locus for functional follow up, we performed in silico analyses of these SNPs using CADD, 3DSNP, RegulomeDB, and HaploReg. Among these, rs41298798 was ranked as a promising candidate SNP (Tables 1 and S1). This SNP is associated with positive selection4 and is the most recent TBX1-derived variant based on the framework developed in our previous work.62 It is predicted to have emerged approximately 300,000 years ago. Based on these results, we selected rs41298798 as the most likely causal SNP contributing to basicranial morphology in Homo sapiens at this locus.
Figure 1.

Ancestral alleles are present in the TBX1 locus
(A) Screening strategy for candidate genes influencing the basicranial morphology of Homo sapiens. We used a list of predicted target genes of ancestral alleles,4 a list of genes with human-lineage high-frequency missense changes,3 and a list of mouse genes associated with “abnormal basicranium morphologies” obtained from the Mouse Genome Informatics database and PubMed. The list of mouse genes can be found in the supplemental methods and Table S5.
(B) SNPs mapped to introns of the TBX1. From top to bottom, the “100 Vert. Cons” track corresponds to sequence conservation across 100 vertebrates, protein-coding genes, epigenetic tracks from the ENCODE database (primary IDs: ENCSR555QHZ, ENCSR196LEI, ENCSR004AKD, ENCSR006GPM, and ENCSR439EHQ), and ancestral alleles. All ENCODE data are plotted as reads per million (rpm)/bp for chromatin immunoprecipitation (ChIP)-sequencing performed on a representative sample of each type.
Table 1.
Ancestral alleles at variants within the 22q11.21 locus
| SNP | Position (GRCh38) |
Allele |
Population genetics |
Scores |
||||||
|---|---|---|---|---|---|---|---|---|---|---|
| Ref >Alt | MAF | Derived | Ancestral | Chimp | Gorilla | CADD v1.6 | 3DSNP v2.0 | Regulome v2.0.3 | ||
| rs8137465 | chr22:19757834 | T > C | 0.016 | T | C | C | C | 2.829 | 13.34 | 0.74401 |
| rs72646954 | chr22:19761437 | T > C | 0.019 | T | C | C | C | 8.179 | 37.37 | 0.60906 |
| rs80179718 | chr22:19761655 | A > G | 0.019 | A | G | G | G | 7.194 | 30.52 | 0.60906 |
| rs41298798 | chr22:19761985 | C > G | 0.017 | C | G | G | G | 14.530 | 28.11 | 0.60906 |
| rs41300444 | chr22:19771247 | A > G | 0.016 | A | G | G | G | 5.668 | 2.88 | 0.60906 |
| rs41300472 | chr22:19772783 | T > C | 0.016 | T | C | C | C | 5.285 | 11.86 | 0.60906 |
| rs41297812 | chr22:19776072 | C > T | 0.018 | C | T | T | T | 1.465 | 7.20 | 0.74401 |
Ancestral alleles at the TBX1 locus4 and in silico analyses are shown. Ref, reference allele; Alt, alternative allele; MAF, minor allele frequency; Chimp, chimpanzee.
The ancestral allele of rs41298798 causes dysregulated expression of genes within the 22q11.21 locus
To identify bone-related cells in which rs41298798 has a relevant regulatory function, we examined the occupancy of histone marks at the locus in cells annotated in the ENCODE database. MG63 osteoblast-like cells expressing TBX138 showed enrichment of activating methylation marks (H3K4me3) and depletion of repressive marks (H3K27me3 and H3K9me3) at rs41298798 (Figure 2A). To determine whether the expression of genes in the 22q11.21 locus was regulated by a regulatory element present in the TBX1 intron, we generated MG63 cell lines with homozygous deletions of rs41298798 using CRISPR/Cas9 with flanking sgRNAs (Figure 2B). The sgRNAs were transfected into MG63 cells, and three clones with a bi-allelic 41-bp deletion (Δ41) were generated from the screened clones. The sequence of the 41-bp deletion included rs41298798 and rs1978060 (Figure S2) and putative TF-binding sites (Figure S3). When we examined the expression of genes in the 22q11.21 locus, loss of the 41 bp flanking rs41298798 resulted in higher expression levels of GNB1L, TANGO2, and RANBP1 and lower expression levels of SEPTIN5, COMT, and DGCR8 compared to their expression levels in wild-type lines (Figure 2C), indicating that the deleted sequence contains a regulatory element. No significant differences in TBX1 expression levels were observed (Figure 2C).
Figure 2.

The ancestral allele at rs41298798 causes aberrant expression of genes at the 22q11.21 locus
(A) Epigenetic tracks obtained from the ENCODE database (primary IDs: ENCSR804JFU, ENCSR579SNM, ENCSR380ORO, and ENCSR744EKG). MG63 cells showed enrichment of activating methylation marks (H3K4me3 and H3K36me3) and depletion of repressive marks (H3K27me3 and H3K9me3) at rs41298798.
(B) Generation of cell lines with 41-bp deletion at rs41298798 regulatory region. The MG63 cell line was edited to generate three homozygous clones for the control and bi-allelic 41-bp deletion (Δ41/Δ41), with two single-guide RNAs flanking rs41298798.
(C) MG63 cells with the Δ41 deletion showed dysregulated expression levels of genes at the 22q11.21 locus. The results were normalized to GAPDH levels (n = 3 per genotype; the results are presented as mean ± SEM; ∗∗p < 0.01; ∗∗∗p < 0.001; NS, not significant; Student’s t test).
(D) Generation of edited MG63 cells at rs41298798. The MG63 cell line was edited to generate three homozygous clones for both the derived allele rs41298798-C and the ancestral allele rs41298798-G. ssODN, single-stranded oligodeoxynucleotide.
(E) The 3D Interaction Viewer (3DIV) with the hg38 genome assembly showing the genomic context of chromosome 22q11.21 (top). The rs41298798-G/G MG63 cells show reduced expression of TBX1 compared to the C/C isogenic control (bottom). The results for each sample were normalized to its GAPDH content (n = 3 per genotype; the results are presented as mean ± SEM; ∗p ≤ 0.05; ∗∗p ≤ 0.01; ∗∗∗∗p ≤ 0.0001; NS, not significant; Student’s t test).
The association between noncoding SNP genotypes and gene expression levels was assessed using the eQTL approach.46 To identify the target genes of rs41298798, we searched all available tissue data for eQTL analysis using the GTEx project46; however, there were no data for rs41298798 (Table S1). rs1978060 is located 17 bp 3′ of rs41298798 (Figure S2) and confers a genetic predisposition to adolescent idiopathic scoliosis in the East Asian population.63 The eQTL analysis showed that rs1978060 was associated with the expression levels of TBX1, GNB1L (MIM: 610778), and RTL10 (MIM: 620751; Figure S4). To determine whether the effect on TBX1 gene expression was mediated by the rs41298798 genotype, we generated isogenic MG63 cell lines with either derived rs41298798-C/C or ancestral rs41298798-G/G genotypes. Three clones of each genotype (C/C and G/G) were selected for expansion (Figure 2D). Of note, qPCR demonstrated a regulatory effect of the genotype at rs41298798 on GNB1L, TANGO2 (MIM: 616830), RANBP1 (MIM: 601180), SEPTIN5 (MIM: 602724), DGCR8 (MIM: 609030), and COMT (MIM: 116790), with the ancestral allele driving 59% lower TBX1 expression levels than the derived allele (Figure 2E; p = 1.61 × 10⁻⁹). The expression level of the CRKL (MIM: 602007), a potential modifier of cardiac development in 22q11.2 deletion syndrome and a possible target of noncoding putative regulatory variants,64 was unaffected (Figure 2E). Chromatin conformation capture experiments showed that the enhancer region containing rs41298798 physically interacted with the promoters of genes at the 22q11.21 locus in H1 mesendoderm cells (Figure S5). The rs41298798-gene interactions using 3DSNP showed that the TBX1 is located within three-dimensional (3D) chromatin loops in multiple cell types (Figure S6; Table S3). These data show that the deletion of a small region of putative regulatory DNA at rs41298798 disrupts the normal regulation of genes at the 22q11.21 locus, and that rs41298798 acts as an allele-specific enhancer to modulate the expression of TBX1.
E2F1 differentially binds the derived vs. ancestral alleles of rs41298798
Having shown that rs41298798 alters TBX1 expression levels (Figure 2E), we sought to validate the allele-specific enhancer activity of rs41298798 on the TBX1 promoter. We constructed luciferase reporter vectors containing the TBX1 promoter and inserted nucleotides containing either the derived rs41298798-C allele or the ancestral rs41298798-G allele. We then examined the effect of rs41298798 on TBX1 promoter activity and found that the presence of the rs41298798 allele did not alter TBX1 promoter activity (Figure 3A). There was no significant difference between the derived allele (C) and the ancestral allele (G; Figure 3A). TFs may be responsible for the allele-specific reporter activity of rs41298798. To test this hypothesis, we searched for TFs that may have differential binding effects on rs41298798. Using JASPAR 2020 CORE,51 we identified human E2F1 as a candidate TF that could act on the derived rs41298798-C allele (Figure 3B). The ancestral rs41298798-G allele alters a sequence that resembles a consensus E2F1 binding motif (Figure 3B). E2F1 expression levels were positively correlated with TBX1 expression levels in samples from the GTEx database (Figure S7). When we overexpressed E2F1 in MG63 and COS1 cells, the construct containing the derived allele (C) showed higher enhancer activity than the TBX1 promoter vector with the G allele at rs41298798 (Figure 3C), suggesting that the rs41298798-C allele had enhancer activity against the TBX1, which was modulated by E2F1. The ancestral allele (G) significantly reduced E2F1-dependent reporter activity compared to the derived allele (C; Figure 3C).
Figure 3.

The ancestral allele at rs41298798 alters an E2F1-binding site and reduces E2F1 responsiveness
(A) The relative luciferase activity of constructs containing the rs41298798-C or rs41298798-G allele in MG63 and COS1 cells (n = 6). The results are presented as mean ± SEM; NS, not significant; one-way ANOVA.
(B) The sequence surrounding rs41298798 resembles a consensus E2F1-binding motif (JASPAR ID: MA0024.2). The derived rs41298798-C to the ancestral rs41298798-G within the predicted E2F1 binding motif. The ancestral allele is conserved in apes.
(C) Effect of E2F1 overexpression on allele-specific enhancer activity of rs41298798 toward TBX1. The rs41298798-C or rs41298798-G alleles were cloned downstream of TBX1-promoter-driven luciferase constructs, and luciferase reporter assays were performed following transient transfection of MG63 or COS1 cells (n = 6; the results are presented as mean ± SEM; ∗p ≤ 0.05; ∗∗∗p ≤ 0.001; ∗∗∗∗p ≤ 0.0001; two-way analysis of variance [ANOVA]).
(D) Electrophoretic mobility shift assays (EMSAs) with biotin-labelled probes containing rs41298798-C or rs41298798-G alleles in E2F1-transfected COS1 cells. (Left) The competitor represents 200-fold excess amounts of an unlabelled probe compared with the biotin-labelled probe. (Right) EMSA using an anti-E2F1 antibody (Ab). Black arrows, allele-specific bands that interact with nuclear proteins. Uncropped images are shown in Figure S9.
The allele-specific activity of rs41298798 may be attributed to different binding affinities for E2F1. To experimentally validate the differential binding of E2F1 to the rs41298798 alleles, we performed EMSAs. Consistent with the observed differences in transcriptional activity, the derived and ancestral alleles of rs41298798 showed different DNA-protein complex-binding patterns (Figure 3D). EMSA showed reduced experimental binding in the presence of an anti-E2F1 antibody (Figure 3D). These results provide evidence that rs41298798 acts as an allele-specific enhancer to induce TBX1 transcriptional activity through E2F1, and they provide an explanation for the association between rs41298798 and changes in TBX1 expression levels.
Reduced dosage of Tbx1 contributes to the morphological changes in the posterior skull base and vertebral column
To investigate the effects of TBX1 that may underlie the morphological changes in our lineage, we analyzed the skeletal phenotypes of Tbx1-KO mice to determine whether Tbx1-KO phenotypes resembled the divergent phenotypes in our lineage, following an approach pioneered by Gokhman et al.9 First, we imaged the skull bases of neonatal Tbx1-KO mice and their wild-type littermates using micro-computed tomography. Deletion of Tbx1 in mice resulted in precocious ossification of the SOS and fusion of the basisphenoid and basioccipital bones at the skull base, resulting in a shortened skull base and an anteroposteriorly elongated foramen magnum compared to wild-type littermates (Figure 4A). We also found that Tbx1-KO neonates had platybasia (flattening of the skull base) due to inferior displacement of the basioccipital bone at the foramen magnum (Figure 4A).
Figure 4.

Key skeletal phenotypes observed in Tbx1-KO mice
(A) Skulls from wild-type and Tbx1-KO neonates were subjected to micro-computed tomography and are shown as one sagittal plane through the skull base (ⅰ–ⅳ) at low (ⅰ and ⅱ) and high (ⅲ and ⅳ) magnification and by bird’s-eye view (ⅴ and ⅵ). The spheno-occipital synchondrosis (SOS) is depicted as the space between the basisphenoid (bs) and basioccipital (bo) bones in wild-type mice (ⅰ, ⅲ, and ⅴ). Note that the fusion of adjacent bones (bs and bo) in Tbx1-KO mice (ⅵ) reduces the anteroposterior length of the posterior region of the skull base (red bracket) and elongates the foramen magnum (fm) anteroposteriorly. Tbx1-KO mice have a cleft palate65 (red arrow in ⅵ).
(B) Sagittal sections of E14.5 wild-type (ⅰ and ⅲ) and Tbx1-KO (ⅱ and ⅳ) embryos were stained with safranin O/haematoxylin/Fast Green and observed at low (ⅰ and ⅱ) and high (ⅲ and ⅳ) magnification. Ar, the anterior arch of C1. Note that the C2 odontoid process (asterisk) is tilted ventrally toward the malformed skull base in Tbx1-KO embryos (ⅳ). Abnormal intraoral epithelial adhesion is observed between the posterior domain of the Tbx1-KO palate and the oropharynx65 (ⅱ). rp, Rathke’s pouch; hb, hyoid bone; tc, thyroid cartilage; cc, cricoid cartilage; tn, tongue; op, oropharynx. Scale bars: 0.4 mm.
(C) Alizarin red and Alcian blue staining of bones of the lateral view of the cervical vertebrae (C1–C7) of wild-type and Tbx1-KO mice. In Tbx1-KO neonates, the cervical vertebrae are hypoplastic, the anterior arch of C1 (ar) is missing, the body of the hyoid bone (hb) is absent, and the thyroid cartilages (tc) are hypoplastic. Diagrams of the vertebrae with the landmarks for the measured parameters in (D) are also shown.
(D) Measurements of vertebrae from wild-type and Tbx1-KO mice (n = 4 for each genotype; the results are presented as mean ± SEM; ∗p < 0.05; ∗∗p < 0.01; Student’s t test).
(E) Ventral view of lumbar vertebrae (L1–L3) from wild-type and Tbx1-KO neonates. vb, vertebral body.
(F) Staining of bones of the forelimbs and hindlimbs of wild-type and Tbx1-KO neonates. Brackets indicate the ossified shaft of the ulna (u) and tibia (t). s, scapula; hu, humerus; r, radius; fe, femur; fi, fibula.
At the onset of endochondral ossification, the odontoid process (dens) of the second cervical vertebra (C2 or axis) is elongated and projects cranially in the wild-type embryos (Figure 4B). In Tbx1-KO embryos, the odontoid process was inclined ventrally toward the displaced basioccipital bones, resulting in a forward-inclined neck (Figures 4B and 4C). After the premature fusion of SOS,39 mesoderm-specific Tbx1-KO embryos (Tbx1loxP/KO;Mesp1-Cre) exhibited phenotypes that recapitulated those of Tbx1-KO embryos (Figure S8A). As previously reported,35,37,38 Tbx1-KO mice were deficient in the anterior arch of C1 (the atlas), lacked the hyoid bone, and had reduced and fragmented thyroid cartilage (Figure 4C). The lower vertical odontoid process of C2 and the absence of the anterior arch of C1 reduced the sagittal space of the oropharynx and hypopharynx in Tbx1-KO embryos (Figure 4B). In the developing vertebral column, segmental expression of Tbx1 begins on embryonic day (E) 9.5, and Tbx1 localizes to each sclerotome at E12.5.66 Tbx1-KO mice have shortened necks.35 Therefore, we examined the vertebral column of Tbx1-KO mice. Consistently, Tbx1-KO neonates showed hypoplasia of the cervical vertebrae (Figures 4C and 4D). The dorsal heights and widths of the ossified lesions of the cervical vertebrae were significantly reduced, and the C2 angle was flattened in Tbx1-KO mice (Figures 4C and 4D). In the lumbar vertebrae, the ossification centers of the vertebral bodies were also flattened in Tbx1-KO (Figure 4E) and osteochondroprogenitor-specific Tbx1-KO (Tbx1loxP/KO;Twist2-Cre) neonates (Figure S8B). In the long bones of the forelimb and hindlimb, Tbx1-KO and Tbx1loxP/KO;Mesp1-Cre neonates showed approximately a 15% reduction in the length of the ossified shaft at the ulna and tibia (Figures 4F and S8C). These results indicate that a reduced dosage of Tbx1 leads to specific changes in the skeletal morphology of mice.
Neanderthals exhibited skeletal phenotypes reminiscent of TBX1 deficiency
TBX1 expression was downregulated by the ancestral allele compared to the derived allele (Figure 2E). The effect of rs41298798 on TBX1 promoter activity showed a significant allelic difference when co-transfected with E2F1 (Figure 3C). Therefore, we hypothesized that phenotypes similar to those driven by TBX1 dosage may also exist between Homo sapiens and extinct hominins. To investigate whether extinct hominins may have TBX1-deficient-like phenotypes, we collected information on divergent phenotypes in the skull base and vertebral column of Neanderthals (Tables 2 and S4). We tested whether each known phenotypic difference was present in Tbx1-KO mice (Tables 2 and S4). We found that 7 out of 7 phenotypes showed the same directionality between wild-type and Tbx1-KO mice as they do between modern humans and Neanderthals (100% compared with 50% expected by chance, p = 7.8 × 10⁻³, binomial test; Figure 5A). In other words, Tbx1-KO mouse phenotypes differ from modern human phenotypes in the skull base and vertebral column and mirror ancestral states. These results suggest that the degree of phenotypic change in the skull base and vertebrae is TBX1-expression dependent.
Figure 5.

Phenotypic differences associated with TBX1 deficiency are observed between modern humans (Homo sapiens) and Neanderthals (Homo neanderthalensis)
(A) The number of the skull base and vertebral phenotypes that are similar between modern humans and Neanderthals and between wild-type and Tbx1-KO mice (Table 2). Two-sided binomial test p values are shown. Phenotypic differences in wild-type versus Tbx1-KO mice mirror the phenotypic differences in modern humans versus Neanderthals.
(B) The number of identical skull base and vertebral phenotypes between modern humans and Neanderthals and between healthy and DGS/VCFS individuals (Table 2). Two-sided binomial test p values are shown. Phenotypic differences between healthy individuals and those with DGS/VCFS mirror the phenotypic differences between modern humans and Neanderthals.
(C) Summary of the enhancer activity of rs41298798 with a proposed model for the basicranial morphology found in Homo sapiens. A model of the rs41298798-dependent expression of TBX1 in a coordinator motif bound with E2F1.
Humans with DGS/VCFS have skeletal and cranial anomalies, including a shortened posterior skull base length, platybasia, and dysmorphic vertebrae (Tables 2 and S4). While DGS/VCFS results from a de novo heterozygous deletion of chromosome 22q11.2 or loss-of-function mutations in the TBX1 coding region,26,27,28,29 an ancestral allele of rs41298798 may replicate some of the effects of TBX1 haploinsufficiency by reducing TBX1 expression. To investigate the association between TBX1 downregulation and the corresponding skull base and vertebral phenotypes in modern humans versus Neanderthals, we tested whether TBX1 haploinsufficiency phenotypes resemble phenotypes that differ among hominins. Individuals with DGS/VCFS exhibit a shortened skull base.34 We compared the cephalometric data of individuals with DGS/VCFS and controls, focusing on the longitudinal diameter of the foramen magnum (Figure S10). The average longitudinal diameter was 18.3 ± 7.7 mm in the controls and 23.3 ± 7.0 mm in the individuals with DGS/VCFS (n = 41 for each group; mean ± standard deviation; paired Student’s t test, p < 0.0001). This result indicates that the foramen magnum is anteroposteriorly elongated in individuals with DGS/VCFS (Table 2). We found that 9 out of 9 DGS/VCFS phenotypes (100%) match the directionality of the evolutionary contrasts discussed above, compared to 50% expected by chance (p = 2.0 × 10⁻³, binomial test; Figure 5B). Notably, the key phenotypes that are often used to describe differences in skeletal phenotypes between modern humans and Neanderthals were observed in individuals with DGS/VCFS as well as in Tbx1-KO mice (Tables 2 and S4). These results suggest that the skeletal phenotypic manifestation is TBX1-expression dependent and is consistent between Neanderthals and individuals with TBX1 haploinsufficiency where TBX1 expression is predicted to be lower than in healthy humans. As depicted in our model (Figure 5C), our findings suggest the association between the functional SNP rs41298798 and the basicranial morphology of humans. Moreover, our results suggest that the mechanism by which this SNP controls TBX1 expression may have contributed to the evolution of the human skull base and vertebral column.
Discussion
The majority of Neanderthal alleles are not highly adaptive, resulting in low frequencies (<2%) in modern humans.67 To dissect ancestral alleles, the identification of the target genes of actual causal variants and their potential network is critical. Here, we showed that a regulatory component located in an intron of TBX1 and encompassing rs41298798 affects the expression of multiple genes associated with 22q11.2 deletion syndrome, including TBX1. Of note, the ancestral allele of rs41298798 drives a decrease in TBX1 expression levels of approximately 59% compared to the expression levels of the derived allele. The effect of the ancestral allele may have been significant because TBX1 haploinsufficiency induces DGS/VCFS.26,27,28,29 We demonstrated that an intronic SNP, rs41298798, acts as an allele-specific enhancer to induce TBX1 transcriptional activity mediated by E2F1. E2F1 binding at rs41298798 increases transcriptional activation of the TBX1 promoter, revealing that the derived rs41298798-C allele has higher transcriptional activity than the ancestral rs41298798-G allele. E2F1 is a critical TF that recruits the RNA polymerase II cofactor to mediate enhancer-promoter interactions that affect gene expression.68,69 Thus, E2F1 may act as a mediator of allele-specific enhancer activity through rs41298798, thereby strengthening enhancer-promoter interactions and controlling TBX1 expression. In addition to its effect on TBX1, the allelic variation at rs41298798 induces the dysregulation of genes located within the 22q11.21 locus. These genes may collectively exert a synergistic influence on the phenotype. Further studies are needed to determine how the regulatory elements in TBX1 introns mediate gene expression at 22q11.21. Interestingly, the ancestral alleles in the TBX1 locus are more prevalent in South Asians and Japanese, which is consistent with previous reports indicating that Neanderthals share more ancestral alleles with East Asians than with Europeans.70,71,72 These findings may reflect additional interbreeding in the ancestors of East Asians.73
It has long been unclear whether the various cranial features of modern humans have evolved in response to separate selective pressures or whether they are the result of inherent morphological integration of the skull.21 To investigate whether changes in TBX1 expression contribute to the morphological changes in basicranial morphology, we compared skeletal phenotypes, focusing on the skull base and vertebrae. Tbx1-KO mice show skull base phenotypes similar to the divergent phenotypes of modern humans and Neanderthals. Individuals with DGS/VCFS also exhibit phenotypes that can help infer the effect of ancestral alleles. Thus, TBX1 haploinsufficiency phenotypes suggest that TBX1 upregulation may have been involved in morphological changes in the skull base during human evolution. The increased length of the skull base is mainly driven by SOS.22 Precocious ossification and/or malformation of the SOS causes the fusion of the basisphenoid and basioccipital bones and subsequent malformations leading to a shortened posterior region of the skull base and platybasia, which in turn causes an anteroposteriorly elongated foramen magnum and cervical malposition. In other words, the TBX1 dosage affects the length, morphology, and angle of the skull base and induces subsequent changes in the C2 odontoid process. Tbx1-KO mice are deficient in the anterior arch of C1 and exhibit hypomorphic vertebrae. These phenotypes may play a role in the loss of the forwardly inclined neck in the Homo sapiens lineage, because species with vertically oriented odontoid processes can position the head perpendicular to the neck, allowing the weight of the head to be better supported by the vertebral column.74 They may also go hand-in-hand with modified brain ontogeny, allowing specific brain regions to expand.75 The study of cartilage in extinct Homo lineages remains challenging76; however, our results raise the possibility that TBX1 upregulation in Homo sapiens may be associated with changes in ancestral traits and/or disease susceptibilities. It is important to note that the clinical features of DGS/VCFS are highly variable, even among individuals with identical deletions,77 suggesting that genetic background, unusual modes of inheritance, and/or environmental risk factors may affect the presentation of the phenotype.
In conclusion, our research suggests that regulatory divergence within the TBX1 locus plays an essential role in shaping the distinctive posterior skull base and vertebral structures found in Homo sapiens. Further identification of causal variants, coupled with the exploration of their target gene networks, may provide insights into the evolutionary mechanisms responsible for the characteristic morphology of Homo sapiens.
Data and code availability
The cephalometric data from individuals with DGS/VCFS was collected in a clinical setting. Individual-level cephalometric measurements are not available due to current data protection legislation. The published article includes all other datasets generated or analyzed during this study.
Acknowledgments
We thank Deepak Srivastava, David Ornitz, Michelle Tallquist, and Yumiko Saga for providing the mice; Feng Zhang and Masataka Nakamura for providing the reagents; Hiromi Yanagisawa, David Bick, and Juan Moriano for discussions; and Eriko Matsumoto for technical assistance. The cell lines were provided by RIKEN BRC through the National BioResource Project of MEXT Japan or the Cell Resource Center for Biomedical Research, Tohoku University. This work was supported by grants from the Japan Society for the Promotion of Science (JSPS) (KAKENHI grant numbers JP20K09901 and JP23K09149) (N.F.), and the Spanish Ministry of Science and Innovation (PID2019-107042GB-I00) (C.B.).
Author contributions
N.F. provided overall project management. N.F. and C.B. discussed and evaluated the in silico data. N.F. designed and performed all the in vitro and in vivo experiments. A.H. collected and managed the cephalometric samples and clinical data. All authors discussed the results and implications and commented on the manuscript at all stages.
Declaration of interests
The authors declare no competing interests.
Published: April 11, 2024
Footnotes
Supplemental information can be found online at https://doi.org/10.1016/j.ajhg.2024.03.012.
Web resources
1000 Genomes Project, http://www.1000genomes.org/
3DIV & database, http://kobic.kr/3div/
3DSNP, http://cbportal.org/3dsnp
CADD, https://cadd.gs.washington.edu/
CHOPCHOP, https://chopchop.cbu.uib.no/
dbSNP, http://www.ncbi.nlm.nih.gov/snp/
ENCODE, https://www.encodeproject.org/
Ensembl, http://asia.ensembl.org/Homo_sapiens/Info/Index
GEPIA, http://gepia.cancer-pku.cn/detail.php
GTEx project, http://www.gtexportal.org/home
HaploReg, https://pubs.broadinstitute.org/mammals/haploreg/haploreg.php
JASPAR 2020 CORE, http://jaspar.elixir.no
MGI, https://www.informatics.jax.org/
Monarch Initiative, https://monarchinitiative.org
NCBI Gene, https://www.ncbi.nlm.nih.gov/gene/
OMIM, http://www.omim.org/
PubMed, https://pubmed.ncbi.nlm.nih.gov/
RegulomeDB, http://regulomedb.org
TCGA, https://tcga-data.nci.nih.gov/
UCSC Genome Browser, https://genome.ucsc.edu/
Supplemental information
References
- 1.King M.C., Wilson A.C. Evolution at two levels in humans and chimpanzees. Science. 1975;188:107–116. doi: 10.1126/science.1090005. [DOI] [PubMed] [Google Scholar]
- 2.Balzeau A., Albessard-Ball L., Kubicka A.M., Filippo A., Beaudet A., Santos E., Bienvenu T., Arsuaga J.-L., Bartsiokas A., Berger L., et al. Dosage analysis of the 7q11.23 Williams region identifies BAZ1B as a major human gene patterning the modern human face and underlying self-domestication Matteo. Sci. Adv. 2022;8 doi: 10.1126/sciadv.abp9767. [DOI] [PMC free article] [PubMed] [Google Scholar]
- 3.Kuhlwilm M., Boeckx C. A catalog of single nucleotide changes distinguishing modern humans from archaic hominins. Sci. Rep. 2019;9:8463. doi: 10.1038/s41598-019-44877-x. [DOI] [PMC free article] [PubMed] [Google Scholar]
- 4.Peyrégne S., Boyle M.J., Dannemann M., Prüfer K. Detecting ancient positive selection in humans using extended lineage sorting. Genome Res. 2017;27:1563–1572. doi: 10.1101/gr.219493.116. [DOI] [PMC free article] [PubMed] [Google Scholar]
- 5.Weyer S., Pääbo S. Functional analyses of transcription factor binding sites that differ between present-day and archaic humans. Mol. Biol. Evol. 2016;33:316–322. doi: 10.1093/molbev/msv215. [DOI] [PMC free article] [PubMed] [Google Scholar]
- 6.Franke M., Ibrahim D.M., Andrey G., Schwarzer W., Heinrich V., Schöpflin R., Kraft K., Kempfer R., Jerković I., Chan W.L., et al. Formation of new chromatin domains determines pathogenicity of genomic duplications. Nature. 2016;538:265–269. doi: 10.1038/nature19800. [DOI] [PubMed] [Google Scholar]
- 7.Long H.K., Prescott S.L., Wysocka J. Ever-changing landscapes: Transcriptional enhancers in development and evolution. Cell. 2016;167:1170–1187. doi: 10.1016/j.cell.2016.09.018. [DOI] [PMC free article] [PubMed] [Google Scholar]
- 8.Wang X., Zhou T., Wunderlich Z., Maurano M.T., DePace A.H., Nuzhdin S.V., Rohs R. Analysis of genetic variation indicates DNA shape involvement in purifying selection. Mol. Biol. Evol. 2018;35:1958–1967. doi: 10.1093/molbev/msy099. [DOI] [PMC free article] [PubMed] [Google Scholar]
- 9.Gokhman D., Agoglia R.M., Kinnebrew M., Gordon W., Sun D., Bajpai V.K., Naqvi S., Chen C., Chan A., Chen C., et al. Human-chimpanzee fused cells reveal cis-regulatory divergence underlying skeletal evolution. Nat. Genet. 2021;53:467–476. doi: 10.1038/s41588-021-00804-3. [DOI] [PMC free article] [PubMed] [Google Scholar]
- 10.Silvert M., Quintana-Murci L., Rotival M. Impact and evolutionary determinants of Neanderthal introgression on transcriptional and post-transcriptional regulation. Am. J. Hum. Genet. 2019;104:1241–1250. doi: 10.1016/j.ajhg.2019.04.016. [DOI] [PMC free article] [PubMed] [Google Scholar]
- 11.Chen X.F., Zhu D.L., Yang M., Hu W.X., Duan Y.Y., Lu B.J., Rong Y., Dong S.S., Hao R.H., Chen J.B., et al. An osteoporosis risk SNP at 1p36.12 acts as an allele-specific enhancer to modulate LINC00339 expression via long-range loop formation. Am. J. Hum. Genet. 2018;102:776–793. doi: 10.1016/j.ajhg.2018.03.001. [DOI] [PMC free article] [PubMed] [Google Scholar]
- 12.Mika K.M., Li X., DeMayo F.J., Lynch V.J. An ancient fecundability-associated polymorphism creates a GATA2 binding site in a distal enhancer of HLA-F. Am. J. Hum. Genet. 2018;103:509–521. doi: 10.1016/j.ajhg.2018.08.009. [DOI] [PMC free article] [PubMed] [Google Scholar]
- 13.Gazal S., Weissbrod O., Hormozdiari F., Dey K.K., Nasser J., Jagadeesh K.A., Weiner D.J., Shi H., Fulco C.P., O’Connor L.J., et al. Combining SNP-to-gene linking strategies to identify disease genes and assess disease omnigenicity. Nat. Genet. 2022;54:827–836. doi: 10.1038/s41588-022-01087-y. [DOI] [PMC free article] [PubMed] [Google Scholar]
- 14.Shendure J., Akey J.M. The origins, determinants, and consequences of human mutations. Science. 2015;349:1478–1483. doi: 10.1126/science.aaa9119. [DOI] [PubMed] [Google Scholar]
- 15.Pääbo S. The human condition-a molecular approach. Cell. 2014;157:216–226. doi: 10.1016/j.cell.2013.12.036. [DOI] [PubMed] [Google Scholar]
- 16.Gokhman D., Mishol N., de Manuel M., de Juan D., Shuqrun J., Meshorer E., Marques-Bonet T., Rak Y., Carmel L. Reconstructing Denisovan anatomy using DNA methylation maps. Cell. 2019;179:180–192.e10. doi: 10.1016/j.cell.2019.08.035. [DOI] [PubMed] [Google Scholar]
- 17.Neubauer S., Hublin J.-J., Gunz P. The evolution of modern human brain shape. Sci. Adv. 2018;4 doi: 10.1126/sciadv.aao5961. [DOI] [PMC free article] [PubMed] [Google Scholar]
- 18.Lesciotto K.M., Richtsmeier J.T. Craniofacial skeletal response to encephalization: How do we know what we think we know? Am. J. Phys. Anthropol. 2019;168(Suppl):27–46. doi: 10.1002/ajpa.23766. [DOI] [PMC free article] [PubMed] [Google Scholar]
- 19.Lieberman D.E., McCarthy R.C. The ontogeny of cranial base angulation in humans and chimpanzees and its implications for reconstructing pharyngeal dimensions. J. Hum. Evol. 1999;36:487–517. doi: 10.1006/jhev.1998.0287. [DOI] [PubMed] [Google Scholar]
- 20.Weaver T.D. Out of Africa: modern human origins special feature: the meaning of neandertal skeletal morphology. Proc. Natl. Acad. Sci. USA. 2009;106:16028–16033. doi: 10.1073/pnas.0903864106. [DOI] [PMC free article] [PubMed] [Google Scholar]
- 21.Martínez-Abadías N., Esparza M., Sjøvold T., González-José R., Santos M., Hernández M., Klingenberg C.P. Pervasive genetic integration directs the evolution of human skull shape. Evolution. 2012;66:1010–1023. doi: 10.1111/j.1558-5646.2011.01496.x. [DOI] [PubMed] [Google Scholar]
- 22.Madeline L.A., Elster A.D. Postnatal development of the central skull base: normal variants. Radiology. 1995;196:757–763. doi: 10.1148/radiology.196.3.7644640. [DOI] [PubMed] [Google Scholar]
- 23.Funato N. New insights into cranial synchondrosis development: A mini review. Front. Cell Dev. Biol. 2020;8:706. doi: 10.3389/fcell.2020.00706. [DOI] [PMC free article] [PubMed] [Google Scholar]
- 24.Haeusler M., Trinkaus E., Fornai C., Müller J., Bonneau N., Boeni T., Frater N. Morphology, pathology, and the vertebral posture of the La Chapelle-aux-Saints Neandertal. Proc. Natl. Acad. Sci. USA. 2019;116:4923–4927. doi: 10.1073/pnas.1820745116. [DOI] [PMC free article] [PubMed] [Google Scholar]
- 25.Schiess R., Boeni T., Rühli F., Haeusler M. Revisiting scoliosis in the KNM-WT 15000 Homo erectus skeleton. J. Hum. Evol. 2014;67:48–59. doi: 10.1016/j.jhevol.2013.12.009. [DOI] [PubMed] [Google Scholar]
- 26.Yagi H., Furutani Y., Hamada H., Sasaki T., Asakawa S., Minoshima S., Ichida F., Joo K., Kimura M., Imamura S.i., et al. Role of TBX1 in human del22q11.2 syndrome. Lancet (London, England) 2003;362:1366–1373. doi: 10.1016/s0140-6736(03)14632-6. [DOI] [PubMed] [Google Scholar]
- 27.Zweier C., Sticht H., Aydin-Yaylagül I., Campbell C.E., Rauch A. Human TBX1 missense mutations cause gain of function resulting in the same phenotype as 22q11.2 deletions. Am. J. Hum. Genet. 2007;80:510–517. doi: 10.1086/511993. [DOI] [PMC free article] [PubMed] [Google Scholar]
- 28.Jaouadi A., Tabebi M., Abdelhedi F., Abid D., Kamoun F., Chabchoub I., Maatoug S., Doukali H., Belghuith N., Ksentini M.A., et al. A novel TBX1 missense mutation in patients with syndromic congenital heart defects. Biochem. Biophys. Res. Commun. 2018;499:563–569. doi: 10.1016/j.bbrc.2018.03.190. [DOI] [PubMed] [Google Scholar]
- 29.Paylor R., Glaser B., Mupo A., Ataliotis P., Spencer C., Sobotka A., Sparks C., Choi C.H., Oghalai J., Curran S., et al. Tbx1 haploinsufficiency is linked to behavioral disorders in mice and humans: Implications for 22q11 deletion syndrome. Proc. Natl. Acad. Sci. USA. 2006;103:7729–7734. doi: 10.1073/pnas.0600206103. [DOI] [PMC free article] [PubMed] [Google Scholar]
- 30.Bassett A.S., Chow E.W.C., Husted J., Weksberg R., Caluseriu O., Webb G.D., Gatzoulis M.A. Clinical features of 78 adults with 22q11 deletion syndrome. Am. J. Med. Genet. 2005;138:307–313. doi: 10.1002/ajmg.a.30984. [DOI] [PMC free article] [PubMed] [Google Scholar]
- 31.Ming J.E., McDonald-McGinn D.M., Megerian T.E., Driscoll D.A., Elias E.R., Russell B.M., Irons M., Emanuel B.S., Markowitz R.I., Zackai E.H. Skeletal anomalies and deformities in patients with deletions of 22q11. Am. J. Med. Genet. 1997;72:210–215. doi: 10.1002/(sici)1096-8628(19971017)72:2<210::aid-ajmg16>3.0.co;2-q. [DOI] [PubMed] [Google Scholar]
- 32.Ricchetti E.T., States L., Hosalkar H.S., Tamai J., Maisenbacher M., McDonald-McGinn D.M., Zackai E.H., Drummond D.S. Radiographic study of the upper cervical spine in the 22Q11.2 deletion syndrome. J. Bone Jt. Surg. 2004;86:1751–1760. doi: 10.2106/00004623-200408000-00020. [DOI] [PubMed] [Google Scholar]
- 33.McDonald-McGinn D.M., Kirschner R., Goldmuntz E., Sullivan K., Eicher P., Gerdes M., Moss E., Solot C., Wang P., Jacobs I., et al. The Philadelphia story: the 22q11.2 deletion: report on 250 patients. Genet. Couns. 1999;10:11–24. [PubMed] [Google Scholar]
- 34.Heliövaara A., Hurmerinta K. Craniofacial cephalometric morphology in children with CATCH 22 syndrome. Orthod. Craniofac. Res. 2006;9:186–192. doi: 10.1111/j.1601-6343.2006.00373.x. [DOI] [PubMed] [Google Scholar]
- 35.Jerome L.A., Papaioannou V.E. DiGeorge syndrome phenotype in mice mutant for the T-box gene, Tbx1. Nat. Genet. 2001;27:286–291. doi: 10.1038/85845. [DOI] [PubMed] [Google Scholar]
- 36.Lindsay E.A., Vitelli F., Su H., Morishima M., Huynh T., Pramparo T., Jurecic V., Ogunrinu G., Sutherland H.F., Scambler P.J., et al. Tbx1 haploinsufficieny in the DiGeorge syndrome region causes aortic arch defects in mice. Nature. 2001;410:97–101. doi: 10.1038/35065105. [DOI] [PubMed] [Google Scholar]
- 37.Hu T., Yamagishi H., Maeda J., McAnally J., Yamagishi C., Srivastava D. Tbx1 regulates fibroblast growth factors in the anterior heart field through reinforcing autoregulatory loop involving forkhead transcription factors. Development. 2004;131:5491–5502. doi: 10.1242/dev.01399. [DOI] [PubMed] [Google Scholar]
- 38.Funato N., Nakamura M., Richardson J.A., Srivastava D., Yanagisawa H. Loss of Tbx1 induces bone phenotypes similar to cleidocranial dysplasia. Hum. Mol. Genet. 2015;24:424–435. doi: 10.1093/hmg/ddu458. [DOI] [PubMed] [Google Scholar]
- 39.Funato N., Srivastava D., Shibata S., Yanagisawa H. TBX1 regulates chondrocyte maturation in the spheno-occipital synchondrosis. J. Dent. Res. 2020;99:1182–1191. doi: 10.1177/0022034520925080. [DOI] [PubMed] [Google Scholar]
- 40.1000 Genomes Project Consortium. Auton A., Brooks L.D., Durbin R.M., Garrison E.P., Kang H.M., Korbel J.O., Marchini J.L., McCarthy S., McVean G.A., Abecasis G.R. A global reference for human genetic variation. Nature. 2015;526:68–74. doi: 10.1038/nature15393. [DOI] [PMC free article] [PubMed] [Google Scholar]
- 41.Rentzsch P., Witten D., Cooper G.M., Shendure J., Kircher M. CADD: predicting the deleteriousness of variants throughout the human genome. Nucleic Acids Res. 2019;47:D886–D894. doi: 10.1093/nar/gky1016. [DOI] [PMC free article] [PubMed] [Google Scholar]
- 42.Ward L.D., Kellis M. HaploReg v4: systematic mining of putative causal variants, cell types, regulators and target genes for human complex traits and disease. Nucleic Acids Res. 2016;44:D877–D881. doi: 10.1093/nar/gkv1340. [DOI] [PMC free article] [PubMed] [Google Scholar]
- 43.Quan C., Ping J., Lu H., Zhou G., Lu Y. 3DSNP 2.0: update and expansion of the noncoding genomic variant annotation database. Nucleic Acids Res. 2022;50:D950–D955. doi: 10.1093/nar/gkab1008. [DOI] [PMC free article] [PubMed] [Google Scholar]
- 44.Boyle A.P., Hong E.L., Hariharan M., Cheng Y., Schaub M.A., Kasowski M., Karczewski K.J., Park J., Hitz B.C., Weng S., et al. Annotation of functional variation in personal genomes using RegulomeDB. Genome Res. 2012;22:1790–1797. doi: 10.1101/gr.137323.112. [DOI] [PMC free article] [PubMed] [Google Scholar]
- 45.ENCODE Project Consortium. Moore J.E., Purcaro M.J., Pratt H.E., Epstein C.B., Shoresh N., Adrian J., Kawli T., Davis C.A., Dobin A., et al. Expanded encyclopaedias of DNA elements in the human and mouse genomes. Nature. 2020;583:699–710. doi: 10.1038/s41586-020-2493-4. [DOI] [PMC free article] [PubMed] [Google Scholar]
- 46.GTEx Consortium Human genomics. The Genotype-Tissue Expression (GTEx) pilot analysis: multitissue gene regulation in humans. Science. 2015;348:648–660. doi: 10.1126/science.1262110. [DOI] [PMC free article] [PubMed] [Google Scholar]
- 47.Dixon J.R., Jung I., Selvaraj S., Shen Y., Antosiewicz-Bourget J.E., Lee A.Y., Ye Z., Kim A., Rajagopal N., Xie W., et al. Chromatin architecture reorganization during stem cell differentiation. Nature. 2015;518:331–336. doi: 10.1038/nature14222. [DOI] [PMC free article] [PubMed] [Google Scholar]
- 48.Yang D., Jang I., Choi J., Kim M.S., Lee A.J., Kim H., Eom J., Kim D., Jung I., Lee B. 3DIV: A 3D-genome Interaction Viewer and database. Nucleic Acids Res. 2018;46:D52–D57. doi: 10.1093/nar/gkx1017. [DOI] [PMC free article] [PubMed] [Google Scholar]
- 49.Tang Z., Li C., Kang B., Gao G., Li C., Zhang Z. GEPIA: a web server for cancer and normal gene expression profiling and interactive analyses. Nucleic Acids Res. 2017;45:W98–W102. doi: 10.1093/nar/gkx247. [DOI] [PMC free article] [PubMed] [Google Scholar]
- 50.Cancer Genome Atlas Research Network. Weinstein J.N., Collisson E.A., Mills G.B., Shaw K.R.M., Ozenberger B.A., Ellrott K., Shmulevich I., Sander C., Stuart J.M. The Cancer Genome Atlas Pan-Cancer analysis project. Nat. Genet. 2013;45:1113–1120. doi: 10.1038/ng.2764. [DOI] [PMC free article] [PubMed] [Google Scholar]
- 51.Fornes O., Castro-Mondragon J.A., Khan A., van der Lee R., Zhang X., Richmond P.A., Modi B.P., Correard S., Gheorghe M., Baranašić D., et al. JASPAR 2020: update of the open-access database of transcription factor binding profiles. Nucleic Acids Res. 2020;48:D87–D92. doi: 10.1093/nar/gkz1001. [DOI] [PMC free article] [PubMed] [Google Scholar]
- 52.Labun K., Montague T.G., Krause M., Torres Cleuren Y.N., Tjeldnes H., Valen E. CHOPCHOP v3: expanding the CRISPR web toolbox beyond genome editing. Nucleic Acids Res. 2019;47:W171–W174. doi: 10.1093/nar/gkz365. [DOI] [PMC free article] [PubMed] [Google Scholar]
- 53.Ran F.A., Hsu P.D., Wright J., Agarwala V., Scott D.A., Zhang F. Genome engineering using the CRISPR-Cas9 system. Nat. Protoc. 2013;8:2281–2308. doi: 10.1038/nprot.2013.143. [DOI] [PMC free article] [PubMed] [Google Scholar]
- 54.Schmittgen T.D., Zakrajsek B.A., Mills A.G., Gorn V., Singer M.J., Reed M.W. Quantitative reverse transcription-polymerase chain reaction to study mRNA decay: comparison of endpoint and real-time methods. Anal. Biochem. 2000;285:194–204. doi: 10.1006/abio.2000.4753. [DOI] [PubMed] [Google Scholar]
- 55.Johnson D.G., Schwarz J.K., Cress W.D., Nevins J.R. Expression of transcription factor E2F1 induces quiescent cells to enter S phase. Nature. 1993;365:349–352. doi: 10.1038/365349a0. [DOI] [PubMed] [Google Scholar]
- 56.Saga Y., Miyagawa-Tomita S., Takagi A., Kitajima S., Miyazaki J. i, Inoue T. MesP1 is expressed in the heart precursor cells and required for the formation of a single heart tube. Development. 1999;126:3437–3447. doi: 10.1242/dev.126.15.3437. [DOI] [PubMed] [Google Scholar]
- 57.Šošić D., Richardson J.A., Yu K., Ornitz D.M., Olson E.N. Twist regulates cytokine gene expression through a negative feedback loop that represses NF-kappaB activity. Cell. 2003;112:169–180. doi: 10.1016/s0092-8674(03)00002-3. [DOI] [PubMed] [Google Scholar]
- 58.Tallquist M.D., Soriano P. Epiblast-restricted Cre expression in MORE mice: a tool to distinguish embryonic vs. extra-embryonic gene function. Genesis. 2000;26:113–115. doi: 10.1002/(sici)1526-968x(200002)26:2<113::aid-gene3>3.0.co;2-2. [DOI] [PubMed] [Google Scholar]
- 59.Caparrós-Martín J.A., Valencia M., Reytor E., Pacheco M., Fernandez M., Perez-Aytes A., Gean E., Lapunzina P., Peters H., Goodship J.A., Ruiz-Perez V.L. The ciliary Evc/Evc2 complex interacts with Smo and controls Hedgehog pathway activity in chondrocytes by regulating Sufu/Gli3 dissociation and Gli3 trafficking in primary cilia. Hum. Mol. Genet. 2013;22:124–139. doi: 10.1093/hmg/dds409. [DOI] [PubMed] [Google Scholar]
- 60.Kheradpour P., Kellis M. Systematic discovery and characterization of regulatory motifs in ENCODE TF binding experiments. Nucleic Acids Res. 2014;42:2976–2987. doi: 10.1093/nar/gkt1249. [DOI] [PMC free article] [PubMed] [Google Scholar]
- 61.Dunham I., Kundaje A., Aldred S.F., Collins P.J., Davis C.A., Doyle F., Epstein C.B., Frietze S., Harrow J., Kaul R., et al. An integrated encyclopedia of DNA elements in the human genome. Nature. 2012;489:57–74. doi: 10.1038/nature11247. [DOI] [PMC free article] [PubMed] [Google Scholar]
- 62.Andirkó A., Moriano J., Vitriolo A., Kuhlwilm M., Testa G., Boeckx C. Temporal mapping of derived high-frequency gene variants supports the mosaic nature of the evolution of Homo sapiens. Sci. Rep. 2022;12:9937. doi: 10.1038/s41598-022-13589-0. [DOI] [PMC free article] [PubMed] [Google Scholar]
- 63.Kou I., Otomo N., Takeda K., Momozawa Y., Lu H.-F., Kubo M., Kamatani Y., Ogura Y., Takahashi Y., Nakajima M., et al. Genome-wide association study identifies 14 previously unreported susceptibility loci for adolescent idiopathic scoliosis in Japanese. Nat. Commun. 2019;10:3685. doi: 10.1038/s41467-019-11596-w. [DOI] [PMC free article] [PubMed] [Google Scholar]
- 64.Zhao Y., Diacou A., Johnston H.R., Musfee F.I., McDonald-McGinn D.M., McGinn D., Crowley T.B., Repetto G.M., Swillen A., Breckpot J., et al. Complete Sequence of the 22q11.2 Allele in 1,053 Subjects with 22q11.2 Deletion Syndrome Reveals Modifiers of Conotruncal Heart Defects. Am. J. Hum. Genet. 2020;106:26–40. doi: 10.1016/j.ajhg.2019.11.010. [DOI] [PMC free article] [PubMed] [Google Scholar]
- 65.Funato N., Nakamura M., Richardson J.A., Srivastava D., Yanagisawa H. Tbx1 regulates oral epithelial adhesion and palatal development. Hum. Mol. Genet. 2012;21:2524–2537. doi: 10.1093/hmg/dds071. [DOI] [PMC free article] [PubMed] [Google Scholar]
- 66.Chapman D.L., Garvey N., Hancock S., Alexiou M., Agulnik S.I., Gibson-Brown J.J., Cebra-Thomas J., Bollag R.J., Silver L.M., Papaioannou V.E. Expression of the T-box family genes, Tbx1-Tbx5, during early mouse development. Dev. Dyn. 1996;206:379–390. doi: 10.1002/(SICI)1097-0177(199608)206:4<379::AID-AJA4>3.0.CO;2-F. [DOI] [PubMed] [Google Scholar]
- 67.Dannemann M., Kelso J. The contribution of Neanderthals to phenotypic variation in modern humans. Am. J. Hum. Genet. 2017;101:578–589. doi: 10.1016/j.ajhg.2017.09.010. [DOI] [PMC free article] [PubMed] [Google Scholar]
- 68.Bidon B., Iltis I., Semer M., Nagy Z., Larnicol A., Cribier A., Benkirane M., Coin F., Egly J.-M., Le May N. XPC is an RNA polymerase II cofactor recruiting ATAC to promoters by interacting with E2F1. Nat. Commun. 2018;9:2610. doi: 10.1038/s41467-018-05010-0. [DOI] [PMC free article] [PubMed] [Google Scholar]
- 69.Rodriguez-Bravo V., Pippa R., Song W.M., Carceles-Cordon M., Dominguez-Andres A., Fujiwara N., Woo J., Koh A.P., Ertel A., Lokareddy R.K., et al. Nuclear pores promote lethal prostate cancer by increasing POM121-driven E2F1, MYC, and AR nuclear import. Cell. 2018;174:1200–1215.e20. doi: 10.1016/j.cell.2018.07.015. [DOI] [PMC free article] [PubMed] [Google Scholar]
- 70.Wall J.D., Yang M.A., Jay F., Kim S.K., Durand E.Y., Stevison L.S., Gignoux C., Woerner A., Hammer M.F., Slatkin M. Higher levels of neanderthal ancestry in East Asians than in Europeans. Genetics. 2013;194:199–209. doi: 10.1534/genetics.112.148213. [DOI] [PMC free article] [PubMed] [Google Scholar]
- 71.Vernot B., Akey J.M. Complex history of admixture between modern humans and Neandertals. Am. J. Hum. Genet. 2015;96:448–453. doi: 10.1016/j.ajhg.2015.01.006. [DOI] [PMC free article] [PubMed] [Google Scholar]
- 72.Kim B.Y., Lohmueller K.E. Selection and reduced population size cannot explain higher amounts of Neandertal ancestry in East Asian than in European human populations. Am. J. Hum. Genet. 2015;96:454–461. doi: 10.1016/j.ajhg.2014.12.029. [DOI] [PMC free article] [PubMed] [Google Scholar]
- 73.Fu Q., Hajdinjak M., Moldovan O.T., Constantin S., Mallick S., Skoglund P., Patterson N., Rohland N., Lazaridis I., Nickel B., et al. An early modern human from Romania with a recent Neanderthal ancestor. Nature. 2015;524:216–219. doi: 10.1038/nature14558. [DOI] [PMC free article] [PubMed] [Google Scholar]
- 74.Nalley T.K., Grider-Potter N. Functional analyses of the primate upper cervical vertebral column. J. Hum. Evol. 2017;107:19–35. doi: 10.1016/j.jhevol.2017.03.010. [DOI] [PubMed] [Google Scholar]
- 75.Boeckx C. The language-ready head: Evolutionary considerations. Psychon. Bull. Rev. 2017;24:194–199. doi: 10.3758/s13423-016-1087-5. [DOI] [PMC free article] [PubMed] [Google Scholar]
- 76.Steele J., Clegg M., Martelli S. Comparative morphology of the Hominin and African ape hyoid bone, a possible marker of the evolution of speech. Hum. Biol. 2013;85:639–672. doi: 10.3378/027.085.0501. [DOI] [PubMed] [Google Scholar]
- 77.Goodship J., Cross I., Scambler P., Burn J. Monozygotic twins with chromosome 22q11 deletion and discordant phenotype. J. Med. Genet. 1995;32:746–748. doi: 10.1136/jmg.32.9.746. [DOI] [PMC free article] [PubMed] [Google Scholar]
Associated Data
This section collects any data citations, data availability statements, or supplementary materials included in this article.
Supplementary Materials
Data Availability Statement
The cephalometric data from individuals with DGS/VCFS was collected in a clinical setting. Individual-level cephalometric measurements are not available due to current data protection legislation. The published article includes all other datasets generated or analyzed during this study.