

Abstract
Urinary extracellular vesicles (uEVs) are rich in valuable biomolecule information which are increasingly recognized as potential biomarkers for various diseases. uEV long RNAs are among the critical cargos capable of providing unique transcriptome information of the source cells. However, consensus regarding ideal reference genes for relative long RNAs quantification in uEVs is not available as of date. Here we explored stable reference genes through profiling the long RNA expression by RNA‐seq following unsupervised analysis and validation studies. Candidate reference genes were identified using four algorithms: NormFinder, GeNorm, BestKeeper and the Delta Ct method, followed by validation. RNA profile showed uEVs contained abundant long RNAs information and the core transcriptome was related to cellular structures, especially ribosome which functions mainly as translation, protein and RNA binding molecules. Analysis of RNA‐seq data identified RPL18A, RPL11, RPL27, RACK1, RPSA, RPL41, H1‐2, RPL4, GAPDH, RPS27A as candidate reference genes. RT‐qPCR validation revealed that RPL41, RPSA and RPL18A were reliable reference genes for long RNA quantification in uEVs from patients with diabetes mellitus (DM), diabetic nephropathy (DN), IgA nephropathy (IgAN) and prostate cancer (PCA). Interestingly, RPL41 also outperformed traditional reference genes in renal tissues of DN and IgAN, as well as in plasma EVs of several types of cancers. The stable reference genes identified in this study may facilitate development of uEVs as novel biomarkers and increase the accuracy and comparability of biomarker studies.
Keywords: long RNAs, reference genes, RNA sequencing, RT‐qPCR, urinary extracellular vesicles

1. INTRODUCTION
Extracellular vesicles (EVs) represent a heterogeneous group of bilayer membrane nanoparticles that can be released by almost any cell (Merchant et al., 2017). They are present in nearly all body fluids, including urine and blood (Cheng et al., 2014; Pisitkun et al., 2004). EVs are enriched in selected proteins, nucleic acids and lipids from their origin cells and play crucial roles in cell signalling and communication in pathophysiological settings (Pegtel & Gould, 2019). Urinary EVs (uEVs) have generally been considered to originate largely from epithelial lines the nephron and urinary tract which may carry biomarkers of urinary disorders, and consequently gained significant interest as potential fluid‐biopsy tool (Erdbrügger et al., 2021). Besides, uEVs also are emerging as sources of biomarkers for other non‐urinary system and malignance's diseases (Wang et al., 2019; Yasui et al., 2017). Among the EV content, RNAs have attracted increasing interest due to their high stability owing to protection of the vesicle structure (Miranda et al., 2010). In recent years, uEV RNAs have been reported as potential biomarkers for various urologic diseases. uEV PCA3 and ERG mRNAs are efficient in discriminating patients as high‐risk for prostate cancer (PCA) on initial biopsy, which has been extensively validated in prospective multi‐centre studies and approved by the Food and Drug Administration (FDA) (McKiernan et al., 2018, 2016). RNA profiles of EVs are also powerful tools for disease diagnosis as well as monitoring of the progression (He et al., 2021; Luo et al., 2022). He et al. used RNA sequencing to identify candidate circRNAs from uEVs and built a uEV circRNA classifier, which plus risk calculators was statistically more predictive for high‐grade PCA (He et al., 2021).
Undoubtedly, the accurate quantification of nucleic acids within EVs is critical in exploring EV RNAs as biomarkers. According to the position paper by International Society for Extracellular Vesicles (ISEV), methodological aspects need further optimization and standardization to foster advances in uEV research (Erdbrügger et al., 2021). The lack of standardization of methods for RNA isolation and quantification is one of the main challenges (Das et al., 2019). Selecting appropriate endogenous reference genes to correct for nonbiological variation is a basic prerequisite for accurate quantification of RNA transcripts (Bustin et al., 2009). Therefore, there is an urgent need to identify suitable reference genes for uEV research.
The ideal reference genes should exhibit constitutively stable expression independent of biological variations or disease stages (Vandesompele et al., 2002).The common reference genes used for standardizing gene expression in EVs include β‐actin, GAPDH and U6, taking from tissue or cell lines research (Huang et al., 2020; Wu et al., 2021; Zhan et al., 2018). However, accumulating evidence has shown that the expression level of these classic reference genes may fluctuate markedly in EVs and are unsuitable for standardization purposes (Dai et al., 2021; Gouin et al., 2017). Therefore, searching for new reference genes is the premise to accelerate the pace of RNA biomarker study in uEVs. Previous studies have evaluated suitable reference genes for microRNA quantitation in EVs from different types of cells and tissues (Hildebrandt et al., 2021). However, studies about the reference genes for long RNAs in uEVs are still very limited. Diabetic nephropathy (DN) is a devastating complication in patients with diabetes mellitus (DM) which is the leading cause of chronic kidney disease worldwide (Doshi & Friedman, 2017). The quest for novel biomarkers for early diagnosis and prognosis has received intense interest in recent years (Colhoun & Marcovecchio, 2018). uEVs may represent a new approach of searching novel biomarkers for DN.
Here we aimed to characterize the long RNA profile within uEVs from healthy controls, DM and DN patients, and explored reference genes that are reliable for the analysis of gene expression changes. Unsupervised analysis of long RNA‐Seq dataset was performed, followed by validation in other diseases of urinary system, as well as renal tissues and plasma EVs samples of different cancers using real time quantitative polymerase chain reaction (RT‐qPCR) and gene expression data. We identified that ribosomal protein genes, RPL41, RPSA and RPL18A are stable reference genes for long RNAs in urine EVs. Importantly, those reference genes are also stable in tissues and plasma EVs dependent on the specific disease conditions, indicating their application potential in EVs biomarker study.
2. MATERIALS AND METHODS
2.1. Patients and controls
All of the studies were approved by the Ethical Committee of Affiliated Zhongda Hospital of Southeast University. Clinic information was acquired from the medical record system of Zhongda Hospital Southeast University. Written informed consent was obtained from all of the subjects to use their urine for research purposes.
In the next generation sequencing (NGS) cohort, 14 healthy controls (HC), 16 patients with diabetes mellitus (DM) and 10 patients with biopsy‐proven diabetic nephropathy (DN) were enrolled. In the validation study, another independent cohort of 37 healthy control individuals, 35 DM and 34 DN patients were included. Besides, other common primary glomerulopathies including 30 IgA nephropathy (IgAN), 35 membranous nephropathy (MN) as well as 26 patients with prostate cancer (PCA) were included. The exclusion criteria were as follows: patients with severe liver injury, cancer, severe complications of cardiovascular disorder, urinary tract infection and renal replacement therapy.
2.2. uEVs isolation and characterization
The first morning urinary samples were collected from patients with DM, DN, IgAN, MN, PCA and healthy controls, followed by EV purification using differential ultracentrifugation as described previously (Tataruch‐Weinert et al., 2016). In brief, urine supernatant was thawed and swirled for 90 s to increase EV recovery, and then centrifuged at 17,000 g for 20 min at 4°C. Sodium citrate and EDTA with final concentrations of 50 and 8 mM, respectively were added to the supernatant to prevent the formation of calcium oxalate crystals. Then the samples were ultracentrifuged at 150,000 × g for 2 h (Type 70 Ti rotor, Optima XPN‐100, Beckman Coulter, USA) at 4°C. Moreover, the EV pellets were washed with 0.01 M phosphate buffered brine (PBS) (pH 7.4) by repeated ultracentrifugation. Finally, the pellets were resuspended in PBS and stored at −80°C for subsequent applications.
For EV characterization, uEVs were observed by electron microscope. Briefly, the purified EVs were diluted five times with PBS and then applied to 200‐mesh nickel grids. Samples were stained with 2% phosphotungstic acid for 5 min and dried at room temperature. EVs were examined using a transmission electron microscope (JEM1200EX, Japan) at 100 kV. Nanoparticle tracking analysis (NTA) was performed using the ZetaView PMX 110 (Particle Metrix, Meerbusch, Germany). Sample parameters: Temperature: 19.05°C; pH: 7.0; Conductivity: 32.04 μS/cm; Instrument parameters: Laser Wavelength: 488 nm; Filter Wavelength: Scatter; Measurement Parameters: Cell S/N: ZNTA; Analysis Parameters: Max Area: 1000, Min Area: 5, Min Brightness: 20. Briefly, purified EVs were appropriately diluted using 1× PBS buffer and the particle size and concentration were measured. The corresponding software, ZetaView 8.04.02, analysed collected data from the ZetaView. Resuspension volumes and dilution factors were used to convert the yield from concentration to an accurate number of particles.
For western blotting analysis, isolated EVs from equal volume of urine were lysed in RIPA Lysis Buffer (Beyotime, China) with 1% protease inhibitor (Beyotime, China). Then samples were loaded on 10% SDS‐PAGE, followed by transferring to the PVDF membrane (Millipore, USA). The membrane was blocked with 5% milk in TBST for 2 h and incubated overnight with primary antibodies as follows: anti‐Alix (1:500, sc‐53540, Santa Cruz), anti‐CD63 (1:2000, ab134045, Abcam), CD9 (1:2000, 60232‐1‐Ig, Proteintech). Secondary HRP‐conjugated antibodies (anti‐mouse IgG, anti‐rabbit IgG) and enhanced chemiluminescence detection reagents were applied for detection by an ECL advanced system (GE Healthcare).
2.3. RNA isolation of uEVs and next generation sequencing
We have developed an optimal strategy to extract and sequence EV long RNAs which include mRNA, lncRNA longer than 200 nt (Lai et al., 2022). Total RNA extraction was performed using TRIzol (Vazyme, China) according to the manufacturer´s instructions and eluted in 20 μL of RNase‐free water. To confirm that non‐vesicle RNAs were not included in the EVs samples, we treated uEVs with 10 μg/mL proteinase K for 30mins at 37°C or 0.1 μg/μL RNase A for 10 mins at 37°C before RNA isolation. According to the improved strategy of preparing EV RNA‐seq library proposed by Li et al. (Li et al., 2019), we treated all RNAs extracted from uEVs with DNase I (NEB, Ipswich, Massachusetts, USA) to remove residual DNAs. The purified RNAs were fragmented and used to prepare strand‐specific sequencing library with SMARTer® Stranded Total RNA‐Seq Kit—Pico Input Mammalian (Clontech, USA). ZapR and R‐Probes were used to eliminate ribosomal cDNAs. The quality of RNA‐seq library was then evaluated by Qubit fluorometer (Thermo Fisher Scientific, USA) and Qsep100 (BiOptic, China), and the libraries were sequenced by Illumina sequencing platform (San Diego, USA) on a 150 bp paired‐end run. Subsequently, the qualified sequencing reads were screened by FastQC (version 0.11.8) and mapped to the human genome (GRCh38) with ‘two‐pass’ mode using the RNA‐seq aligner STAR (version 2.7.1a) (Dobin et al., 2013). Finally, we quantified the expression levels of genes annotated with GENCODE V29 by FeatureCounts (version 1.6.3) and normalized into transcripts per kilobase million (TPM). The Genome Sequence Archive accession number for RNA‐seq data is PRJNA1021334 (https://dataview.ncbi.nlm.nih.gov/object/PRJNA1021489).
2.4. Real time quantitative polymerase chain reaction (RT‐qPCR)
cDNAs were reverse transcribed using 5× HiScript III qRT SuperMix (Vazyme, China). RT‐qPCR was performed with ChamQ SYBR qPCR Master Mix (Vazyme, China) and QuantStudio5 Cycler (Applied Biosystems, USA). The total volume for qPCR is 10 μL per reaction, including 5 μL SYBR Green Master Mix, 0.2 μL forward primer (10 mM), 0.2 μL reverse primer (10 mM), 3.6 μL RNase free ddH2O and 1 μL DNA sample. Cycling conditions were set as follows: Hot start step at 95°C for 5 mins (recommended by the PCR reagent manufacture), 40 cycles of 95°C denaturation step for 10 s plus 60°C annealing/elongation step for 30 s, finally dissociation step at 95°C for 15 s, 60°C for 60 s and 95°C for 15 s followed by fluorescence plate read. Primer sequences and the products length for RT‐qPCR were shown in Table 1.
TABLE 1.
Primer sequences for RT‐qPCR for candidate reference genes.
| Gene name | Forward (5′−3′) | Reverse (5′−3′) | Ampilcon size (bp) |
|---|---|---|---|
| Homo RPL18A | ACCCAGTGCTACCGAGACAT | AGTCGTGGAACTGCTTGACA | 124 |
| Homo RPL11 | TGGGTAGGCCAGGTTTCAGC | GCCTCCTCTTTGCTGATTCTGT | 85 |
| Homo RPL27 | CTACCCCCGCAAAGTGACAG | ACGACAGTTTTGTCCAAGGG | 144 |
| Homo RACK1 | TGTCTTGTGTCCGCTTCTCG | ATAGCCTGTGTGGCCAATGT | 131 |
| Homo RPSA | GCTCGTGCAATTGTTGCCAT | CAAACTTCAGCACAGCCCTC | 88 |
| Homo RPL41 | TTCATCGCCCTCTGATCGC | CAGAATGTCACAGGTCCAGGG | 96 |
| Homo H1‐2 | ACTCTGGTGCAAACGAAAGG | CTTAGGTTTGGTTCCGCCCG | 114 |
| Homo RPL4 | GGAACACCATTCTTCGCCAG | ATTTGGCTTGTAGTGCCGCT | 84 |
| Homo RPS27A | TGTTGAGACTTCGTGGTGGTG | CGAAGGCGACTAATTTTGCCAT | 145 |
| Homo GAPDH | CTCTGCTCCTCCTGTTCGAC | GCGCCCAATACGACCAAATC | 121 |
| Homo ACTB | AGCGAGCATCCCCCAAAGTT | GGGCACGAAGGCTCATCATT | 285 |
2.5. Bioinformatics
For Gene Ontology (GO) analysis, the functional annotation tool available within DAVID Website (http://david.abcc.ncifcrf.gov/) was used. Heatmap and enrichment bubble diagram were plotted by https://www.bioinformatics.com.cn, an online platform for data analysis and visualization.
2.6. Candidate reference genes identification
To identify stable reference genes, we evaluated next‐generation sequencing data from uEV samples. Candidate reference genes were analysed using four algorithms for gene stability evaluation: NormFinder (Andersen et al., 2004), GeNorm (Vandesompele et al., 2002), BestKeeper (Pfaffl et al., 2004) and the comparative Delta Ct method (Silver et al., 2006), The four algorithms used here were provided by a web‐based tool RefFinder, which was developed for assessing and screening reference genes from extensive experimental datasets. The geometric mean (geomean) of each gene ranking across various methods was eventually calculated, leading to a consensus stability score. The reference gene with final lowest value were considered as the most stable (Xie et al., 2012). A link to the web‐based software could be found at: http://heartcure.com.au.
2.7. Statistical analysis
Data are expressed as mean ± standard deviation (SD). A two‐tailed unpaired Student's t‐test or Mann–Whitney U test was used for comparison between two groups, and one‐way ANOVA was performed for comparisons of data with more than two groups for multiple comparisons. The combined value of the candidate reference genes is calculated using the geometric mean (Vandesompele et al., 2002). Statistical analysis was performed using GraphPad Prism 7.0 (GraphPad Software, USA). Differences with p < 0.05 were considered as statistically significant (*, p < 0.05; **, p < 0.01; ***, p < 0.001; ****, p < 0.0001).
3. RESULTS
3.1. Clinical characteristics and characterization of urinary EVs
For reference gene identification and validation, the long RNA transcriptome was profiled with next‐generation deep sequencing (RNA‐seq) from uEVs isolated from healthy individuals, DM and DN patients. Based on the gene abundance and stability assessed by four algorithms for reference gene evaluation with the long RNA‐seq data, 10 candidate reference genes were selected, which were then validated using RT‐qPCR by using uEVs derived from various diseases of urinary system. Gene expression data of renal tissues and plasma EV samples from different cancers were also included for validation. The detailed workflow diagram for the selection and validation of reference genes was shown in Figure 1a.
FIGURE 1.

Workflow diagram for identification of stable reference genes and characterization of uEVs. (a) Reference genes were screened from long RNA‐seq data. Identification of candidate reference genes was performed using the four algorithms: NormFinder, GeNorm, BestKeeper and the comparative Delta Ct method. The diagram was created with BioRender.com. (b) Representative electron micrograph of uEVs. Scale bars, 500 and 100 nm. (c) Western blotting analysis of EV‐associated markers (Alix, CD63 and CD9) in uEVs. (d–f) The size of uEVs analyzed by NTA. NTA, nanoparticle tracking analysis.
For screening cohort, patient demographics and baseline characteristics including age, gender, total cholesterol and triglyceride were matched among healthy controls, DM and DN groups. DN patients showed lower level of estimate glomerular filtration rate (eGFR, mean (Erdbrügger et al., 2021), 70.76 [28.64] mL/min/1.73 m2), higher levels of serum creatinine (SCr, mean (Erdbrügger et al., 2021), 104.4 [32.14] umol/L) compared to both healthy controls and T2DM patients. Clinical and laboratory characteristics of the validation cohort are summarized in Table 2. The demographic and baseline characteristics were similar between patients and healthy controls. Compared to HC, patients with DN and IgAN displayed higher level of SCr, lower levels of plasma albumin and eGFR.
TABLE 2.
Clinic characteristics of validation cohort.
| Group | HC | DM | DN | IgAN | MN | PCA | p‐value* |
|---|---|---|---|---|---|---|---|
| N | 37 | 35 | 34 | 30 | 35 | 26 | |
| Age (y) | 52.892 ± 15.509 | 59.857 ± 12.788 | 56.500 ± 11.738 | 42.344 ± 14.187 | 53.353 ± 14.649 | 71.519 ± 6.167 | <0.001 |
| Albumin (g/L) | 44.262 ± 3.747 | 39.237 ± 4.282 | 33.235 ± 6.843 | 38.725 ± 3.600 | 25.982 ± 7.716 | 38.348 ± 3.374 | <0.001 |
| TC (mmol/L) | 4.616 ± 0.683 | 4.290 ± 0.806 | 4.707 ± 1.454 | 4.378 ± 1.096 | 6.479 ± 2.179 | 4.226 ± 1.159 | <0.001 |
| Scr (umol/L) | 60.459 ± 12.139 | 63.343 ± 13.099 | 235.721 ± 185.616 | 72.812 ± 44.113 | 98.824 ± 84.597 | 77.074 ± 13.433 | <0.001 |
| eGFR (mL/min) | 106.251 ± 11.450 | 102.070 ± 14.503 | 43.397 ± 29.661 | 94.258 ± 41.502 | 86.566 ± 31.466 | 89.673 ± 15.290 | <0.001 |
| BUN (mmol/L) | 5.076 ± 1.038 | 5.583 ± 1.164 | 5.976 ± 0.838 | 8.162 ± 4.333 | 8.715 ± 4.070 | 5.170 ± 1.183 | <0.001 |
| UA (umol/L) | 299.730 ± 76.351 | 295.400 ± 80.370 | 316.765 ± 43.394 | 358.781 ± 102.851 | 343.176 ± 81.038 | 295.963 ± 81.585 | 0.01 |
| Gender (%) | – | ||||||
| Male | 17 (45.946%) | 21 (60.000%) | 24 (70.588%) | 18 (56.250%) | 27 (79.412%) | 27 (100.000%) | |
| Female | 20 (54.054%) | 14 (40.000%) | 10 (29.412%) | 14 (43.750%) | 7 (20.588%) | 0 (0.000%) |
Notes: Clinic characteristics of validation cohort. eGFR has been calculated using the CKD‐EPI Creatinine formula (mL/s per 1.73 m2). Values are expressed as median (IQR) (*p < 0.05, **p < 0.01, ***p < 0.001, ****p < 0.0001 compared with healthy controls; #p < 0.05, ##p < 0.01, ####p < 0.0001 compared with T2DM).
Abbreviations: BUN, blood urea nitrogen; SCr, serum creatinine; UA, uric acid; eGFR, estimated glomerular filtration rate; DM, diabetes mellitus; DN, diabetic nephropathy; IgA, nephropathy; MN, membranous nephropathy; PCA, prostate cancer.
A typical size and shape of uEVs with membrane structures were shown by transmission electron microscopy (TEM) (Figure 1b). Western blot analysis detected the expression of EV protein markers including Alix, CD63 and CD9 in isolated pellets indicating that exosomes constitute the main fraction of EVs (Figure 1c). Nanoparticle tracking analysis (NTA) revealed that Isolated particles from HC, DM and DN had a mean diameter of 135.0 ± 65.6, 145.0 ± 86.1 and 145.0 ± 69.2 nm, respectively (Figure 1d‐f).
3.2. The expression profile of long RNAs in uEVs
To compare the number of long RNAs detected in each group, long RNAs with TPM > 0.1 detected in more than 10% subjects were counted. Increasing number of long RNAs was observed in DM and DN patients compared to healthy controls, the number of mRNAs was about three times that of lncRNAs. Additionally, a total of 4124 lncRNAs and 15,373 mRNAs were overlapped in all three groups, demonstrating that uEVs were rich in long RNAs and there was a significant increasing of long RNAs numbers in DN and diabetes conditions (Figure 2a).
FIGURE 2.

Long RNA profile of uEVs. (a) The number of long RNAs expressed by healthy controls (n = 14), DM (n = 16) and DN (n = 10) group. Data are presented as means ± SD.***p < 0.001. Kruskal‐Wallis test was applied to compare the three groups. (b) Core transcriptome defined from top 100 genes as show by Venn diagram. The diagram was created with BioRender.com. (c) The heatmap showed expression levels of the top 84 common genes expressed in three groups. (d) The 10 most significantly enriched GO terms in the BP, CC and MF categories were presented. FDR < 0.05 was regarded as enriched GO categories. GO, gene ontology; BP, biological process; CC, cellular component; MF, molecular function.
Next, we explored the core transcriptome of uEVs in healthy individuals compare to DM and DN patients. Interestingly, among the top 100 genes, 84 genes were overlapped, indicating the large proportion of core gene content in uEVs (Figure 2b). The 84 transcripts common to all groups were considered as the ‘core transcriptome’. Further, we observed more than 50% of the genes showed high expression level of above 1000 TPM. Interestingly, among the ‘core transcriptome’, we noticed 39 genes belong to ribosome protein family. The top 5 abundant transcript was ferritin light chain (FTL), followed by ferritin heavy chain (FTH1), ribosomal protein L13a (RPL13A), eukaryotic translation elongation factor 1 alpha 1 (EEF1A1) and ribosomal protein L19 (RPL19) (Figure 2c).
To understand the characteristic of top common transcripts, global gene ontology (GO) analysis was performed with the 84 core genes. The top 10 enriched GO categories in biological process, cellular component, and molecular function were shown in Figure 2d. Interestingly, the enriched biological functions of the top common transcripts were related to translation, rRNA processing, ribosomal large subunit assembly. Regarding the cellular component, those genes were related to cytosol and cytoplasm, and 62% of the mRNAs were associated with the cellular component term ‘extracellular exosome’, and other major components include nucleus, membrane and cytosolic ribosome. In terms of molecular function, we identified 10 enriched terms, such as protein binding, RNA binding, structural constituent of ribosome, cadherin binding. Therefore, core transcriptome was present in uEVs related to different part of cellular structures, among which the majority were related to ribosome and function as translation, protein and RNA binding molecules.
3.3. Identification of candidate reference genes by an unbiased analysis of long RNA‐Seq dataset
To explore suitable reference genes in uEVs, 96 genes with abundant expression (TPM>500) in HC, DM and DN groups were firstly selected, and 52 genes were then identified with no differential expression in the three groups. Subsequently, the expression stability of them and classical reference gene GAPDH and β‐actin were evaluated using NormFinder, GeNorm, BestKeeper and the Delta Ct method.
The results of the NormFinder method were similar as those of the Delta Ct algorithm. Ribosomal protein L11 (RPL11), ribosomal protein L18a (RPL18A), ribosomal protein SA (RPSA) and receptor for activated C kinase 1 (RACK1) were identified as the top stable genes, while GAPDH and β‐actin were more fluctuated (Figure 3a, b). BestKeeper and GeNorm algorithms yielded slightly different results. Traditional reference genes were no longer the most variable, but they still laid close to the bottom of the ranks (Figure 3c, d). The geometric mean (geomean) of each gene ranking across the four methods was eventually calculated, leading to a comprehensive stability score. The reference genes with lowest value were considered as the most stable (Figure 3e). Under this combinational analysis, RPL18A, RPL11, ribosomal protein L27 (RPL27), RACK1, RPSA, ribosomal protein L41 (RPL41), H1.2 linker histone, cluster member (H1‐2), ribosomal protein L4 (RPL4), GAPDH and ribosomal protein S27a (RPS27A) were identified as the most stable genes, which were thereby chosen as the candidate reference genes in our validation study. Overall, all candidate reference genes except RPS27A showed greater stability than classical reference genes. Moreover, the abundance of candidates was comparable to the expression level of classical housekeeping genes (Figure 3f).
FIGURE 3.
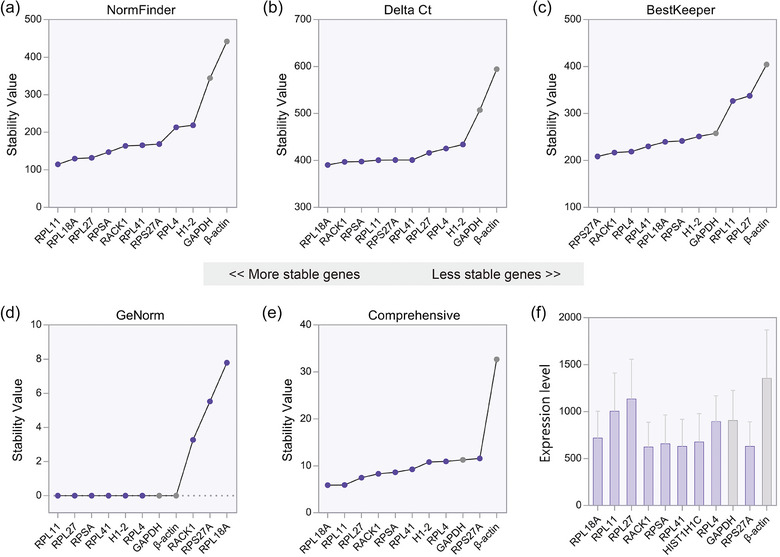
The expression levels and stability of candidate reference genes identified by next‐generation long RNA sequencing. Long RNA‐Seq dataset were analyzed through (a) NormFinder, (b) Delta Ct, (c) BestKeeper and (d) GeNorm method. (e) The geomean of each gene weight was calculated to provide a comprehensive rank of candidate reference genes. (f) The abundance (transcripts per million, TPM) of candidate reference genes and classical reference genes.
3.4. Validation of candidate reference genes in uEVs
RT‐qPCR was performed to validate the stability of reference candidates in another independent cohort of subjects. As a result, RPL11, RPL41 and RPL27 showed the highest expression. However, we observed statistical differences in the expression levels of RPL11, RPL27, RACK1 and RPL4 among different groups, which were not considered for further analysis (Figure 4a). The detection rate of each gene was calculated, defined as the proportion of subjects whose expression was detectable by the RT‐qPCR. The detection rates of RPL41, RPSA and RPS27A were all 100%, while the other four genes varied 97%−99% (Figure 4b). It was worth noting that the expression level and detection rate of RPL41, RPSA, RPS27A and RPL18A were better than those of traditional reference genes.
FIGURE 4.

Experimental validation of candidate reference genes in uEVs. (a) Expression levels and (b) detection rate (Ct values) of candidate reference genes in uEVs from HC (n = 37), DM (n = 35) and DN (n = 34) detected by RT‐qPCR. (c) The weighted geomean of four algorithms was taken to provide a comprehensive ranking of the most stable genes. (d) The expression level and comprehensive score for stability of candidate reference genes in uEVs from IgAN (n = 16). (e) The expression level of candidate reference genes in uEVs from MN (n = 16). (f) The expression level and comprehensive score for stability of candidate reference genes in uEVs from PCA (n = 13). Gene expression data of uEVs from RCC were derived from GEO database (http://www.ncbi.nlm.nih.gov/geo/). (g) The expression level and comprehensive score for stability of candidate reference genes in uEVs from RCC (n = 12, GSE72922). Data are presented as means ± SD. *p < 0.05, **p < 0.01, ****p < 0.0001. One‐way ANOVA (a), Mann‐Whitney test (d–g). HC, healthy controls; DM, diabetes mellitus; DN, diabetic nephropathy; IgAN, IgA nephropathy; MN, membranous nephropathy; PCA, prostate cancer; RCC, renal cell carcinoma.
Similarly, four algorithms (BestKeeper, GeNorm, NormFinder and the comparative Delta Ct method) were run to rank the stability of the selected reference genes (Figure S1a‐d). Reference gene analysis showed similar results by using the BestKeeper, Delta Ct and GeNorm methods, which confirmed RPL41 as the most stable candidates followed by RPSA as shown in the comprehensive stability score. β‐actin and GAPDH showed the worst performance compared to other candidates (Figure 4c). Finally, considering the expression level, detection rate and stability, RPL41 emerged as the most suitable candidate, followed by RPSA and RPL18A. Moreover, we treated urine EVs with proteinase K or RNase A to observe the changes of the expression of reference gene. It turned out that no significant difference in the level of GAPDH, RPL41, RPSA and RPL18A among control, proteinase K and RNase A treatment groups (Figure S1h). The results confirmed that non‐vesicle RNAs were not included in the EVs samples. Taken together, RPL41 was validated as reliable endogenous normalizer followed by RPSA and RPL18A through RT‐qPCR data from uEVs of HC, DM and DN.
To explore the application of RPL41, RPSA and RPL18A as reference genes in other conditions, we next attempted to validate the selected reference genes in uEVs from common primary glomerular disease, IgAN and MN. RPSA and GAPDH display differential expression between HC and IgAN. Interestingly, RPL18A, RPL41 and RPSA were identified as more stable genes compared to GAPDH, indicating that they might be more suitable reference genes than GAPDH (Figure 4d, Figure S1e). However, differences in the expression levels of the four genes except RPL41 were observed in uEVs of MN compared to HC, suggesting that RPL41 were appropriate as endogenous controls (Figure 4e).
Due to the diagnostic potential of uEVs in urinary disorders, we next evaluate the application of candidate reference genes in uEVs of prostate cancer (PCA) as detected by RT‐PCR and renal cell carcinoma (RCC) using available gene expression array data from GEO (http://www.ncbi.nlm.nih.gov/geo/). The expression levels of the three candidate genes were not different between HC and PCA, whereas the down‐regulation of GAPDH and β‐actin was observed, indicating that RPL41, RPSA and RPL18A were more stable than traditional reference genes. Moreover, the comprehensive rank order exhibited that RPL18A was the most stable gene (Figure 4f, Figure S1f). For RCC, no difference in the expression of the five genes was found compared to HC, and, traditional reference genes showed greater stability in uEVs of RCC (Figure 4g, Figure S1g).
To further validate whether the use of these three candidate genes as a combined internal reference could enhance stability, we conducted additional validation of the combined internal reference within cohorts of IgAN, MN and PCA. The results indicated that while no differences were observed in the geometric mean of the candidate reference genes in IgAN group compared to controls, variances were exhibited in both the MN and PCA groups, suggesting that the use of combined candidate genes does not necessarily provide extra stability across different disease cohorts.
Overall, the three candidate reference genes (RPL41, RPSA and RPL18A) outperform traditional reference genes for IgAN and PCA, while they might not be as stable as the traditional reference genes in other diseases such as MN and RCC. This observation revealed that the expression stability of reference genes was dependent on disease condition.
3.5. The stability of the candidate reference genes in renal tissues and plasma EVs
To get insight into the expression of these candidate reference genes in the tissue, the gene expression data from Gene Expression Omnibus (GEO, http://www.ncbi.nlm.nih.gov/geo/) database was analysed. There was no difference in the expression of the five genes in renal tissues between HC and DN. It was noteworthy that RPL41 and PRL18A were stable than traditional reference genes (Figure 5a, Figure S2a). In IgAN conditions, RPL41 again showed the highest expression level and stability in renal tissues (Figure 5b, Figure S2b). No difference was found for renal traditional reference genes between HC and MN, whereas RPL41 was upregulated, indicating that traditional reference genes were more suitable as reference genes for renal tissues in MN which was consistent with the findings in uEVs (Figure 5c). Similarly, differences in the expression of RPL41, RPL18A and β‐actin were found in renal tissues of RCC, while GAPDH was identified as the most stable reference gene (Figure 5d, Figure S2c). Put together, the stability of reference genes in renal tissues was in line with that of uEVs in corresponding diseases. The expression stability of RPL41 in renal tissue of patients with DN and IgAN was higher than that of traditional reference genes, further proving the superiority of RPL41 as reference genes.
FIGURE 5.

The stability of the candidate reference genes in renal tissues and plasma EVs. Gene expression data of renal tissues were derived from GEO database (http://www.ncbi.nlm.nih.gov/geo/). (a) The expression level and comprehensive score for stability of candidate reference genes in renal tissues of DN (n = 18, GSE162830). (b) The expression level and comprehensive score for stability of candidate reference genes in renal tissues of IgAN (n = 31, GSE35489). (c) The expression level of candidate reference genes in renal tissues of MN (n = 51, GSE200828). (d) The expression level and comprehensive score for stability of candidate reference genes in renal tissues of RCC (n = 12, GSE76351). The RNA‐seq data of plasma EVs were derived from exoRBase database (http://www.exorbase.org). (e, f) Expression levels of candidate genes in plasma EVs of 13 cancers (n = 739) compared with healthy control (n = 118), respectively (http://www.exorbase.org). (g) The comprehensive score for stability of candidate reference genes in plasma EVs of benign, CRC, ML, GC, HCC and KIRC. Data are presented as means ± SD. *p < 0.05, **p < 0.01, ***p < 0.001, ****p < 0.0001, Mann‐Whitney test. HC, healthy controls; CRC, colorectal cancer; ML, malignant lymphoma; GC, gastric cancer; ESCC, esophageal squamous cell carcinoma; BRCA, breast cancer; HCC, hepatocellular carcinoma; KIRC, kidney cancer; PAAD, pancreatic adenocarcinoma; GBM, glioblastoma multiforme; MEL, melanoma; OV, ovarian cancer; SCLC, small cell lung cancer.
Next, we analysed the potential reference genes in 857 plasma EV samples from healthy individuals and patients with 13 types of cancers using long RNA‐seq data in the exoRBase database (http://www.exorbase.org). Compared with HC, the abundance of RPL41 showed no noticeable difference in patients with benign, colorectal cancer (CRC), malignant lymphoma (ML), gastric cancer (GC) and esophageal squamous cell carcinoma (ESCC) compared to controls. By contrast, RPL41 resulted as differential expression in the remaining 8 cancers (breast cancer (BRCA), hepatocellular carcinoma (HCC), kidney cancer (KIRC), pancreatic adenocarcinoma (PAAD), glioblastoma multiforme (GBM), melanoma (MEL), ovarian cancer (OV) and small cell lung cancer (SCLC)) compared with HC (Figure 5e). Similarly, there were differences in the expression of RPSA and RPL18A in 10 different cancers compared to controls (Figure 5e). Notably, β‐actin and GAPDH also showed differential expression in a series of cancers (Figure 5f). Subsequently, the stability of genes that were not differentially expressed between healthy people and cancer patients was evaluated using the four algorithm methods. According to comprehensive ranking, RPL41 resulted as the most stable expressed gene in benign, CRC, ML, GC and ESCC. On the other hand, GAPDH had the best stability in plasma EVs of three tumours including BRCA, HCC and KIRC, while β‐actin showed best stability in plasma EVs of PAAD and OV (Figure 5g, Figure S2d, e). In conclusion, RPL41 might also be a suitable reference gene for plasma EVs in some cancers.
4. DISCUSSION
Over the last decade, uEVs have been considered as a snapshot of the pathophysiological state of cells lining the nephron and the urinary tract, and therefore represent a promising source of biomarkers (Blijdorp et al., 2022; Merchant et al., 2017). Moreover, uEVs are also emerged as potential biomarkers for neurological diseases (Wang et al., 2019), cardiovascular disease (Agudiez et al., 2020), lung cancer (Zhang et al., 2018) and non‐alcoholic steatohepatitis (Zhu et al., 2022). Nucleic acids incorporated in uEVs play a role in cell‐to‐cell signalling through delivering genetic information in pathophysiological settings (Svenningsen et al., 2020). Understanding the composition of RNA molecules derived from uEVs is critical in understanding their role in intercellular communication and utility as non‐invasive biomarkers. In recent years, despite the progress in the research of EV RNA biomarkers (Lv et al., 2014), the transcriptome characteristics of human uEVs and proper reference genes relative quantification are largely unclear.
In this study, high‐throughput RNA sequencing was performed to provide an in‐depth characterization of long RNAs in uEVs from healthy people, DM and DN. The abundant long RNAs were detected in uEVs which further supported the informatic nucleic acids content in uEVs (Miranda et al., 2010). Interestingly, we defined the core transcriptome constitute of 84 common genes among the top 100 genes in the three groups which function mainly as translation, protein and RNA binding molecules. Miranda et al. found ribosomal complex constituted 76% of the 50 most highly expressed genes in uEVs from a healthy male subject (Miranda et al., 2014). In this study, we found that in the core transcriptome, 39 out of 84 core transcripts were related to ribosomal protein, and the top 5 genes were FTL, FTH1, RPL13A, EEF1A1 and RPL19. Ribosomal protein genes are abundant genes in most cell types and are related to ribosome synthesis, which are involved in cell growth and proliferation (Petibon et al., 2021). FTL and FTH1 mRNA encoded protein structure of ferritin, which is the major intracellular protein that stores iron and the protein is also found extracellularly in EVs, indicating its close relation with EVs in its biological process (Lawson et al., 1991; Truman‐Rosentsvit et al., 2018).
To explore the pathophysiological role of RNAs in uEVs, accurate quantification is a crucial analytic factor. In this study, we identified ribosomal protein genes, RPL41, RPSA and RPL18A as potential new reference genes. Unlike previous study which identified suitable reference genes from target candidates commonly used in the literature (Ragni et al., 2019), unsupervised and sequencing data‐driven method were used in this study, preventing the bias from manual selection. Interestingly, the 10 candidate reference genes identified in this study were from the core transcriptome in uEVs, and seven of them belong to the ribosomal protein gene family. Previous study showed that ribosomal protein genes RPL41, RPL13A and RPS27 exhibited expression stability across organ or tissue types and thus were identified as reference genes for DN (Cheng et al., 2011). Besides, RPL13A was identified as optimal reference gene for mRNA quantification studies in the uEVs of patients with renal graft dysfunction (Singh et al., 2022). Importantly, we identified that the candidate reference genes displayed greater stability compared to traditional reference genes. Previous studies have indicated that traditional reference genes were differentially expressed under certain experimental conditions (Chen et al., 2017; Molina et al., 2018). For example, β‐actin expression was not stable in heart tissue from patients with cardiac diseases (Molina et al., 2018).
Then, we found that those reference genes were also applicable to uEVs from other primary glomerular and urinary disorders, such as IgAN and PCA. Impressively, we confirmed that RPL41, RPSA, RPL18A were stable in renal tissues of DN and IgAN. It suggested the stable expression in the originated tissue and their consistently loading into EVs. However, these candidate reference genes were differentially expressed in uEVs derived from MN and RCC as well as the renal tissues, suggesting that reference genes were disease‐specific and the applicable disease types need to be verified. In a recent study, 986 publicly available human gene expression data were analysed, they found that the reference gene was differentially expressed in 42% of these studies, indicating that the expression of reference genes was dependent upon experimental environment (Hampton et al., 2020). However, there are still some limitations with the new reference genes. First of all, the candidate reference genes were identified from a relatively small cohort of patients with DM and DN, which may have limitation in the applicable scope of diseases. Besides, the candidate reference genes may need validation in larger cohort of patients. Combined reference genes might be considered in the utility at different conditions of diseases with experimental validation.
In conclusion, our study revealed that long RNAs were enriched in uEVs and the core transcriptome was related to cellular structures, especially ribosome which function mainly as translation, protein and RNA binding molecules. RPL41, RPSA, RPL18A may provide new reference genes for multiple kidney diseases and urinary malignance's in a disease specific manner. It is noteworthy that the three reference genes may also be suitable for renal tissues and plasma EVs. Appropriate reference genes will enhance the robustness of the relative quantification of gene expression studies in uEVs. Our findings may facilitate development of uEVs biomarkers and increase the accuracy and comparability of biomarker studies.
AUTHOR CONTRIBUTIONS
Ning Li: Data curation (equal); methodology (equal). Tao‐Tao Tang: Conceptualization (equal); investigation (equal). Yue Zhang: Methodology (equal). Xin Zhong: Investigation (equal). Li‐Jun Xie: Investigation (equal); methodology (equal). Bi‐Cheng Liu: Investigation (equal); project administration (equal); supervision (equal). Lin‐Li Lv: Conceptualization (equal); data curation (equal); formal analysis (equal); funding acquisition (equal); investigation (equal); project administration (equal); supervision (equal); validation (equal); writing—original (equal); writing—review and editing (equal).
CONFLICT OF INTEREST STATEMENT
The authors have no conflict of interest to declare.
PATIENT CONSENT STATEMENT
Written informed consent was obtained from all of the subjects to use their urine for research purposes.
PERMISSION TO REPRODUCE MATERIAL FROM OTHER SOURCES
Database used are from public database, which do not require permission.
Supporting information
Supporting Information
Supporting Information
Supporting Information
ACKNOWLEDGEMENTS
The authors would like to acknowledge the assistance of their colleagues at Institute of Nephrology, Zhong Da Hospital, Southeast University School of Medicine. This work was supported by National Natural Scientific Foundation (No.82122011, 81970616, 82241045, 82230022).
Zhu, X.‐X. , Shen, A.‐R , Li, N. , Feng, S.‐T. , Tang, T.‐T. , Zhang, Y. , Jing, J. , Zhong, X. , Xie, L.‐J. , Huang, S.‐L. , Liu, B.‐C. , & Lv, L.‐L. (2024). Identification of stable reference genes for relative quantification of long RNA expression in urinary extracellular vesicles. Journal of Extracellular Biology, 3, e136. 10.1002/jex2.136
Xiao‐Xiao Zhu and An‐Ran Shen contributed equally to this manuscript.
DATA AVAILABILITY STATEMENT
All data are available in the main text or the Supplementary Materials. These data other than original were derived from the following resources available in the public domain: GEO database (http://www.ncbi.nlm.nih.gov/geo/), number: GSE72922, GSE162830, GSE35489, GSE200828 and GSE76351. For general comments or material requests, please contact LLL (lvlinli@seu.edu.cn).
REFERENCES
- Agudiez, M. , Martinez, P. J. , Martin‐Lorenzo, M. , Heredero, A. , Santiago‐Hernandez, A. , Molero, D. , Garcia‐Segura, J. M. , Aldamiz‐Echevarria, G. , & Alvarez‐Llamas, G. (2020). Analysis of urinary exosomal metabolites identifies cardiovascular risk signatures with added value to urine analysis. BMC Biology, 18(1), 192. [DOI] [PMC free article] [PubMed] [Google Scholar]
- Andersen, C. L. , Jensen, J. L. , & Ørntoft, T. F. (2004). Normalization of real‐time quantitative reverse transcription‐PCR data: A model‐based variance estimation approach to identify genes suited for normalization, applied to bladder and colon cancer data sets. Cancer Research, 64(15), 5245–5250. [DOI] [PubMed] [Google Scholar]
- Blijdorp, C. J. , Burger, D. , Llorente, A. , Martens‐Uzunova, E. S. , & Erdbrügger, U. (2022). Extracellular vesicles as novel players in kidney disease. Journal of the American Society of Nephrology: JASN, 33(3), 467–471. [DOI] [PMC free article] [PubMed] [Google Scholar]
- Bustin, S. A. , Benes, V. , Garson, J. A. , Hellemans, J. , Huggett, J. , Kubista, M. , Mueller, R. , Nolan, T. , Pfaffl, M. W. , Shipley, G. L. , Vandesompele, J. , & Wittwer, C. T. (2009). The MIQE guidelines: Minimum information for publication of quantitative real‐time PCR experiments. Clinical Chemistry, 55(4), 611–622. [DOI] [PubMed] [Google Scholar]
- Chen, L. , Jin, Y. , Wang, L. , Sun, F. , Yang, X. , Shi, M. , Zhan, C. , Shi, Y. , & Wang, Q. (2017). Identification of reference genes and miRNAs for qRT‐PCR in human esophageal squamous cell carcinoma. Medical Oncology (Northwood, London, England), 34(1), 2. [DOI] [PubMed] [Google Scholar]
- Cheng, L. , Sun, X. , Scicluna, B. J. , Coleman, B. M. , & Hill, A. F. (2014). Characterization and deep sequencing analysis of exosomal and non‐exosomal miRNA in human urine. Kidney International, 86(2), 433–444. [DOI] [PubMed] [Google Scholar]
- Cheng, W. C. , Chang, C. W. , Chen, C. R. , Tsai, M. L. , Shu, W. Y. , Li, C. Y. , & Hsu, I. C. (2011). Identification of reference genes across physiological states for qRT‐PCR through microarray meta‐analysis. PLoS ONE, 6(2), e17347. [DOI] [PMC free article] [PubMed] [Google Scholar]
- Colhoun, H. M. , & Marcovecchio, M. L. (2018). Biomarkers of diabetic kidney disease. Diabetologia, 61(5), 996–1011. [DOI] [PMC free article] [PubMed] [Google Scholar]
- Dai, Y. , Cao, Y. , Köhler, J. , Lu, A. , Xu, S. , & Wang, H. (2021). Unbiased RNA‐Seq‐driven identification and validation of reference genes for quantitative RT‐PCR analyses of pooled cancer exosomes. BMC Genomics [Electronic Resource], 22(1), 27. [DOI] [PMC free article] [PubMed] [Google Scholar]
- Das, S. , Extracellular RNA Communication Consortium, Ansel, K. M. , Bitzer, M. , Breakefield, X. O. , Charest, A. , Galas, D. J. , Gerstein, M. B. , Gupta, M. , Milosavljevic, A. , McManus, M. T. , Patel, T. , Raffai, R. L. , Rozowsky, J. , Roth, M. E. , Saugstad, J. A. , Van Keuren‐Jensen, K. , Weaver, A. M. , & Laurent, L. C. (2019). The extracellular RNA communication consortium: Establishing foundational knowledge and technologies for extracellular RNA research. Cell, 177(2), 231–242. [DOI] [PMC free article] [PubMed] [Google Scholar]
- Dobin, A. , Davis, C. A. , Schlesinger, F. , Drenkow, J. , Zaleski, C. , Jha, S. , Batut, P. , Chaisson, M. , & Gingeras, T. R. (2013). STAR: Ultrafast universal RNA‐seq aligner. Bioinformatics (Oxford, England), 29(1), 15–21. [DOI] [PMC free article] [PubMed] [Google Scholar]
- Doshi, S. M. , & Friedman, A. N. (2017). Diagnosis and management of type 2 diabetic kidney disease. Clinical Journal of the American Society of Nephrology: CJASN, 12(8), 1366–1373. [DOI] [PMC free article] [PubMed] [Google Scholar]
- Erdbrügger, U. , Blijdorp, C. J. , Bijnsdorp, I. V. , Borràs, F. E. , Burger, D. , Bussolati, B. , Byrd, J. B. , Clayton, A. , Dear, J. W. , Falcón‐Pérez, J. M. , Grange, C. , Hill, A. F. , Holthöfer, H. , Hoorn, E. J. , Jenster, G. , Jimenez, C. R. , Junker, K. , Klein, J. , Knepper, M. A. , … Martens‐Uzunova, E. S. (2021). Urinary extracellular vesicles: A position paper by the Urine Task Force of the International Society for Extracellular Vesicles. Journal of Extracellular Vesicles, 10(7), e12093. [DOI] [PMC free article] [PubMed] [Google Scholar]
- Gouin, K. , Peck, K. , Antes, T. , Johnson, J. L. , Li, C. , Vaturi, S. D. , Middleton, R. , de Couto, G. , Walravens, A. S. , Rodriguez‐Borlado, L. , Smith, R. R. , Marbán, L. , Marbán, E. , & Ibrahim, A. G. (2017). A comprehensive method for identification of suitable reference genes in extracellular vesicles. Journal of Extracellular Vesicles, 6(1), 1347019. [DOI] [PMC free article] [PubMed] [Google Scholar]
- Hampton, T. H. , Koeppen, K. , Bashor, L. , & Stanton, B. A. (2020). Selection of reference genes for quantitative PCR: Identifying reference genes for airway epithelial cells exposed to Pseudomonas aeruginosa . American Journal of Physiology. Lung Cellular and Molecular Physiology, 319(2), L256–L265. [DOI] [PMC free article] [PubMed] [Google Scholar]
- He, Y. D. , Tao, W. , He, T. , Wang, B. Y. , Tang, X. M. , Zhang, L. M. , Wu, Z. Q. , Deng, W. M. , Zhang, L. X. , Shao, C. K. , Zhou, J. , Rong, L. M. , Gao, X. , & Li, L. Y. (2021). A urine extracellular vesicle circRNA classifier for detection of high‐grade prostate cancer in patients with prostate‐specific antigen 2–10 ng/mL at initial biopsy. Molecular Cancer, 20(1), 96. [DOI] [PMC free article] [PubMed] [Google Scholar]
- Hildebrandt, A. , Kirchner, B. , Nolte‐’t Hoen, E. N. M. , & Pfaffl, M. W. (2021). miREV: An online database and tool to uncover potential reference RNAs and biomarkers in small‐RNA sequencing data sets from extracellular vesicles enriched samples. Journal of Molecular Biology, 433(15), 167070. [DOI] [PubMed] [Google Scholar]
- Huang, X. , Sun, L. , Wen, S. , Deng, D. , Wan, F. , He, X. , Tian, L. , Liang, L. , Wei, C. , Gao, K. , Fu, Q. , Li, Y. , Jiang, J. , Zhai, R. , & He, M. (2020). RNA sequencing of plasma exosomes revealed novel functional long noncoding RNAs in hepatocellular carcinoma. Cancer Science, 111(9), 3338–3349. [DOI] [PMC free article] [PubMed] [Google Scholar]
- Lai, H. , Li, Y. , Zhang, H. , Hu, J. , Liao, J. , Su, Y. , Li, Q. , Chen, B. , Li, C. , Wang, Z. , Li, Y. , Wang, J. , Meng, Z. , Huang, Z. , & Huang, S. (2022). exoRBase 2.0: An atlas of mRNA, lncRNA and circRNA in extracellular vesicles from human biofluids. Nucleic Acids Research, 50(D1), D118–D128. [DOI] [PMC free article] [PubMed] [Google Scholar]
- Lawson, D. M. , Artymiuk, P. J. , Yewdall, S. J. , Smith, J. M. , Livingstone, J. C. , Treffry, A. , Luzzago, A. , Levi, S. , Arosio, P. , & Cesareni, G. (1991). Solving the structure of human H ferritin by genetically engineering intermolecular crystal contacts. Nature, 349(6309), 541–544. [DOI] [PubMed] [Google Scholar]
- Li, Y. , Zhao, J. , Yu, S. , Wang, Z. , He, X. , Su, Y. , Guo, T. , Sheng, H. , Chen, J. , Zheng, Q. , Li, Y. , Guo, W. , Cai, X. , Shi, G. , Wu, J. , Wang, L. , Wang, P. , He, X. , & Huang, S. (2019). Extracellular vesicles long RNA sequencing reveals abundant mRNA, circRNA, and lncRNA in human blood as potential biomarkers for cancer diagnosis. Clinical Chemistry, 65(6), 798–808. [DOI] [PubMed] [Google Scholar]
- Luo, C. , Xin, H. , Zhou, Z. , Hu, Z. , Sun, R. , Yao, N. , Sun, Q. , Borjigin, U. , Wu, X. , Fan, J. , Huang, X. , Zhou, S. , & Zhou, J. (2022). Tumor‐derived exosomes induce immunosuppressive macrophages to foster intrahepatic cholangiocarcinoma progression. Hepatology (Baltimore, Md.), 76(4), 982–999. [DOI] [PubMed] [Google Scholar]
- Lv, L. L. , Cao, Y. H. , Pan, M. M. , Liu, H. , Tang, R. N. , Ma, K. L. , Chen, P. S. , & Liu, B. C. (2014). CD2AP mRNA in urinary exosome as biomarker of kidney disease. Clinica Chimica Acta; International Journal of Clinical Chemistry, 428, 26–31. [DOI] [PubMed] [Google Scholar]
- McKiernan, J. , Donovan, M. J. , Margolis, E. , Partin, A. , Carter, B. , Brown, G. , Torkler, P. , Noerholm, M. , Skog, J. , Shore, N. , Andriole, G. , Thompson, I. , & Carroll, P. (2018). A prospective adaptive utility trial to validate performance of a novel urine exosome gene expression assay to predict high‐grade prostate cancer in patients with prostate‐specific antigen 2–10 ng/ml at initial biopsy. European Urology, 74(6), 731–738. [DOI] [PubMed] [Google Scholar]
- McKiernan, J. , Donovan, M. J. , O'Neill, V. , Bentink, S. , Noerholm, M. , Belzer, S. , Skog, J. , Kattan, M. W. , Partin, A. , Andriole, G. , Brown, G. , Wei, J. T. , Thompson, I. M., Jr , & Carroll, P. (2016). A novel urine exosome gene expression assay to predict high‐grade prostate cancer at initial biopsy. JAMA Oncology, 2(7), 882–889. [DOI] [PubMed] [Google Scholar]
- Merchant, M. L. , Rood, I. M. , Deegens, J. K. J. , & Klein, J. B. (2017). Isolation and characterization of urinary extracellular vesicles: Implications for biomarker discovery. Nature Reviews. Nephrology, 13(12), 731–749. [DOI] [PMC free article] [PubMed] [Google Scholar]
- Miranda, K. C. , Bond, D. T. , Levin, J. Z. , Adiconis, X. , Sivachenko, A. , Russ, C. , Brown, D. , Nusbaum, C. , & Russo, L. M. (2014). Massively parallel sequencing of human urinary exosome/microvesicle RNA reveals a predominance of non‐coding RNA. PLoS ONE, 9(5), e96094. [DOI] [PMC free article] [PubMed] [Google Scholar]
- Miranda, K. C. , Bond, D. T. , McKee, M. , Skog, J. , Păunescu, T. G. , Da Silva, N. , Brown, D. , & Russo, L. M. (2010). Nucleic acids within urinary exosomes/microvesicles are potential biomarkers for renal disease. Kidney International, 78(2), 191–199. [DOI] [PMC free article] [PubMed] [Google Scholar]
- Molina, C. E. , Jacquet, E. , Ponien, P. , Muñoz‐Guijosa, C. , Baczkó, I. , Maier, L. S. , Donzeau‐Gouge, P. , Dobrev, D. , Fischmeister, R. , & Garnier, A. (2018). Identification of optimal reference genes for transcriptomic analyses in normal and diseased human heart. Cardiovascular Research, 114(2), 247–258. [DOI] [PubMed] [Google Scholar]
- Pegtel, D. M. , & Gould, S. J. (2019). Exosomes. Annual Review of Biochemistry, 88, 487–514. [DOI] [PubMed] [Google Scholar]
- Petibon, C. , Malik Ghulam, M. , Catala, M. , & Abou Elela, S. (2021). Regulation of ribosomal protein genes: An ordered anarchy. Wiley Interdisciplinary Reviews. RNA, 12(3), e1632. [DOI] [PMC free article] [PubMed] [Google Scholar]
- Pfaffl, M. W. , Tichopad, A. , Prgomet, C. , & Neuvians, T. P. (2004). Determination of stable housekeeping genes, differentially regulated target genes and sample integrity: BestKeeper–Excel‐based tool using pair‐wise correlations. Biotechnology Letters, 26(6), 509–515. [DOI] [PubMed] [Google Scholar]
- Pisitkun, T. , Shen, R. F. , & Knepper, M. A. (2004). Identification and proteomic profiling of exosomes in human urine. Proceedings of the National Academy of Sciences of the United States of America, 101(36), 13368–13373. [DOI] [PMC free article] [PubMed] [Google Scholar]
- Ragni, E. , Perucca Orfei, C. , De Luca, P. , Colombini, A. , Viganò, M. , Lugano, G. , Bollati, V. , & de Girolamo, L. (2019). Identification of miRNA reference genes in extracellular vesicles from adipose derived mesenchymal stem cells for studying osteoarthritis. International Journal of Molecular Sciences, 20(5), 1108. [DOI] [PMC free article] [PubMed] [Google Scholar]
- Silver, N. , Best, S. , Jiang, J. , & Thein, S. L. (2006). Selection of housekeeping genes for gene expression studies in human reticulocytes using real‐time PCR. BMC Molecular Biology, 7, 33. [DOI] [PMC free article] [PubMed] [Google Scholar]
- Singh, A. D. , Patnam, S. , Koyyada, R. , Samal, R. , Alvi, S. B. , Satyanaryana, G. , Andrews, R. , Panigrahi, A. K. , Rengan, A. K. , Mudigonda, S. S. , Maitra, S. , & Sasidhar, M. V. (2022). Identifying stable reference genes in polyethene glycol precipitated urinary extracellular vesicles for RT‐qPCR‐based gene expression studies in renal graft dysfunction patients. Transplant Immunology, 75, 101715. [DOI] [PubMed] [Google Scholar]
- Svenningsen, P. , Sabaratnam, R. , & Jensen, B. L. (2020). Urinary extracellular vesicles: Origin, role as intercellular messengers and biomarkers; efficient sorting and potential treatment options. Acta Physiologica (Oxford, England), 228(1), e13346. [DOI] [PubMed] [Google Scholar]
- Tataruch‐Weinert, D. , Musante, L. , Kretz, O. , & Holthofer, H. (2016). Urinary extracellular vesicles for RNA extraction: Optimization of a protocol devoid of prokaryote contamination. Journal of Extracellular Vesicles, 5, 30281. [DOI] [PMC free article] [PubMed] [Google Scholar]
- Truman‐Rosentsvit, M. , Berenbaum, D. , Spektor, L. , Cohen, L. A. , Belizowsky‐Moshe, S. , Lifshitz, L. , Ma, J. , Li, W. , Kesselman, E. , Abutbul‐Ionita, I. , Danino, D. , Gutierrez, L. , Li, H. , Li, K. , Lou, H. , Regoni, M. , Poli, M. , Glaser, F. , Rouault, T. A. , & Meyron‐Holtz, E. G. (2018). Ferritin is secreted via 2 distinct nonclassical vesicular pathways. Blood, 131(3), 342–352. [DOI] [PMC free article] [PubMed] [Google Scholar]
- Vandesompele, J. , De Preter, K. , Pattyn, F. , Poppe, B. , Van Roy, N. , De Paepe, A. , & Speleman, F. (2002). Accurate normalization of real‐time quantitative RT‐PCR data by geometric averaging of multiple internal control genes. Genome Biology, 3(7), RESEARCH0034. [DOI] [PMC free article] [PubMed] [Google Scholar]
- Wang, S. , Kojima, K. , Mobley, J. A. , & West, A. B. (2019). Proteomic analysis of urinary extracellular vesicles reveal biomarkers for neurologic disease. EBioMedicine, 45, 351–361. [DOI] [PMC free article] [PubMed] [Google Scholar]
- Wu, L. , Liu, C. , Chang, D. Y. , Zhan, R. , Sun, J. , Cui, S. H. , Eddy, S. , Nair, V. , Tanner, E. , Brosius, F. C. , Looker, H. C. , Nelson, R. G. , Kretzler, M. , Wang, J. C. , Xu, M. , Ju, W. , Zhao, M. H. , Chen, M. , & Zheng, L. (2021). Annexin A1 alleviates kidney injury by promoting the resolution of inflammation in diabetic nephropathy. Kidney International, 100(1), 107–121. [DOI] [PMC free article] [PubMed] [Google Scholar]
- Xie, F. , Xiao, P. , Chen, D. , Xu, L. , & Zhang, B. (2012). miRDeepFinder: A miRNA analysis tool for deep sequencing of plant small RNAs. Plant Molecular Biology, Advance online publication. [DOI] [PubMed] [Google Scholar]
- Yasui, T. , Yanagida, T. , Ito, S. , Konakade, Y. , Takeshita, D. , Naganawa, T. , Nagashima, K. , Shimada, T. , Kaji, N. , Nakamura, Y. , Thiodorus, I. A. , He, Y. , Rahong, S. , Kanai, M. , Yukawa, H. , Ochiya, T. , Kawai, T. , & Baba, Y. (2017). Unveiling massive numbers of cancer‐related urinary‐microRNA candidates via nanowires. Science Advances, 3(12), e1701133. [DOI] [PMC free article] [PubMed] [Google Scholar]
- Zhan, Y. , Du, L. , Wang, L. , Jiang, X. , Zhang, S. , Li, J. , Yan, K. , Duan, W. , Zhao, Y. , Wang, L. , Wang, Y. , & Wang, C. (2018). Expression signatures of exosomal long non‐coding RNAs in urine serve as novel non‐invasive biomarkers for diagnosis and recurrence prediction of bladder cancer. Molecular Cancer, 17(1), 142. [DOI] [PMC free article] [PubMed] [Google Scholar]
- Zhang, C. , Leng, W. , Sun, C. , Lu, T. , Chen, Z. , Men, X. , Wang, Y. , Wang, G. , Zhen, B. , & Qin, J. (2018). Urine proteome profiling predicts lung cancer from control cases and other tumors. EBioMedicine, 30, 120–128. [DOI] [PMC free article] [PubMed] [Google Scholar]
- Zhu, Q. , Li, H. , Ao, Z. , Xu, H. , Luo, J. , Kaurich, C. , Yang, R. , Zhu, P. W. , Chen, S. D. , Wang, X. D. , Tang, L. J. , Li, G. , Huang, O. Y. , Zheng, M. H. , Li, H. P. , & Liu, F. (2022). Lipidomic identification of urinary extracellular vesicles for non‐alcoholic steatohepatitis diagnosis. Journal of Nanobiotechnology, 20(1), 349. [DOI] [PMC free article] [PubMed] [Google Scholar]
Associated Data
This section collects any data citations, data availability statements, or supplementary materials included in this article.
Supplementary Materials
Supporting Information
Supporting Information
Supporting Information
Data Availability Statement
All data are available in the main text or the Supplementary Materials. These data other than original were derived from the following resources available in the public domain: GEO database (http://www.ncbi.nlm.nih.gov/geo/), number: GSE72922, GSE162830, GSE35489, GSE200828 and GSE76351. For general comments or material requests, please contact LLL (lvlinli@seu.edu.cn).