Abstract
Extracellular vesicles (EVs) are potentially useful biomarkers for disease detection and monitoring. Development of a label‐free technique for imaging and distinguishing small volumes of EVs from different cell types and cell states would be of great value. Here, we have designed a method to explore the chemical changes in EVs associated with neuroinflammation using Time‐of‐Flight Secondary Ion Mass spectrometry (ToF‐SIMS) and machine learning (ML). Mass spectral imaging was able to identify and differentiate EVs released by microglia following lipopolysaccharide (LPS) stimulation compared to a control group. This process requires a much smaller sample size (1 µL) than other molecular analysis methods (up to 50 µL). Conspicuously, we saw a reduction in free cysteine thiols (a marker of cellular oxidative stress associated with neuroinflammation) in EVs from microglial cells treated with LPS, consistent with the reduced cellular free thiol levels measured experimentally. This validates the synergistic combination of ToF‐SIMS and ML as a sensitive and valuable technique for collecting and analysing molecular data from EVs at high resolution.
Keywords: extracellular vesicles, imaging, machine learning, microglia, neuroinflammation, surface analysis, ToF‐SIMS
1. INTRODUCTION
Extracellular vesicles (EVs) are spherical particles released from prokaryotic and eukaryotic cells into the extracellular space (El Andaloussi et al., 2013; Spada & Galluzzi, 2020; Zaborowski et al., 2015). They are 30 nm–1 µm in size and contain nucleic acids, lipids, and proteins from their donor cells encased in a lipid bilayer membrane (El Andaloussi et al., 2013; Zaborowski et al., 2015). EVs play an essential role in cell waste management and cell‐cell communication, acting as shuttles to deliver bioactive molecules to recipient cells (El Andaloussi et al., 2013; Spada & Galluzzi, 2020; Zaborowski et al., 2015). The molecular composition of EVs depends on the state of the donor cell, making them promising candidates as disease biomarkers for disease detection and monitoring (Kamińska et al., 2021). Neuroinflammation, a central nervous system (CNS) inflammatory response, urgently needs robust and predictive biomarkers as it occurs in the early stages of many neurodegenerative conditions (Chung et al., 2021; Heneka et al., 2015; Liu et al., 2022; Tian et al., 2022). In the CNS, microglia are the primary drivers of this response by activating multiple processes, such as Toll‐like receptors and adopting an ameboid phenotype that facilitates phagocytosis (Kumar, 2019; Parakalan et al., 2012). In addition to cytokine release, the activated microglia alter the cargo of their EVs (Cartier et al., 2020; Parakalan et al., 2012; Wang et al., 2015; Yang et al., 2018). Neuroinflammation, stimulated in vitro by highly inflammatory bacterial toxin lipopolysaccharide (LPS), is also reflected within their ejected EVs (Cartier et al., 2020; de Rond et al., 2018; Kushwah et al., 2022; Wang et al., 2019; Yang et al., 2018). LPS's are found in the outer cell membrane of Gram‐negative bacteria containing the highly immunogenic lipid A moiety (Lai et al., 2022).
Detection and discrimination of EVs are challenging for many reasons:
-
(1)
size—few techniques can image particles less than 500 nm in size,
-
(2)
low light scattering—challenging to use spectroscopic techniques such as Raman and Infrared (IR) spectroscopy,
-
(3)
heterogeneity—each cell state and type alter the chemical composition of EVs,
-
(4)
limited prior knowledge—the chemical compositions and key markers for their donor cells are largely unknown (Beekman et al., 2019; El Andaloussi et al., 2013; Enciso‐Martinez et al., 2020; Lee et al., 2018, Kamińska et al., 2021; Zaborowski et al., 2015).
Current analysis methods for EVs, such as Western blotting and proteomics, use bulk materials and report an average of properties over the entire sample volume (Enciso‐Martinez et al., 2020; Hill, 2017; Théry et al., 2018). They also require large sample quantities, which can be costly and time‐consuming. Raman spectroscopy also requires large sample volumes but collects spectra from individual EVs. Principal Component analysis (PCA) (a multivariate analysis technique) is commonly used to cluster similar spectra (Beekman et al., 2019; Enciso‐Martinez et al., 2020; Lee et al., 2018). Imaging of individual EVs is currently limited to microscopy techniques such as scanning electron microscopy (SEM), transmission electron microscopy (TEM) and atomic force microscopy (AFM) that allow assessment of size and morphology of EVs in the sample, but do not yield any chemical information (Beekman et al., 2019; Hill, 2017).
Although neuroinflammation is known to alter EV cargoes, limitations of existing analytical techniques have hampered investigations into molecular markers that change during inflammation. This led us to explore the use of highly sensitive label‐free technologies, such as high spatial resolution mass spectral surface imaging, to study neuroinflammation.
Here we report an effective bespoke method for analysing EVs using Time of Flight Secondary Ion Mass Spectrometry (ToF‐SIMS), a mass spectral imaging technique capable of capturing hyperspectral data sets in which each pixel in an image contains a mass spectrum. High resolution spatial and spectral information can be collected using fast imaging and spectrometry modes. Fast imaging mode captures hyperspectral images with 50–150 nm spatial resolution (Vanbellingen et al., 2015), meaning each pixel is approximately the same size as an EV. To collect data at this spatial resolution, spectral resolution is compromised, collecting only unit mass resolution. Using Spectrometry mode, high‐resolution spectral data can be collected over a larger, non‐overlapping sample area (200 µm) and used to improve assignments of high spatial resolution data. ToF‐SIMS has previously been used to examine EVs, but only using spectrometry mode and averaging mass spectra (Aybush et al., 2021; Marzec et al., 2022). To the best of our knowledge ToF‐SIMS mass spectral imaging of EVs at this spatial resolution, has not yet been reported.
When collecting hyperspectral images, ToF‐SIMS produces large, highly complex data sets. There are many useful techniques available to analyse these data. We have employed the Self Organising Map with Relational Perspective Mapping (SOM‐RPM) approach, shown to be effective in prior studies. SOM‐RPM is a machine learning (ML) method that visualises complex hyperspectral data sets as intuitive 2D images, in which the colour of each pixel denotes chemical information contained in its mass spectrum. This work utilises a ‘stitching’ approach (Bamford et al., 2023), that joins multiple ToF‐SIMS images in a quilt‐like fashion, allowing pixels across multiple images to be directly compared within a single SOM‐RPM model.
This study successfully generated molecular and spatial information on EVs using ToF‐SIMS. This surface sensitive mass spectral data allowed us to discriminate neuroinflammatory EVs from treated microglia, while reducing the sample volumes required for analysis by 20–100x. This showcases our ToF‐SIMS method as a powerful tool for high resolution molecular analyses of EVs.
2. MATERIALS AND METHODS
2.1. Microglial cell culture
For the untreated control cells, suspension, and adherent mouse microglial (SIM‐A9) cells were grown in a 1 : 1 ratio of Dulbecco's Modified Eagle Medium (DMEM) (ThermoFisher Scientific 11965118): Ham's F‐12 Nutrient Mix (ThermoFisher Scientific 11765062) supplemented with 10% (v/v) foetal bovine serum (Sigma Aldrich F9423) and 5% (v/v) horse serum (ThermoFisher Scientific 16050122), that were heat inactivated for 30 min at 50°C. The cells were detached for serial passaging using a detachment solution consisting of Dulbecco's Phosphate‐Buffered Saline (DPBS) (ThermoFisher Scientific) supplemented with 1 mM EDTA, 1 mM EGTA, and 1 mg/mL glucose, into T175 flasks (ThermoFisher Scientific NUN159910) and incubated in 5% CO2 at 37°C. For the lipopolysaccharide (LPS) treatments, SIM‐A9 cells were passaged into T175 flasks containing a 1:1 ratio of serum‐free Dulbecco's Modified Eagle Medium (DMEM) (ThermoFisher Scientific 11965118): Ham's F‐12 Nutrient Mix (ThermoFisher Scientific 11765062) supplemented with 1% MEM Non‐essential Amino Acid Solution (100×) (Sigma Aldrich M7145) and 1% glutamax (100X) (ThermoFisher Scientific 35050061). Lipopolysaccharides from Escherichia coli O55:B5 (1 ug/mL; Sigma Aldrich L5418) were added to the treatment flasks prior to incubation in 5% CO2 at 37°C for 48 h. A workflow for the treatment and analysis of SIM A9 cells and extracted EVs is shown in Figure 1.
FIGURE 1.
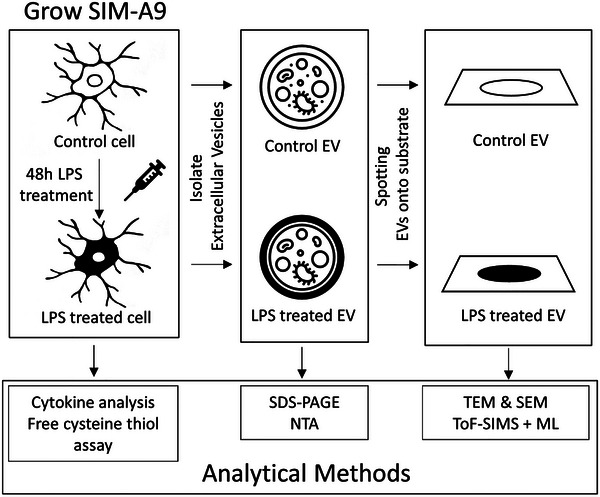
Schematic diagram indicating the analytical methods performed at each stage of sample preparation. To confirm the physiological response to LPS, cytokine analysis was conducted on conditioned media and free cysteine thiol assay was conducted on lysate that is produced from the microglial SIM‐A9 untreated control and LPS treated cells lines. EVs were then isolated from both the control and LPS treated cells. SDS‐PAGE and NTA were conducted to confirm the presence of isolated EVs. SEM, TEM, and ToF‐SIMS were then performed on EVs spotted on to a silicon wafer substrate.
2.2. Proinflammatory cytokine analysis
Small aliquots of cell culture conditioned media were collected for the determination of proinflammatory cytokines using AlphaLISAs for IL1β (AL503C; Perkin Elmer), TNF (AL505C; Perkin Elmer), and IL6 (AL504C; Perkin Elmer). Unknown sample values of released cytokines were determined from standard curves constructed according to the manufacturer's instructions.
2.3. Free cysteine thiol assay
Free cysteine thiol concentrations were determined in treated cell lysates using a commercially available thiol detection assay (Cat no: 700340, Cayman Chemical, Ann Arbor, MI, USA) according to the manufacturer's instructions. Free cysteine thiols were quantified using a cysteine standard curve, and results were expressed as nM/µg protein. Protein levels were determined with the Pierce Bicinchoninic acid (BCA) Protein assay according to the manufacturer's instructions using bovine serum albumin (BSA) as a standard.
2.4. Small EV isolation
Cell culture supernatant collected from the LPS treated and untreated SIM‐A9 cells underwent centrifugation at 2000×g for 10 min at 4°C. The supernatant was transferred to 70 mL Polycarbonate tubes (Beckman Coulter 355622) in a 45 Ti rotor (Beckman Coulter 15U5085) and underwent ultracentrifugation at 10,000 × g for 30 min at 4°C, followed by a further supernatant ultracentrifugation at 100,000 × g for 70 min at 4°C. The pellet, now containing EVs, was resuspended in 6 mL of DPBS before being overlaid on a triple sucrose cushion consisting of Fraction 4 (F4); 1 mL of 2.5 M sucrose, Fraction 3 (F3); 1.2 mL of 1.3 M sucrose, and Fraction 2 (F2); 1.2 mL of 0.6 M sucrose, in an Ultra‐Clear thin wall 13.2 mL tube (Beckman Coulter 344059). The gradient was centrifuged at 200,000 × g at 4°C for 180 min in a SW41 rotor (Beckman Coulter 15U12301). The fractions were subsequently collected and resuspended in ice cold DPBS prior to centrifugation at 128,000 × g at 4°C for 70 min in polycarbonate centrifuge bottles (Beckman Coulter 355618) in a Type 70 Ti rotor (Beckman Coulter 15U6647). The pellets were collected and resuspended in 100 µL of DPBS prior to storage at −30°C.
2.5. SDS‐PAGE gel electrophoresis
Isolated vesicles were lysed (5 M NaCl, 1 M Tris, Triton X‐100, 1% (w/v) sodium deoxycholate, 1× cOmplete ULTRA protease inhibitor) and incubated at 4°C for 20 min prior to centrifugation at 2500×g at room temperature for 5 min. The supernatant protein concentration was determined using the Pierce bicinchoninic acid (BCA) protein assay (ThermoFisher Scientific 23225) according to the manufacturer's instructions. The samples were then combined with LDS Sample Buffer (4X) (ThermoFisher Scientific NP0007) and incubated at 70°C for 10 min. Electrophoresis was performed on a 4%–12% Bis‐Tris Plus Gel (NuPAGE or Bolt; Invitrogen) with 1X MES SDS running buffer (NuPAGE; Invitrogen). Proteins were transferred to a PVDF membrane and probed with the following antibodies (Actin, Cell Signalling 8H10D10; Tsg101, Abcam ab83; CD9, Abcam ab92726; Calnexin, Abcam ab22595, GM130, BD Bioscience 610822) in 2.5% skim milk in DPBS‐T (0.05% Tween‐20). The membranes were then washed in DPBS‐T and probed with either a mouse IgG HRP (BioStrategy NA931) or rabbit IgG HRP (BioStrategy NA934) secondary antibody. The membranes were then developed using the Clarity ECL reagent (Bio‐Rad) and imaged with the ChemiDoc Touch imaging system (Bio‐Rad) as per the manufacturer's recommendations prior to image analysis using Image Lab 5.2.1 (Bio‐Rad).
2.6. Nanoparticle tracking analysis
Nanoparticle Tracking Analysis (NTA) was implemented to determine the size and concentration of the isolated vesicles. The samples were diluted one in 1000 in filtered and degassed DPBS prior to infusion through a 1 mL syringe into the ZetaView© Quatt PMX‐420 (Particle Metrix). Eleven positions within the instrument cell were scanned, with each position capturing 30 frames using the following parameters: Maximum particle size: 1000, Minimum particle size 10, Minimum Brightness 25, Focus: autofocus, Sensitivity: 80.0, Shutter: 100, and Cell temperature: 25°C. The in‐built ZetaView Software 8.05.14‐SP7 was utilized to determine the size and concentration of the vesicles.
2.7. Transmission electron microscopy
Transmission Electron Microscopy (TEM) was used to observe the size and morphology of the isolated vesicles. A formvar‐copper coated grid (ProSciTech) was glow discharge treated for 60 s prior to addition of 6 µL of sample and incubated at room temperature for 30 s. Excess sample was blotted off and 5 µL of Uranyl acetate (Agar Scientific) was applied to the grid for 10 s, twice. The grid was then imaged using the JEM‐2100 Transmission Electron Microscope (Jeol).
2.8. EV surface preparation and scanning electron microscopy
Isolated EVs were prepared for ToF‐SIMS surface analysis on 15 mm × 15 mm silicon wafers by spotting a 1 µL aliquot of concentrated EVs centrally and dispersing these with the further addition of 9 µL of DPBS to generate a one in 10 sample dilution. Samples were dried overnight and then washed with a graded series of ethanol prepared in ultrapure water (50%, 70%, 90%, 95%, and 100%) to remove contaminating salts. Dehydrated samples were immediately placed under vacuum for ToF‐SIMS imaging. A subset of samples were prepared in the same way for scanning electron microscopy to confirm the presence of EVs following the dehydration procedure. The prepared silicon wafers were placed under vacuum in a Hitachi SU7000 Field Emission Scanning Electron Microscope and images were collected.
2.9. ToF‐SIMS analysis
Hyperspectral images of a control and treated EVs were collected using an IONTOF ToF‐SIMS 5 instrument. A 30 keV Bi3+ primary ion source was used to collect images at one frame per patch and one shot per frame for 20 scans. Both spectrometry and fast imaging modes were used to collect highly resolved spectral information over a 200 µm × 200 µm area and highly resolved spatial information over a 20 µm × 20 µm area, respectively, and were collected from a different sample area to avoid any influence from sample damage due to the fast‐imaging acquisition. Positive and negative ion images were acquired in both image modes for each sample by rastering in random mode across 256 × 256 pixels, with a maximum m/z of 1500. As the primary ion dose (9 × 10⁷ total dose) affected the delicate structure of the EVs, each image was collected in a new sample area. Data were collected and analysed using Surface Lab 7.2. The images collected using fast imaging mode were used to create SOM‐RPM models, in which mode only unit mass resolution was possible. The high mass resolution data collected in spectrometry mode was used to assign the mass peaks found to be significant within the SOM‐RPM model. For co‐localisation analysis, extracted images were analysed using Image J software (Version 1.51j8), utilising the colocalization plugin (ImageJ.net. Colocalization Analysis. 2022).
2.10. ToF‐SIMS data analysis
Peaks were identified using the SurfaceLab 7.2 peak search function with a minimum threshold of 100 counts. Each high spatial resolution image was exported from SurfaceLab 7.2 using the .bif6 file format, imported into MATLAB, and normalized to total ion count per pixel. Using an in‐house MATLAB script, the data were unfolded into an n × m matrix, where n is the number of pixels and m is the number of mass peaks or features.
Data were stitched together to directly compare SOM‐RPM outputs from various images, using a process outlined in our previous work (Bamford et al., 2023; Madiona et al., 2018). Briefly, a universal peak list for each polarity was created, ensuring that a standard number of total features were examined across all stitched images. Individual n × m data matrices were concatenated vertically, creating a larger ns × m data matrix (where ns is equal to n multiplied by the number of stitched images). The trained RPM model was visualised by refolding the concatenated data via mapping each pixel (row) to the correct position within the stitched, quilt‐like image. A workflow of this process in shown in Figure 2.
FIGURE 2.
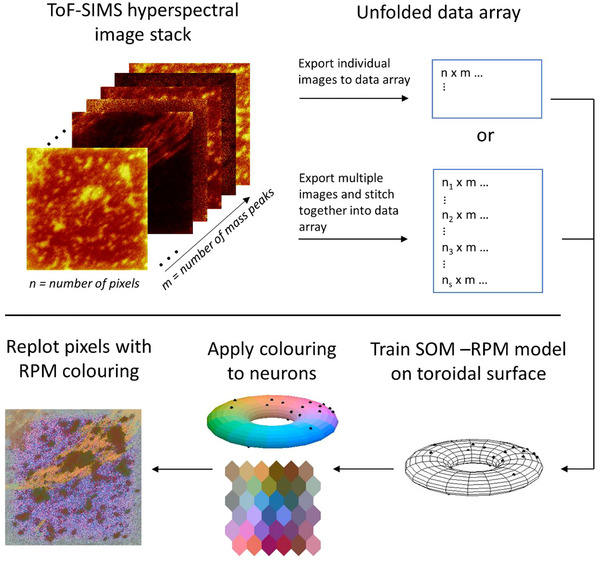
ToF‐SIMS data analysis workflow. Hyperspectral ToF‐SIMS images are exported into an unfolded data array and examined individually or stitched into a larger image for comparative analysis. A SOM model is then created by comparing the similarity of each pixel within the data array and assigning it to a neuron. RPM colouring is applied to each neuron in the toroidal model. Pixels are then replotted into a 2D image and tagged with the colour of its corresponding neuron, using colour to reflect chemical similarity.
The SOM‐RPM workflow, previously reported by this group (Gardner et al., 2019, 2020) was used to create unsupervised machine learning models for each (stitched) data set, utilising the Kohonen and CP‐ANN toolbox developed for MATLAB (MATLAB R2019b, v9.7) (Ballabio et al., 2009; Ballabio & Vasighi, 2012). The models were trained using a toroidal topology and with 36 hexagonal neurons, using an eigenvalue (PCA) based initialisation (Ballabio et al., 2009; Ballabio & Vasighi, 2012). As in our previous work, a plateau or increase in the quantization error is used to indicate SOM convergence and in‐house MATLAB scripts were used to apply the RPM algorithm to the calculated SOM models (Gardner et al., 2019, 2020). All SOM‐RPM calculations were computed using a Dell Precision 3650 Tower workstation incorporating Intel Xeon W‐1390P processor, 128 GB RAM, and an NVIDIA Quadro RTX 5000 GPU.
2.11. Statistical analysis and data availability
Quantitative cytokine and thiol data were analysed using GraphPad Prism (Version 8.2.1; GraphPad Software Inc, San Diego, CA, USA). A two‐way ANOVA was used to compare cytokine levels from control and LPS‐treated groups and a Student's t‐test was used to compare thiol levels. All data were expressed as the mean ± standard error of the mean (SEM) and p < 0.05 was considered statistically significant.
3. RESULTS AND DISCUSSION
3.1. EV characterisation
This study uses ToF‐SIMS to provide high resolution molecular data for analysing EVs released during neuroinflammation. A neuroinflammation model system, stimulation of the microglial SIM‐A9 cell line by LPS's derived from E. Coli O55:B5, was used to generate relevant EVs and compare them to EVs from untreated control cells. The LPS consists of a lipid A moiety linked to an antigenic O‐polysaccharide. We determined levels of the proinflammatory cytokines, IL1β, TNF‐α, and IL6 released by the microglial cells to confirm the neuroinflammatory model was producing the expected results (Dave et al., 2020). These cytokines were substantially elevated following LPS treatment, consistent with a proinflammatory phenotype (Figure 3a). We also investigated the levels of free cysteine thiols, a well‐known indicator of oxidative stress and simple protein side chain modification during neuroinflammation. Levels of free cysteine thiols were substantially reduced following LPS treatment (Figure 3b).
FIGURE 3.
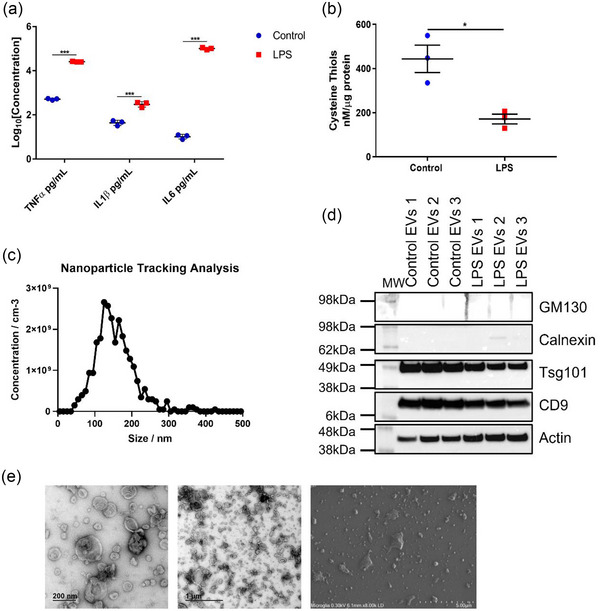
Validation of neuroinflammation and characterisation of microglial EVs. (a) Cytokine analysis indicates a highly significant neuroinflammatory phenotype following lipopolysaccharide (LPS) treatment within the complete media. (b) Cells treated with LPS also displayed significantly reduced levels of cysteine thiols compared to controls. EVs isolated from LPS treated and control microglial cells exhibit characteristics consistent with that of small EVs. (c) Nanoparticle tracking analysis of the vesicles analysed by the ZetaView© Quatt PMX‐420 showed nanoparticles with an average of 135.9 nm, a size consistent with that of small EVs. This result is from the first control microglial EV sample and is representative of all EV samples. (d) The isolated vesicles expressed small EV enriched markers tsg101, CD9, and actin, and the low expression of small EV non‐enriched markers; calnexin and GM130. (e) Transmission electron microscopy (TEM) and scanning electron microscopy (SEM) images show a population of vesicles 100–200 nm in diameter with depressed cup‐like structures consistent with that of small EVs. Enlargements in Figure S2.
Figure 3(c) shows a representative size distribution profile of SIM‐A9 EVs (545 particles), indicating that the peak size ranges from 50 to 250 nm, which is typical of small EVs. Figure 3(d) shows western blots for known EV markers described in the minimal information for studies of extracellular vesicles 2018 (MISEV2018) guidelines (Théry et al., 2018). Analysis showed enrichment of positive EV markers (CD9, Tsg101, Actin) with low levels of contaminating vesicles from other subcellular sources (Calnexin, GM130). Raw western blot images are presented as Figure S1 in the Supporting Information (SI). We also confirmed that these vesicles displayed typical morphologies using TEM, and that they were present on the silicon substrate following the washing/dehydration preparation procedures described using SEM (Figure 3e) (Hausjell et al., 2023; Jung & Mun, 2018). SEM images illustrate that EVs are intact, after ethanol washing and under ultra‐high vacuum conditions, identical to those experienced during ToF‐SIMS treatment. Enlarged TEM and SEM images are presented in Figure S2.
3.2. ToF‐SIMS and SOM‐RPM analysis
ToF‐SIMS captures a mass spectrum at every pixel within an image, creating a large three‐dimensional data cube. Each pixel can then be treated as a sample and compared to other pixels within the data set. Figure 4(a) presents a ToF‐SIMS hyperspectral image of the control EVs as a two‐dimensional similarity map.
FIGURE 4.

ToF‐SIMS image of control type EVs in positive ion mode. (a) Complete image with inlaid neural map (3D toroidal projection shown left). (b) Selected background pixels and associated inlaid neuron map. (c) Selected sample pixels and inlaid neural map. 20 µm field of view.
The SOM‐RPM algorithms assigns each pixel a colour based on its mass spectrum, such that colour similarity represents pixel similarity. Specifically, each pixel within an image was assigned to a neuron on the toroidal map (inlaid image is a 2D representation of toroid) based on the embodied mass spectrum. Pixels were defined as chemically similar if assigned to the same neuron. Chemically related neurons are clustered together on the neural map. The neurons (and their associated pixels) are then assigned a colour using RPM. This colour indicates the similarity of the pixel weights corresponding to each neuron, that is, two neighbouring neurons which are given a similar shade of blue are more chemically similar, than neighbouring neurons with highly contrasting colours. Remapping the pixels to their original position with the SOM‐RPM colour label creates a 2D visualisation of chemical similarity that reflects the entire hyperspectral mass spectral data set.
Figure 4(b, c) show manual pixel selections, identifying substrate and sample pixels, respectively. The colour selection is reflected within the inlaid coloured SOM. The sample morphology identified by ToF‐SIMS and SOM‐RPM (Figure 4c) is similar to the expected morphology (clumps of EVs ranging in size from 4 µm to sub micrometre) revealed by SEM (Figure 3e).
Each ToF‐SIMS image was captured by collecting 256 × 256 pixels over a 20 µm × 20 µm area, indicating a corresponding pixel width/height of ∼78 nm. This is oversampled as the instrument spot size is 70–120 nm and the resolution in Fast Imaging mode is closer to 150 nm. As illustrated in Figure 3(c), most EVs are in the 100–200 nm size range, suggesting that ToF‐SIMS is capable of imaging individual EVs as single pixels. We can further confirm that the SOM‐RPM model can distinguish individual EVs from the background signal by examining the selected pixels in Figure 4(c) and their mass spectra depicted in Figure S3 of the SI.
The SOM‐RPM output provides a colouring unique to each model. We can directly compare ToF‐SIMS images from the Control, and LPS treated EVs, by first stitching the images to evaluate them using the same model. Figure 5 illustrates three ToF‐SIMS images (technical replicates) from the Control and LPS sample groups stitched into a single image. Figure 5(a) shows that EVs (from micron sized aggregates through to single pixel sized across both control treated and LPS treated) are visible and distinguished from the background. Technical replicates are indistinguishable across sample pixels, with minute variations in the background, in both positive and negative ion mode. Also visible is the edge effect, where the edge of each stitched image presents as a different colour to the centre of the image. This is an instrumental artefact and indicates that the ion yield at the edge of the field of view is somewhat diminished. Despite this issue, EVs in this region have still been correctly classified into their correct types.
FIGURE 5.
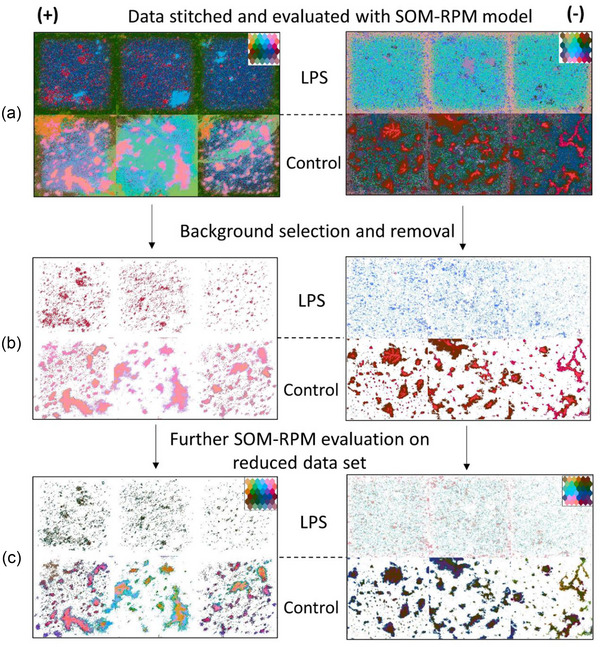
Comparison of Control and LPS treated EVs, positive ion mode presented on the left and negative ion mode on the right. (a) SOM‐RPM model of stitched data set with three technical replicates, LPS treated as the top row and Control EVs on the bottom row. (b) Stitched data set where that background has been selected and removed. (c) Secondary model run on background removed data set.
The background of Figure 5(a) was manually selected and removed from the data set, resulting in Figure 5(b) (Gardner et al., 2020). The colouring provided by the RPM algorithm shows a clear distinction in surface chemistry between control treated and LPS treated EVs, in both positive and negative ion mode. Within a single sample type, that is, Positive LPS treated, aggregates of all sizes are given the same colouring, suggesting that there is no change in chemical composition with regard to sample size. Differences in aggregation between control treated and LPS treated EVs is clear. The control EVs represent the parental cells unstimulated state, whilst the LPS treated EVs capture morphological changes observed in their parental cells. LPS activates an inflammatory phenotype in microglia (parental cells) which changes their expression of surface proteins (Cartier et al., 2020; Dave et al., 2020; Parakalan et al., 2012; Yang et al., 2018). This is manifested in the released vesicles by them being less prone to aggregation due to a change in cell adhesion and surface markers when compared to vesicles released from unstimulated cells (Parakalan et al., 2012).
As ∼90% of the neurons in the initial model were dedicated to identifying variations in the sample background, a secondary SOM was calculated using only the identified sample pixels, as indicated in Figure 5(c) (Gardner et al., 2020). This provides a higher dynamic range in our classification and provides insights not visible in the initial model.
Figure 6 outlines four regions of interest, selected from the Figure 5(c) model and explores the differences between the LPS treated and control treated samples in positive and negative ion mode. In positive ion mode, the control treated EVs (Figure 6b) show more chemical diversity, as indicated by the central, coloured SOMs. In negative ion mode, the chemical diversity is more balanced between the two types, as the SOM is split almost in half. By examining the ratio of peak weights, we can determine how much each peak contributes to the LPS treated ROI, the Control treated ROI, or if it is common to both regions. Notably, the positive ion mode has a similar number of peaks contributing to LPS and Control regions whereas in negative ion mode, there are twice as many peaks contributing to the Control ROI as there are to the LPS ROI. This is outlined in Figure S4.
FIGURE 6.
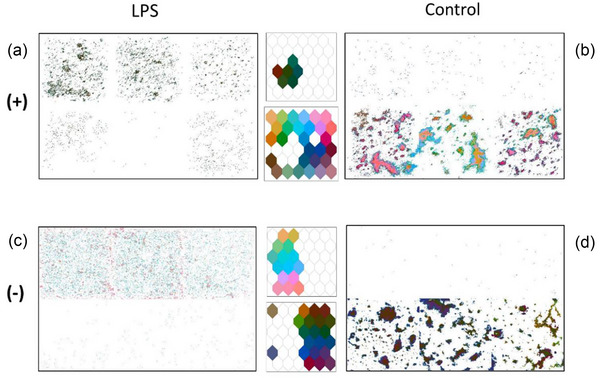
Regions of interest selected from Figure 5(c) for spatial and spectral analysis. (a) LPS treated positive ion mode. (b) Control type EVs positive ion mode. (c) LPS treated in negative ion mode. (d) Control type EVs in negative ion mode.
Interestingly, in all four neuron selections (Figure 6a–d), pixels are present within all six stitched ToF‐SIMS images, regardless of sample type. This clearest in Figure 6(a), where a significant number of pixels from the bottom row are highlighted. A small percentage of control treated EVs may present in an LPS treated sample as some cells will be undergoing mitosis and are unable to respond to the LPS simulation. Likewise, LPS treated EVs may be present in the control treated sample because, in this cell line, a small proportion of cells spontaneously become activated even in the absence of a pro‐inflammatory stimulant. The intensity and weights spectra for the control and LPS treated sample in positive and negative ion mode are given in Figure S5. The assignments of the top 20 weighted peaks are listed in Tables S1 and S2.
The inconsistency of the SOM ‐RPM colouring within the positive Control treated technical replicates suggests several unique chemistries. The variations occur both within an individual ToF‐SIMS images and across multiple images. Figure 7 indicates the spectral differences between the ‘Yellow’ and ‘Purple’ ROI selected from the positive Control EV data. The left image contains pink aggregates, the central image indicates yellow aggregates, and the right image has split of yellow and purple. Upon spectral analysis, Na+ has a higher intensity in the purple ROI and K+ has a higher concentration in the yellow ROI. Phosphate peaks, C9H11NO2 + (165.08 m/z) and C23H36O4 + (376.4 m/z) are also key ion peaks for distinguishing the yellow and pink regions. Some of these differences may be due to incomplete washing of buffers from the EV aggregates, others require more investigation to determine the source of the fragments. Both aggregate colours have unique edge colours, indicating that the bulk and the edges of aggregate types are chemically distinct.
FIGURE 7.
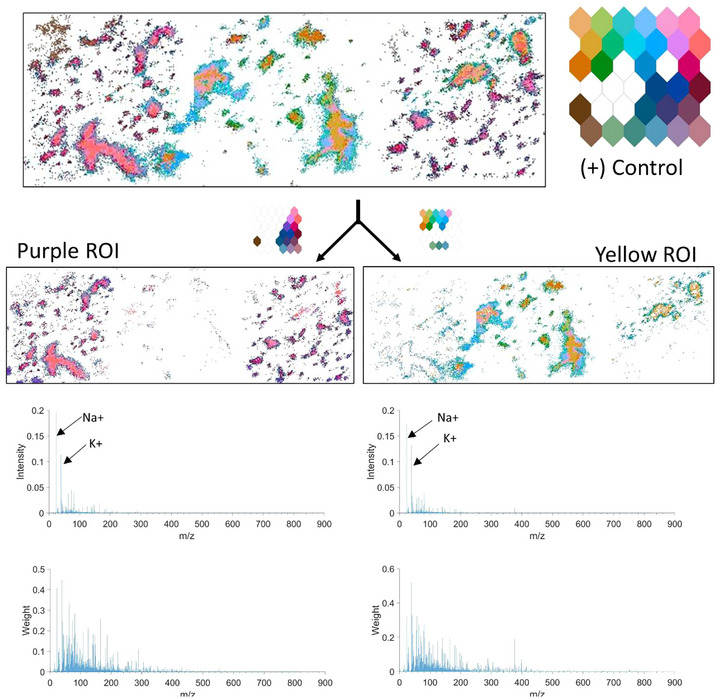
Spectral analysis of positive Control sample highlighting the differences between technical replicates. Left—Purple ROI, pixels of interest and associated average pixel intensity and weights. Right‐Yellow ROI, pixels of interest and associated average pixel intensity and weights.
The negative LPS treated samples are consistent across replicates, where each ToF‐SIMS image shows two distinct EV populations. Figure 8 explores the spectral differences, between the pink and blue subgroups. Spectral analysis indicates small changes across hundreds of peaks, the most significant being an increase in O−, OH− and C4H6NO− in the blue sub‐group, and CNO− and CH3SO2 − having higher intensity in the pink ROI. The origin of each of these populations is unclear, however, both subgroups have been clearly distinguished from the Control sample showing that none of the selected EVs have come from control type cells.
FIGURE 8.
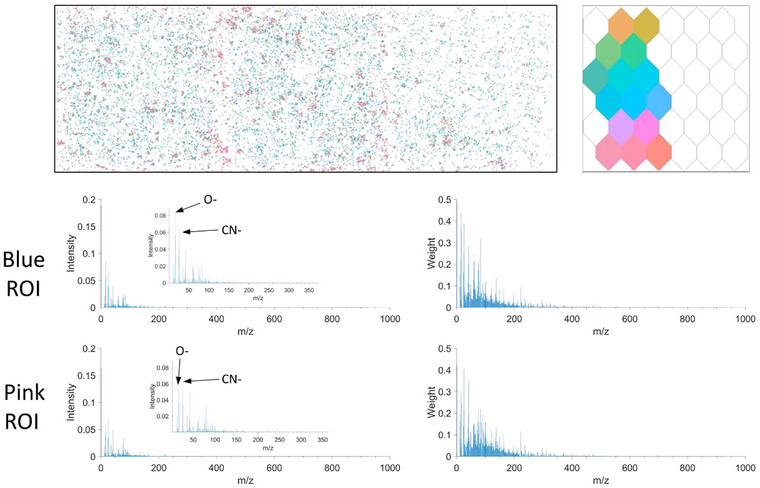
Spectral analysis of negative LPS treated samples, highlighting the differences within technical replicates. Blue and pink ROIs with average intensity (zoomed in inlay) and weights.
3.3. Spectral analysis
Finally, to investigate if physiological changes observed in cells were replicated in EVs, we extracted imaging data for the amino acid cysteine and the specific sulphur‐bound hydrogen (hydrosulphide) as an indicator of thiols in EVs. Figure 9(a, b) show cysteine and hydrosulphide presence in a representative EV sample. Using colocalization analysis, Figure 9(c, d) highlight the high degree of overlap in cysteine and hydrosulphide, indicative of the functional side chain of cysteine. Lastly, when we compare levels of hydrosulphide from LPS‐treated EVs, we see lower levels than controls, consistent with the quantitative assays performed in cell lysates (Figure 3b vs. 9e). This highlights that oxidative stress, through reduction in thiol content, is carried over into EVs. Mechanistically, this may represent a way that different cell types can communicate oxidative stress in the brain during neuroinflammation.
FIGURE 9.
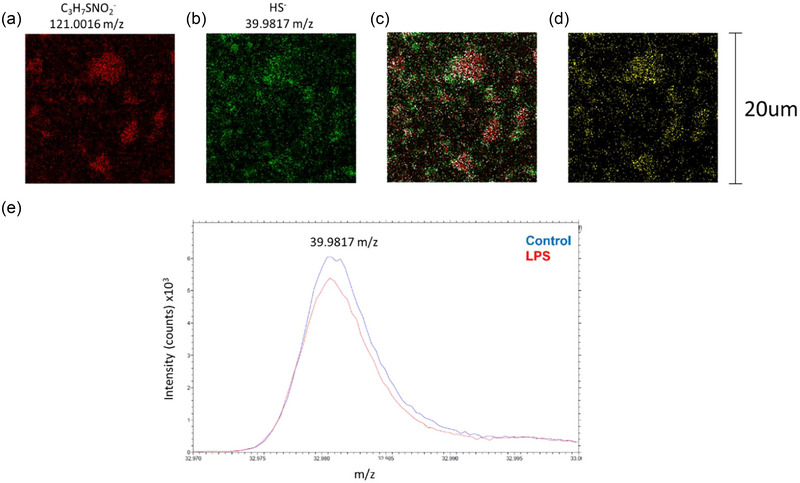
Analysis of physiological markers from extracted EV imaging data. (a) Cysteine (C3H7SNO2 −) and (b) sulfur‐bound hydrogen (HS−) imaging data were exported using Fast‐Imaging mode and pseudo‐colored red and green, respectively. (c) Co‐localisation analysis overlays each image and recolours colocalised pixels white. (d) Co‐localised pixels with background removed. (e) HS− peak collected in Spectrometry mode. Hydrosulphide levels were lower in EVs isolated from LPS‐treated microglial cells (a–e) with a 20 field of view.
4. CONCLUSIONS
We have demonstrated a method for the preparation of EVs for ToF‐SIMS imaging, which presents low volumes of intact EVs for analysis. We have illustrated the synergistic use of ToF‐SIMS and ML as a powerful tool for molecular analysis of EVs involved in the neuroinflammation process. This surface imaging modality provides mass spectral data and uses a tiny fraction of the sample required for other typical molecular methodologies. Using the SOM‐RPM algorithm, we could identify EVs at single pixel resolution and differentiate a subclass of EVs released by microglia following LPS stimulation. Moreover, a reduction in free cysteine thiols (a marker of cellular oxidative stress synonymous with neuroinflammation) were also observed in EVs from microglial cells treated with LPS. This strongly suggests that EVs are dynamically regulated under neuroinflammatory conditions and validates ToF‐SIMS with SOM‐RPM as a robust and sensitive method for investigating the molecular composition of EVs at high spatial resolution.
AUTHOR CONTRIBUTIONS
Sarah Elizabeth Bamford, Natasha Vassileff, and Jereme G. Spiers conceptualised the project, performed investigation, formal analysis and drafted the original version of the manuscript. Wil Gardner, David A. Winkler and Benjamin W. Muir provided writing review and editing. Andrew F. Hill and Paul J. Pigram conceptualised the project, provided resources, methodology, and supervision, and reviewed & edited the final version of the manuscript for submission.
CONFLICT OF INTEREST STATEMENT
The authors have no conflicts of interest to disclose.
Supporting information
Supporting Information
ACKNOWLEDGEMENTS
This work was performed in part at the Australian National Fabrication Facility (ANFF), a company established under the National Collaborative Research Infrastructure Strategy, through the La Trobe University Centre for Materials and Surface Science. The authors acknowledge the Milano Chemometrics and QSAR Research Group for the development of the Kohonen and CP‐ANN Toolbox for MATLAB (Ballabio et al., 2009; Ballabio & Vasighi, 2012). This work was supported by an Office of National Intelligence—National Intelligence and Security Discovery Research Grant (NI210100127) funded by the Australian Government and by the National Health and Medical Research Council Australia under Grant [GNT1132604]. We would also like to acknowledge the La Trobe University Bioimaging Platform for microscopy support. The funding bodies had no further role in the study design; in the collection, analysis, and interpretation of data; in the writing of the report; and in the decision to submit the paper for publication.
Bamford, S. E. , Vassileff, N. , Spiers, J. G. , Gardner, W. , Winkler, D. A. , Muir, B. W. , Hill, A. F. , & Pigram, P. J. (2023). High Resolution Imaging and Analysis of Extracellular Vesicles Using Mass Spectral Imaging and Machine Learning. Journal of Extracellular Biology, 2, e110. 10.1002/jex2.110
DATA AVAILABILITY STATEMENT
All data are included in the manuscript or supplemental figures. Primary images are available upon request.
REFERENCES
- Aybush, A. V. , Gulin, A. A. , Kuzoiatova, A. A. , Gubina, M. V. , Gostev, F. E. , Syrchina, M. S. , Ermakov, A. S. , Suprunenko, E. A. , & Nadtochenko, V. A. (2021). Chemical characterization of extracellular vesicles of mesenchymal stromal cells: TOF‐SIMS and BCARS approach. Journal of Physics: Conference Series, 2086(1), 12107. [Google Scholar]
- Ballabio, D. , Consonni, V. , & Todeschini, R. (2009). The Kohonen and CP‐ANN toolbox: A collection of MATLAB modules for self organizing maps and counter propagation artificial neural networks. Chemometrics and Intelligent Laboratory Systems, 98(2), 115–122. [Google Scholar]
- Ballabio, D. , & Vasighi, M. (2012). A MATLAB toolbox for self organizing maps and supervised neural network learning strategies. Chemometrics and Intelligent Laboratory Systems, 118, 24–32. [Google Scholar]
- Bamford, S. E. , Yalcin, D. , Gardner, W. , Winkler, D. A. , Kohl, T. M. , Muir, B. W. , Howard, S. , Bruton, E. A. , & Pigram, P. J. (2023). Multi‐dimensional machine learning analysis of polyaniline films using stitched hyperspectral ToF‐SIMS data. Analytical Chemistry, 95(20), 7968–7976. 10.1021/acs.analchem.3c00769 [DOI] [PubMed] [Google Scholar]
- Beekman, P. , Enciso‐Martinez, A. , Rho, H. S. , Pujari, S. P. , Lenferink, A. , Zuilhof, H. , Terstappen, L. W. M. M. , Otto, C. , & Le Gac, S. (2019). Immuno‐capture of extracellular vesicles for individual multi‐modal characterization using AFM, SEM and Raman spectroscopy. Lab on a Chip, 19(15), 2526–2536. [DOI] [PubMed] [Google Scholar]
- Cartier, A. , Yeung, B. , Moyron‐Quiroz, J. , Gao, Q. , Hunag, T. S. , Nazor, K. , & Tan, M. (2020). Proteomic analysis of microglia during LPS‐induced acute neuroinflammation. Alzheimer's & Dementia, 16(Suppl. 4), e040068. [Google Scholar]
- Chung, C. C. , Chan, L. , Chen, J. H. , Bamodu, O. A. , Chiu, H. W. , & Hong, C. T. (2021). Plasma extracellular vesicles tau and β‐amyloid as biomarkers of cognitive dysfunction of Parkinson's disease. FASEB Journal, 35(10), e21895. [DOI] [PubMed] [Google Scholar]
- Dave, K. M. , Ali, L. , & Manickam, D. S. (2020). Characterization of the SIM‐A9 cell line as a model of activated microglia in the context of neuropathic pain. PLoS One, 15(4), e0231597–e0231597. [DOI] [PMC free article] [PubMed] [Google Scholar]
- Dave, K. M. , Ali, L. , & Manickam, D. S. (2020). Characterization of the SIM‐A9 cell line as a model of activated microglia in the context of neuropathic pain. PLoS ONE, 15(4), e0231597. [DOI] [PMC free article] [PubMed] [Google Scholar]
- de Rond, L. , van der Pol, E. , Hau, C. M. , Varga, Z. , Sturk, A. , van Leeuwen, T. G. , Nieuwland, R. , & Coumans, F. A. W. (2018). Comparison of generic fluorescent markers for detection of extracellular vesicles by flow cytometry. Clinical Chemistry, 64(4), 680–689. [DOI] [PubMed] [Google Scholar]
- El Andaloussi, S. , Mäger, I. , Breakefield, X. O. , & Wood, M. J. (2013). Extracellular vesicles: biology and emerging therapeutic opportunities. Nature Reviews Drug Discovery, 12(5), 347–357. [DOI] [PubMed] [Google Scholar]
- Enciso‐Martinez, A. , Van Der Pol, E. , Hau, C. M. , Nieuwland, R. , Van Leeuwen, T. G. , Terstappen, L. W. M. M. , & Otto, C. (2020). Label‐free identification and chemical characterisation of single extracellular vesicles and lipoproteins by synchronous Rayleigh and Raman scattering. Journal of Extracellular Vesicles, 9(1), 1730134. [DOI] [PMC free article] [PubMed] [Google Scholar]
- Gardner, W. , Cutts, S. M. , Muir, B. W. , Jones, R. T. , & Pigram, P. J. (2019). Visualizing ToF‐SIMS hyperspectral imaging data using color‐tagged toroidal self‐organizing maps. Analytical Chemistry, 91(21), 13855–13865. [DOI] [PubMed] [Google Scholar]
- Gardner, W. , Hook, A. L. , Alexander, M. R. , Ballabio, D. , Cutts, S. M. , Muir, B. W. , & Pigram, P. J. (2020). ToF‐SIMS and machine learning for single‐pixel molecular discrimination of an acrylate polymer microarray. Analytical Chemistry, 92(9), 6587–6597. [DOI] [PMC free article] [PubMed] [Google Scholar]
- Gardner, W. , Maliki, R. , Cutts, S. M. , Muir, B. W. , Ballabio, D. , Winkler, D. A. , & Pigram, P. J. (2020). Self‐organizing map and relational perspective mapping for the accurate visualization of high‐dimensional hyperspectral data. Analytical Chemistry, 92(15), 10450–10459. [DOI] [PubMed] [Google Scholar]
- Hausjell, C. S. , Ernst, W. , Grünwald‐Gruber, C. , Arcalis, E. , & Grabherr, R. (2023). Quantitative proteomic analysis of extracellular vesicles in response to baculovirus infection of a Trichoplusia ni cell line. PLoS ONE, 18(1), e0281060. [DOI] [PMC free article] [PubMed] [Google Scholar]
- Heneka, M. T. , Carson, M. J. , El Khoury, J. , Landreth, G. E. , Brosseron, F. , Feinstein, D. L. , Jacobs, A. H. , Wyss‐Coray, T. , Vitorica, J. , Ransohoff, R. M. , Herrup, K. , Frautschy, S. A. , Finsen, B. , Brown, G. C. , Verkhratsky, A. , Yamanaka, K. , Koistinaho, J. , Latz, E. , Halle, A. , … Kummer, M. P. (2015). Neuroinflammation in Alzheimer's disease. Lancet Neurology, 14(4), 388–405. [DOI] [PMC free article] [PubMed] [Google Scholar]
- Hill, A. F. , Exomes and microvesicles—Methods and protocols. 2017, Human Press. [Google Scholar]
- ImageJ.net. Colocalization Analysis. (2022). Available from: https://imagej.net/imaging/colocalization‐analysis
- Jung, M. K. , & Mun, J. Y. (2018). Sample preparation and imaging of exosomes by transmission electron microscopy. Journal of Visualized Experiments, (131), e56482, 10.3791/56482 [DOI] [PMC free article] [PubMed] [Google Scholar]
- Kamińska, A. , Marzec, M. E. , & Stępień, E. Ł. (2021). Design and optimization of a biosensor surface functionalization to effectively capture urinary extracellular vesicles. Molecules (Basel, Switzerland), 26(16), 4764. [DOI] [PMC free article] [PubMed] [Google Scholar]
- Kumar, V. (2019). Toll‐like receptors in the pathogenesis of neuroinflammation. Journal of Neuroimmunology, 332, 16–30. [DOI] [PubMed] [Google Scholar]
- Kushwah, N. , Woeppel, K. , Dhawan, V. , Shi, D. , & Cui, X. T. (2022). Effects of neuronal cell adhesion molecule L1 and nanoparticle surface modification on microglia. Acta Biomaterialia, 149, 273–286. [DOI] [PMC free article] [PubMed] [Google Scholar]
- Lai, X. , Han, M. L. , Ding, Y. , Chow, S. H. , Le Brun, A. P. , Wu, C. M. , Bergen, P. J. , Jiang, J. H. , Hsu, H. Y. , Muir, B. W. , White, J. , Song, J. , Li, J. , & Shen, H. H. (2022). A polytherapy based approach to combat antimicrobial resistance using cubosomes. Nature Communications, 13(1), 343–343. [DOI] [PMC free article] [PubMed] [Google Scholar]
- Lee, W. , Nanou, A. , Rikkert, L. , Coumans, F. A. W. , Otto, C. , Terstappen, L. W. M. M. , & Offerhaus, H. L. (2018). Label‐free prostate cancer detection by characterization of extracellular vesicles using Raman spectroscopy. Analytical Chemistry, 90(19), 11290–11296. [DOI] [PMC free article] [PubMed] [Google Scholar]
- Liu, T. W. , Chen, C. M. , & Chang, K. H. (2022). Biomarker of neuroinflammation in Parkinson's disease. International Journal of Molecular Sciences, 23(8), 4148. [DOI] [PMC free article] [PubMed] [Google Scholar]
- Madiona, R. M. T. , Bamford, S. E. , Winkler, D. A. , Muir, B. W. , & Pigram, P. J. (2018). Distinguishing chemically similar polyamide materials with ToF‐SIMS using self‐organizing maps and a universal data matrix. Analytical Chemistry, 90(21), 12475–12484. [DOI] [PubMed] [Google Scholar]
- Marzec, M. E. , Rząca, C. , Moskal, P. , & Stępień, E. Ł. (2022). Study of the influence of hyperglycemia on the abundance of amino acids, fatty acids, and selected lipids in extracellular vesicles using TOF‐SIMS. Biochemical and Biophysical Research Communications, 622, 30–36. [DOI] [PubMed] [Google Scholar]
- Parakalan, R. , Jiang, B. , Nimmi, B. , Janani, M. , Jayapal, M. , Lu, J. , Tay, S. S. , Ling, E. A. , & Dheen, S. T. (2012). Transcriptome analysis of amoeboid and ramified microglia isolated from the corpus callosum of rat brain. BMC Neuroscience, 13, 64. [DOI] [PMC free article] [PubMed] [Google Scholar]
- Spada, S. , & Galluzzi, L. (2020). Preface — Extracellular vesicles: An exciting and rapidly expanding field of investigation, In Methods in Enzymology, S. Spada and L. Galluzzi (pp. xv–xviii), Academic Press. [DOI] [PubMed] [Google Scholar]
- Théry, C. , Witwer, K. W. , Aikawa, E. , Alcaraz, M. J. , Anderson, J. D. , Andriantsitohaina, R. , Antoniou, A. , Arab, T. , Archer, F. , Atkin‐Smith, G. K. , Ayre, D. C. , Bach, J. M. , Bachurski, D. , Baharvand, H. , Balaj, L. , Baldacchino, S. , Bauer, N. N. , Baxter, A. A. , Bebawy, M. , … Zuba‐Surma, E. K. (2018). Minimal information for studies of extracellular vesicles 2018 (MISEV2018): a position statement of the International Society for Extracellular Vesicles and update of the MISEV2014 guidelines. Journal of Extracellular Vesicles, 7(1), 1535750. [DOI] [PMC free article] [PubMed] [Google Scholar]
- Tian, C. , Stewart, T. , Hong, Z. , Guo, Z. , Aro, P. , Soltys, D. , Pan, C. , Peskind, E. R. , Zabetian, C. P. , Shaw, L. M. , Galasko, D. , Quinn, J. F. , Shi, M. , Zhang, J. , & Alzheimer's Disease Neuroimaging Initiative, (2022). Blood extracellular vesicles carrying synaptic function‐ and brain‐related proteins as potential biomarkers for Alzheimer's disease. Alzheimer's and Dementia, 19(3), 909–923. [DOI] [PMC free article] [PubMed] [Google Scholar]
- Vanbellingen, Q. P. , Elie, N. , Eller, M. J. , Della‐Negra, S. , Touboul, D. , & Brunelle, A. (2015). Time‐of‐flight secondary ion mass spectrometry imaging of biological samples with delayed extraction for high mass and high spatial resolutions. Rapid Communications in Mass Spectrometry: RCM, 29(13), 1187–1195. [DOI] [PMC free article] [PubMed] [Google Scholar]
- Wang, L. , Pavlou, S. , Du, X. , Bhuckory, M. , Xu, H. , & Chen, M. (2019). Glucose transporter 1 critically controls microglial activation through facilitating glycolysis. Molecular Neurodegeneration, 14(1), 2–2. [DOI] [PMC free article] [PubMed] [Google Scholar]
- Wang, W. Y. , Tan, M. S. , Yu, J. T. , & Tan, L. (2015). Role of pro‐inflammatory cytokines released from microglia in Alzheimer's disease. Annals of Translational Medicine, 3(10), 136. [DOI] [PMC free article] [PubMed] [Google Scholar]
- Yang, Y. , Boza‐Serrano, A. , Dunning, C. J. R. , Clausen, B. H. , Lambertsen, K. L. , & Deierborg, T. (2018). Inflammation leads to distinct populations of extracellular vesicles from microglia. Journal of Neuroinflammation, 15(1), 168–168. [DOI] [PMC free article] [PubMed] [Google Scholar]
- Zaborowski, M. P. , Balaj, L. , Breakefield, X. O. , & Lai, C. P. (2015). Extracellular vesicles composition, biological relevance, and methods of study. BioScience, 65(8), 783–797. [DOI] [PMC free article] [PubMed] [Google Scholar]
Associated Data
This section collects any data citations, data availability statements, or supplementary materials included in this article.
Supplementary Materials
Supporting Information
Data Availability Statement
All data are included in the manuscript or supplemental figures. Primary images are available upon request.


