

Abstract
Chimeric antigen receptor (CAR) T cell therapy has made great progress in treating lymphoma, yet patient outcomes still vary greatly. The lymphoma microenvironment may be an important factor in the efficacy of CAR T therapy. In this study, we designed a highly multiplexed imaging mass cytometry (IMC) panel to simultaneously quantify 31 biomarkers from 13 patients with relapsed/refractory diffuse large B cell lymphoma (DLBCL) who received CAR19/22 T cell therapy. A total of 20 sections were sampled before CAR T cell infusion or after infusion when relapse occurred. A total of 35 cell clusters were identified, annotated, and subsequently redefined into 10 metaclusters. The CD4+ T cell fraction was positively associated with remission duration. Significantly higher Ki67, CD57, and TIM3 levels and lower CD69 levels in T cells, especially the CD8+/CD4+ Tem and Te cell subsets, were seen in patients with poor outcomes. Cellular neighborhood containing more immune cells was associated with longer remission. Fibroblasts and vascular endothelial cells resided much closer to tumor cells in patients with poor response and short remission after CAR T therapy. Our work comprehensively and systematically dissects the relationship between cell composition, state, and spatial arrangement in the DLBCL microenvironment and the outcomes of CAR T cell therapy, which is beneficial to predict CAR T therapy efficacy.
Keywords: CAR T cell therapy, diffuse large B cell lymphoma, outcome prediction, tumor microenvironment, imaging mass cytometry
Graphical abstract
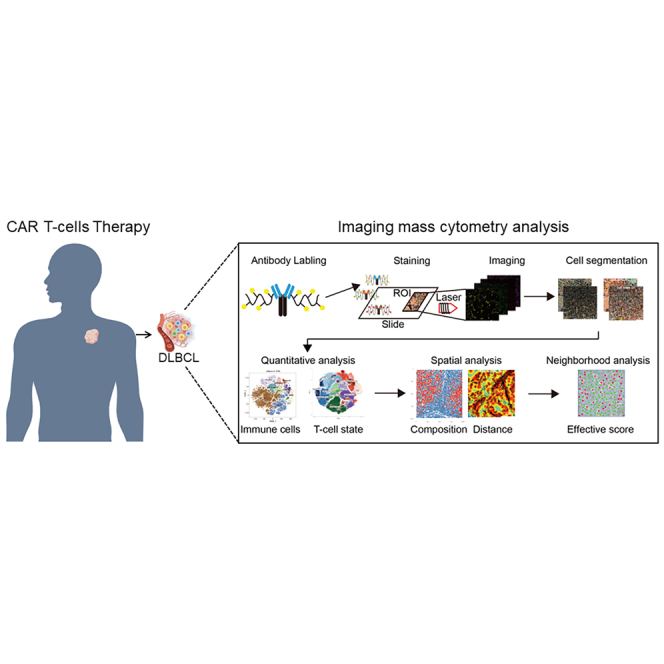
By applying a highly multiplexed imaging mass cytometry (IMC) panel, this study comprehensively and systematically dissects the relationship between cell composition, state, and spatial arrangement in the diffuse large B cell lymphoma (DLBCL) microenvironment and the outcomes of CAR T cell therapy, which is beneficial to predict CAR T therapy efficacy.
Introduction
Chimeric antigen receptor (CAR) T cell immunotherapy is a novel strategy involving the genetic engineering of a patient’s own T cells to kill tumor cells. It is giving rise to breakthroughs and unprecedented success in the treatment of hematologic malignancies, especially B cell acute lymphoblastic leukemia and B cell lymphomas.1,2,3,4,5,6 However, growing evidence has revealed that a substantial number of patients still experience remission.7 Antigen loss or modulation and poor CAR T cell persistence contribute to disease relapse after CAR T cell therapy.8,9,10,11,12 Moreover, the immunosuppressive tumor microenvironment (TME), which may render CAR T cells inactive, will be particularly relevant to ineffective CAR T cell therapy for lymphoma.13,14,15 The TME is a dynamic milieu that is assembled by neoplastic cells together with extracellular matrix (ECM), tumor vasculature, and a variety of immune cells.16 The fitness advantages afforded by the TME play an important role in the successful outgrowth of tumors and eventual metastasis. A positive response to immunotherapy, however, usually relies on dynamic interactions between tumor cells and immunomodulators inside the TME.17
Diffuse large B cell lymphoma (DLBCL) represents 30%–40% of all non-Hodgkin lymphomas (NHLs).18 It is a disease with aggressive behavior, and approximately one-third of all DLBCL patients will be refractory or resistant to standard therapy.19 Against this background of therapeutic futility, CAR T cell therapy represents a major advance in treatment, with an estimated 40% of patients remaining in remission at 1 year and possibly being cured.20,21 Biological heterogeneity in DLBCL is partly driven by cell-of-origin subtypes and associated genomic lesions, but also by diverse cell types and cell states in the TME.22,23 In contrast to other types of cancers, such as carcinomas, where the TME has been widely investigated, its role in DLBCL pathogenesis and patient survival has not been well illustrated. How the cellular composition, status, and spatial arrangement of DLBCL microenvironments affect the prognosis of CAR T cell therapy remains poorly understood.24,25
Identification and enumeration of the elements of the microenvironment has mostly relied on morphology, immunohistochemistry (IHC), and, to a lesser extent, flow cytometry, which provide a relatively low-resolution survey of the cellular subtypes that are present. The growing demands on understanding subsets within broadly defined cellular categories and their diverse and often opposing functions require a higher-resolution assay of the TME. Spatial transcriptomics is a spatially resolved, high-dimensional assessment of gene transcription, which demands much of specimens due to the instability of RNA.26 Imaging mass cytometry (IMC) is a novel technique to comprehensively quantify the cellular heterogeneity and spatial organization of tumor tissue.27 IMC combines IHC staining using metal isotope-labeled antibodies with laser ablation and mass spectrometry-based detection to produce high-dimensional images, generating images that are comparable to those produced by immunofluorescence or IHC but that have the capacity for highly multiplexed staining.28,29,30
In the present study, we designed a panel of 31 antibodies specific to DLBCL histology. Using this panel, section samples from 13 patients before and/or after CAR T cell therapy were imaged. By applying topological single-cell network analysis to high-dimensional mass cytometry images, we uncovered the cellular composition, status, and spatial organization within DLBCL tissue that are relevant to the success of CAR T cell therapy.
Results
Immunoprofiling panel for DLBCL microenvironment assessment
To identify multiple complex cellular clusters within the context of the DLBCL microenvironment, we performed highly multiplexed imaging and comprehensively quantified the cellular composition and spatial organization of lymphoma tissue (Figure 1A). As previously reported, the TME of B cell lymphomas contains highly variable numbers of tumor/nontumor cells and ECM. We designed an IMC panel specifically for DLBCL histology with 31 isotope-labeled antibodies for simultaneously quantifying markers of different cell types and cellular status (Table 1). CD19 and CD20 were used for staining B lymphoma cells. CD3, CD4, and CD8 were T cell markers. CD56, CD68, CD163, CD66b, CD11b, CD14, CD15, FOXP3, T-bet, and GATA3 were stained for natural killer (NK) cells, macrophages, tumor-associated macrophages (TAMs), myeloid-derived suppressor cells, myeloid cells, monocytes, neutrophiles, T regulatory cells (Tregs), and T helper 1 (Th1) and Th2 cells separately, which were reported as the main immune cell types within the DLBCL TME.23 Fibroblasts, vascular endothelial, and collagen were labeled by α-smooth muscle actin (α-SMA), CD31 and collagen I antibodies separately. These cells encompass almost all of the cell types in the TME. In addition, proliferation marker Ki67, cytotoxic marker interferon- γ (IFN-γ), and granzyme B were also included. Sixteen of the 31 antibodies were metal tagged when purchased, whereas the other 14 were carrier-free immunoglobulin G (IgG) antibodies conjugated to purified lanthanide metals. Antibody specificities were assessed by chromogenic IHC, and their postconjugation concentrations are listed in Table S1. Stained sections were laser ablated at subcellular resolution, and liberated isotopes were detected with a mass cytometer to yield images revealing the abundance and location of the 31 proteins of interest simultaneously (Figure 1A).
Figure 1.

High-dimensional single-cell immunophenotyping in the diffuse large B cell lymphoma microenvironment
(A) Schematic workflow of IMC. Tumor biopsy sections from patients were simultaneously labeled with 31 metal-conjugated antibodies, and serial multiplexed images were obtained through laser ablation. Raw data were processed by cell segmentation, followed by quantitative and spatial analysis related to the prognosis of patients. (B) The therapy responses of 13 enrolled patients with DLBCL receiving CAR19/22 T cell therapy. Twenty tumor biopsies, including lymph nodes, testes, brain, skin, stomach, adrenal glands, and base of the tongue, were collected and subjected to the IMC technique. Responses were evaluated according to the criteria described in the materials and methods. Arrows indicate ongoing remission. HSCT, hematopoietic stem cell transplantation; NA, not available; SD, stable disease. (C) Map using t-SNE of 493,715 single cells from IMC images of tumor sections, colored by cell-type metaclusters. (D) Heatmap showing the annotated phenotype expression profile depicted using the mean normalized intensity (Z score). The absolute cell counts of each cluster are displayed as a bar plot (right).
Table 1.
IMC panel
| Compartment | Marker | Main target cells | Clone | Label | Catalog |
|---|---|---|---|---|---|
| Lymphoma | CD19 | CD19+ B cell lymphoma | 6OMP31 | 142Nd | 3142014D |
| CD20 | CD20+ B cell lymphoma | H1 | 161Dy | 3161029D | |
| Immune cell | CD68 | Macrophages | KP1 | 159Tb | 3159035D |
| CD163 | TAMs | EDHu-1 | 147Sm | 3147021D | |
| CD66b | MDSCs | Polyclonal | 153Eu | ab218740 | |
| CD11b | Myeloid cells | EPR1344 | 175Lu | ab209970 | |
| CD14 | Monocytes | EPR3653 | 144Nd | 3144025D | |
| CD15 | Neutrophils | W6D3 | 149Sm | 3149026D | |
| CD3 | CD3+ T cell | Polyclonal | 170Er | 3170019D | |
| CD8 | CD8+ T cell | D8A8Y | 162Dy | 3162035D | |
| CD4 | CD4+ T cell | EPR6855 | 156Gd | 3156033D | |
| FOXP3 | Treg | 236A/E7 | 164Dy | 14-4777-82 | |
| T-BET | Th1 | D6N8B | 145Nd | 3145015D | |
| GATA3 | Th2 | L50-823 | 155Gd | 558686 | |
| CD56 | NK cell | RNL-1 | 171Yb | ab9018 | |
| Structural | α-SMA | Fibroblasts | 1A4 | 141Pr | 3141017D |
| CD31 | Endothelial | EPR3094 | 151Eu | 3151025D | |
| Collagen I | Collagen I | Polyclonal | 169Tm | 3169023D | |
| Cell status | Ki67 | Proliferating | B56 | 168Er | 3168022D |
| IFN-γ | Interferon gamma | Polyclonal | 150Nd | ab9657 | |
| GranzymeB | Granzyme B | EPR20129-217 | 167Er | 3167021D | |
| CD69 | Early T cell activation | EPR21814 | 148Nd | ab234512 | |
| CD45RA | Effector T cells | HI100 | 166Er | 3166031D | |
| CD45RO | Memory T cells | UCHL1 | 173Yb | 3173016D | |
| CCR7 | Naive T cell | Y59 | 160Gd | ab272938 | |
| CD103 | Exhaustion phenotype of T cells | EPR22590-27 | 172Yb | ab254201 | |
| PD-1 | Exhaustion phenotype of T cells | EPR4877(2) | 165Ho | 3165039D | |
| CTLA-4 | Exhaustion phenotype of T cells | CAL49 | 158Gd | ab237712 | |
| CD366/TIM-3 | Exhaustion phenotype of T cells | EPR22241 | 154Sm | ab242080 | |
| EOMES | Exhaustion phenotype of T cells | WD1928 | 143Nd | 14-4877-82 | |
| CD57 | T cell senescence | NK-1 | 174Yb | ab212405 |
Immune microenvironment landscape in DLBCL patients before and after CAR T cell therapy
To profile the immune microenvironment, 13 patients with relapsed/refractory DLBCL who received CAR19/22 T cell “cocktail” treatment were enrolled in the present study (Table 1). Each patient’s response and sample collection time are visualized as a bar chart in Figure 1B. Of these 13 patients, section samples were available from 10 before CAR T cell infusion. In 5 of these 10 patients, sections were also available after infusion. In addition, for the other 3 patients, sections were available only after CAR T cell infusion. A total of 20 section samples were subjected to multiplex immunostaining with the designed panel. For each section, 3 regions of interest (ROIs) were randomly chosen and processed for imaging, the distances of which were calculated (Figure S1). The H&E staining image is shown for each ROI (Figure S2).
Images were then segmented into single cells using CellProfiler. A total of 493,715 cells were identified, and the marker gene expression of each cell as well as the spatial features of the cells were quantified (Figures 1A and S3). Consistent with previous reports,28,29,30 the images generated from IMC were qualitatively comparable to those produced by immunofluorescence or IHC (Figure S4).
Unsupervised clustering with PhenoGraph identified 35 cell clusters that were annotated and assigned based on their differential expression of markers described in previous studies and known canonical markers.31 These included 8 B cell clusters, 10 cytotoxic CD8+ T cell clusters, 7 CD4+ T cell clusters, 1 NK cell cluster, 3 macrophage clusters, 1 granulocyte cluster, 1 myeloid-derived suppressor cell (MDSC) cluster, 2 fibroblast clusters, and 2 vascular clusters, as illustrated in Figures 1C and 1D. Thereafter, dimensionality reduction was carried out using t-stochastic neighbor embedding (t-SNE) as well as uniform manifold approximation and projection, which separated these cells into similar cellular metaclusters (Figures 1C and S5A). These 35 cell clusters were then redefined into 10 metaclusters according to their major cell-type markers. We defined B cells (clusters 21–28) with high expression of CD19 and/or CD20 and T cells (clusters 1–10 and 11–17) with high expression of CD3 together with CD4 or CD8. In addition, NK (CD56, CD11b) (cluster 30), macrophage M1 (high CD68, CD14, CD11b) (clusters 19 and 20), macrophage M2 (high CD68, CD14, CD11b, CD163) (cluster 18), granulocyte (high CD15) (cluster 31), MDSC (high CD11b, CD66b) (cluster 29), fibroblast (high collagen I, α-SMA) (clusters 33 and 35), and vascular endothelium (high CD31) (clusters 32 and 34) were assigned based on their expression signatures. In addition, the spatial distribution results of expression for the key markers for cell typing are shown in Figures S5C‒S5F.
These results indicate that IMC analysis with the 31-marker panel possesses the capacity for highly multiplexed staining of DLBCL tissues and revealing multiple complex cellular clusters, as well as areas with distinct tissue architectures within the context of the DLBCL microenvironment.
Fractions of T cells, NK cells, and fibroblasts within the DLBCL microenvironment vary between patients with different CAR T prognoses
To reveal how the lymphoma TME influences the outcome of CAR T cell therapy, the immunoprofiles before and after CAR T infusion were resolved (Figure 2A). We first assessed the prognostic value of the DLBCL microenvironment in the CAR T cell treatment response by comparing the metaclusters in tumor sections before CAR T cell infusion between 5 patients who achieved complete remission (CR) and 5 patients with progressive disease (PD). Three biopsies were performed after disease relapsed for patient 12. Only the first biopsy was brought into outcomes comparison analysis. As shown in Figures 2A (left panels) and 2B, higher fractions of NK cells and fibroblasts were associated with poor response, whereas no significant difference was found with other cell metaclusters. To investigate the role of the TME in remission duration, we compared the metaclusters in sections during relapse after CAR T cell infusion between 3 long-term remission (LR) patients and 5 short-term remission patients. Their differentially enriched metacluster signatures were as follows. A subtype of CD19+ tumor cells as well as fibroblasts were significantly less abundant in patients with a longer duration of remission. In contrast, higher infiltration of CD4+ T cells in the TME was accompanied by a longer duration of remission after CAR T infusion (Figures 2A, right panels, and 2B).
Figure 2.

Metacluster proportions within the TME associated with CAR T cell therapy prognosis
(A) Overlay of unsupervised clustering by Rphenograph on optimized t-SNE (optSNE), separated longitudinally. Each color designates a cluster ID. (B) Frequency of depicted cell subsets in patients with different CAR T therapy responses (CR vs. PD) and different remission durations (long-term vs. short-term). A 2-tailed unpaired t test was conducted for statistical analysis. ns, not significant; ∗p < 0.05, ∗∗p < 0.01, ∗∗∗p < 0.001, ∗∗∗∗p < 0.0001. Before, sections sampled before CAR T cell infusion; After, sections sampled after CAR T cell infusion.
Less infiltration and impaired function of T cells within the TME are associated with poor outcomes of CAR T cell therapy
To shed light on distances between cell types and the frequency of their interactions, we performed a neighborhood analysis to look at local enrichment and depletion of cells in the direct surroundings of tumor cells with imcRtools. The distance of each cell to the nearest tumor cell was calculated using the Pythagorean theorem, yielding the spectrum of proximities between cell types and works across the whole image. As expected, fewer CD4+ T cells and more fibroblasts came into close contact with the tumor cells in the TME of patients with poor response or shorter remission duration. Interestingly, less infiltration of CD8+ T cells appeared in patients with shorter remission durations, but no significant difference was found between patients with different responses (Figures 3A–3D).
Figure 3.

Infiltration analysis of CD4+ and CD8+ cells within the DLBCL TME
(A and B) Histograms plotting the normalized mean metacluster fractions for CD8+ T cells, CD4+ T cells, NK cells, macrophages, granulocytes, MDSCs, fibroblasts, and vascular endothelium at specific distances from B cells. (A) Before; (B) after. (C and D) Comparison of metacluster fractions for CD8+ T cells, CD4+ T cells and fibroblasts at specific distances (5–10 μm [C] and 10–15 μm [D]) from B cells between patients with different CAR T therapy responses and remission durations. (E and F) Comparison of the levels of Ki67, CD57, CD69, IFN-γ, and TIM3 on CD8+ (E) and CD4+ (F) T cells between patients with different CAR T therapy responses and remission durations. A 2-tailed unpaired t test was conducted for statistical analysis. ∗p < 0.05, ∗∗p < 0.01, ∗∗∗p < 0.001, ∗∗∗∗p < 0.0001. Before, sections sampled before CAR T cell infusion; After, sections sampled after CAR T cell infusion. Error bars represent 95% confidence interval.
Given that immune checkpoint receptors play an inhibitory role in regulating T cell responses, we evaluated their expression levels. Although both CD4+ and CD8+ T cell fractions showed no significant difference in the sections of patients with different responses before CAR T cell infusion, checkpoint TIM3 expression on CD8+ T cells was markedly increased in patients with poor responses (Figures 3E and 3F). On both CD4+ and CD8+ T cells, Ki67 expression was significantly higher in PD patients than in CR patients. Moreover, both CD4+ and CD8+ T cells in patients with longer remission expressed lower levels of the immunosenescence epitope CD57 and higher levels of the activation marker CD69, which suggested better functioning of these T cells. CD4+ T cells also expressed higher levels of TIM3 when relapse occurred within 3 months after CAR T cell infusion (Figures 3E and 3F).
Overall, these results demonstrate that the lymphoma TME in patients with a poor response or shorter remission duration after CAR T cell therapy was infiltrated with fewer and worse-functioning T cells.
Subpopulation analysis of T cells associated with outcomes of CAR T cell therapy
To further investigate the subpopulation of T cells within the TME, T cells were divided into subgroups by unsupervised clustering and were characterized by known expression signatures of specific T cell subtypes (Figure 4A). Eleven canonical T cell subsets were identified: CD4+ naive (Tn) (CD3+CD4+CD45RA+CD45RO−CCR7+), CD4+ central memory (Tcm) (CD3+CD4+CD45RA−CD45RO+CCR7+), CD4+ effector memory (Tem) (CD3+CD4+CD45RA−CD45RO+CCR7−), CD4+ effector (Te) (CD3+CD4+CD45RA+CD45RO−CCR7−), CD8+ Tn (CD3+CD8+CD45RA+CD45RO−CCR7+), CD8+ Tcm (CD3+CD8+CD45RA−CD45RO+CCR7+), CD8+ Tem (CD3+CD8+CD45RA−CD45RO+CCR7−), CD8+ Te (CD3+CD8+CD45RA+CD45RO−CCR7−), Treg (CD3+CD4+FoxP3+), Th1 (CD3+CD4+CD45RO+T-bet+), and Th2 (CD3+CD4+CD45RO+GATA3+). CD8+ Tem made up nearly half of the T cells (48.02%), followed by CD8+ Te (17.99%) and CD4+ Tem (11.19%) (Figure 4B).
Figure 4.

Cell fractions and status analysis of canonical T cell subsets
(A) Overlay of unsupervised clustering by Rphenograph on optSNE embedding, separated longitudinally. Each color designates a T cell subset. (B) Heatmap showing the phenotype expression and absolute cell counts of 11 canonical T cell subsets. (C‒H) Comparison of the fractions and levels of Ki67, CD57, CD69, IFN-γ, and TIM3 on CD8+ Tcms (C), CD4+ Tcms (D), CD8+ Tem cells (E), CD4+ Tem cells (F), CD8+ Te cells (G), and CD4+ cells (H) between patients with different CAR T therapy responses and remission durations. A 2-tailed unpaired t test was conducted for statistical analysis. ∗p < 0.05, ∗∗p < 0.01, ∗∗∗p < 0.001, ∗∗∗∗p < 0.0001. Before, sections sampled before CAR T cell infusion; After, sections sampled after CAR T cell infusion. Error bars represent 95% confidence interval.
In sections before CAR T therapy, fractions of the T cell subpopulations were not significantly different between CR and PD patients (red and blue dots) (Figures 4C–4H and S6, left panels). Considering that the fractions of total CD4+ and CD8+ T cells were similar (Figure 2B), we concluded that there was no significant difference in the cell numbers of T cell subpopulations between CR and PD patients before CAR T infusion. However, CD8+ Tem, CD8+ Te, and CD4+ Tem cells more highly expressed the proliferation marker Ki67 in PD patients (Figures 4E–4G, right panel), which also reflects a lower survival rate in those subgroups of T cells since the cell numbers did not change. Moreover, the level of the checkpoint protein TIM3 was significantly higher in CD8+ Tem and CD8+ Te cells of PD patients than in those of CR patients, but this was not true of other subpopulations (Figures 4E–4G and S6). Interestingly, checkpoint TIM3 expression on CD8+ T cells was markedly increased in patients with poor response, whereas its expression on CD4+ T cells was associated with quick relapse. Other inhibitory receptors did not have this expression pattern (Figures 4E–4H and S7).
In sections after CAR T therapy, fractions of CD8+ Tem, CD8+ Te, CD4+ Tem, and CD4+ Te were significantly lower in patients who relapsed 3 months after CAR T infusion than in patients who had LR (purple and green dots) (Figures 4C–4H, left panels). These 4 T cell subpopulations made up 82.27% of the T cells (Figure 4B). Moreover, these cell subgroups in LR patients expressed higher levels of CD69 and IFN-γ and lower levels of CD57 and TIM3 (Figures 4C–4H, right panel). IFN-γ is a cytokine secreted by cytotoxic lymphocytes that can directly enhance their motility and cytotoxicity. Higher CD69 and lower CD57 reflected a more active status. In summary, these results showed that impaired cytotoxic function and active status of T cells, especially CD8+ Tem cells, were associated with shorter remission and that patients were more likely to relapse within 3 months after CAR T infusion. Furthermore, TIM3 could be used as a marker for poor response and short remission after CAR T therapy.
Cellular neighborhood (CN) within the DLBCL microenvironment correlates with CAR T cell therapy outcomes
CNs are functional immune units within the TME architecture.32 To illustrate the spatial distribution and neighboring cell relationships of different types of cells in specific TMEs, we detected the correlation of CN with clinical outcomes after CAR T therapy. Cells were grouped based on information contained in their direct neighborhood. The direct CN was defined by using a 20 nearest-neighbor graph. All of the neighbors of each cell were aggregated by computing the fraction of cells of a certain cell type among its neighbors. Based on these measures, cells could be clustered into CNs. In this study, we computed the fraction of the different cell types among the 20 nearest neighbors and used K-means clustering to group cells. We found 2 different CN functional units, CN1 and CN2.
In CN1, immune cells made up the majority of the microenvironment. CD8+ T cells had the highest proportion, exceeding 25% of CN1, so we called it the CD8+ T cell-enriched CN. Conversely, tumor cells exceeded 60% in CN2, so we called it the tumor cell-enriched CN (Figure 5A). Two typical ROIs dominated by CN1 and CN2, respectively, are shown in Figure 5B. A topological map of each section sample was generated, and the CN function unit frequency was calculated. The results suggested that the frequencies of CN units were not associated with CAR T therapy response (red and blue dots). Of note, the CD8+ T cell-enriched CN1 and the tumor cell-enriched CN2 showed opposite correlations with remission duration. A higher frequency of CN1 was linked with a longer remission, whereas a higher frequency of CN2 was associated with fast recurrence (within 3 months) after CAR T therapy (green and purple dots) (Figure 5C). In addition, spatial proximity of clusters was analyzed using Squidpy Python package. If spots belonging to 2 different clusters are often close to each other, then they will have a high score and can be defined as being enriched. We found that higher proximity scores occurred between CD4+ T cell and macrophages as well as MDSCs in PD patients compared to CR patients (Figure 5D). These results suggest that topological functional units in the DLBCL TME could be novel biomarkers for post-CAR T cell prognosis.
Figure 5.

CN and heterogeneous distribution analysis within the DLBCL TME
(A) CN composition. (B) Two typical ROIs dominated by CN1 and CN2, respectively. Scale bar: 100 μm. (C) Correlation between the frequency of CNs and patient clinical outcomes after CAR T therapy. (D) Spatial neighborhood enrichment results analyzed by Squidpy Python package. High score was defined as 2 different clusters often close to each other. (E) Illustration of the distance analysis involving tumor and nontumor cells. Red dots: tumor cells; green dots: nontumor cells. Effective score, number of paired nontumor cells and tumor cells/number of nontumor cells. (F) Comparison of effective score between patients with different CAR T therapy responses and remission durations. Before, sections sampled before CAR T cell infusion; After, sections sampled after CAR T cell infusion. Scale bar, 200 μm. ∗p < 0.05, ∗∗p < 0.01, ∗∗∗p < 0.001.
Fibroblasts and vascular endothelium were enriched near tumor cells in patients with poor outcomes
The tumor cells and tumor-infiltrating cells (TICs) within the microenvironment are heterogeneously distributed, and their proximity has great clinical significance.33 We next sought to evaluate the clinical significance of the proximity between tumor cells and TICs. To further study these localization patterns, we precisely defined the positions of individual tumor cells and TICs and determined the nucleus-to-nucleus distances between any 2 cell types. The cell proximity and number were further incorporated by using an “effective score” parameter (Figures 5E and 5F). This score was calculated by dividing the number of nontumor/tumor cell pairs by the total number of nontumor cells across the whole slide to represent the spatial variation. A higher effective score indicated that there was a higher density of tumor cells within a certain distance around the nontumor cells. Interestingly, fibroblasts and vascular endothelial cells were distributed much closer to tumor cells in patients with poor response and short remission duration after CAR T therapy (Figures 5E and 5F). These results indicated that the proximity of fibroblasts and vascular endothelium to tumor cells is an adverse prognostic factor of CAR T cell therapy. Proximity between tumor cells and other TICs was not associated with outcomes.
TME reflects the consolidation therapeutic efficacy of immune checkpoint inhibitors after CAR T therapy
Patient 12 was diagnosed with relapsing/remitting (r/r) DLBCL and was admitted to the hospital to pursue CAR19/22 T cell therapy. He obtained CR at 3 months after CAR T cell infusion by positron emission tomography/computed tomography assessment. Anti-programmed cell death 1 (PD1) monoclonal antibody was given to him 6 months after CAR T infusion for consolidation. This patient remained in CR until 2 years after CAR T infusion, when the lymphoma recurred locally in the chest wall. Disease progressed thereafter and 3 biopsies were performed during this procedure (Figure 6A). During the DLBCL progression, PD1 monoclonal antibody was continuously used. The cellular metaclusters frequencies in the 3 biopsy samples during disease progression are shown in Figure S8. There was no trend in the cell composition of the three biopsies over time. However, the expression level of PD1 was continuously decreased (p < 0.05) in both CD4+ and CD8+ T cells (Figure 6B). Based on these results, we hypothesize that when the expression level of PD1 on the T cells surface is high, PD1 antibody could specifically bind to PD1, thereby lifting the immunosuppressive regulation of T lymphocytes, and the tumor is limited to local due to the immune pressure from T cells. However, when T cells are impaired by reasons other than checkpoints such as PD1, PD1 monoclonal antibodies cannot maintain immune balance, and eventually the tumor progresses.
Figure 6.

The expression levels of immune checkpoints in the TME after anti-PD1 consolidation
(A) The therapy responses of patient 12 after receiving CAR19/22 T cell therapy. Responses were evaluated according to the criteria described in the materials and methods. Arrows indicate ongoing remission. CR, complete response. (B) The expression levels of status markers as well as checkpoints in both CD4+ and CD8+ T cells during disease progression after anti-PD1 consolidation. ∗p < 0.05, ∗∗p < 0.01, ∗∗∗p < 0.001. Error bars represent 95% confidence interval.
Discussion
CAR T cell therapy has been touted as a breakthrough in immunotherapy that has the potential of ushering in a new era in cancer treatment. The lack of robust predictive biomarkers for patient stratification and monitoring remains a major challenge in the field of cellular immunotherapy. The importance of the TME to CAR T cell therapy success has been implied by several studies. Yan et al. evaluated how the TME influenced the effectiveness of anti-CD19 CAR T cells in refractory B cell NHL.13 By gene expression signature analysis, they found that higher TAM infiltration was negatively associated with remission status. Rodriguez-Garcia et al. demonstrated that CAR T cell-mediated selective elimination of folate receptor β+ TAMs in the TME delayed tumor progression and prolonged survival by enriching the population of CD8+ T cells in syngeneic tumor mouse models.34 Cancer-associated fibroblasts inhibit CAR T cell functions in preclinical models by limiting T cell infiltration through a transforming growth factor-β-dependent mechanism. In addition, an increase in monocytic MDSCs after CAR T cell infusion was reported to correlate with poor survival.35 To a degree, the composition of the TME represents remnants of the normal lymphoid tissue, effaced or infiltrated by malignant cells, and the host inflammatory response. No study has performed high-dimensional and single-cell-resolution quantification of the cellular heterogeneity and spatial organization to uncover the relationship between the DLBCL TME and CAR T success. In this study, we applied highly multiplexed IMC to discover the key TME immune features that are associated with CAR T cell therapy clinical outcomes. Thus, tumor and nontumor architectures that are defined by single-cell spatial analysis could inform the prognosis beyond the current clinical classifications.
Fibroblasts have multiple functions, including secreting collagens and other fibrous macromolecules, that shape the ECM. Tumor-associated ECM and fibroblasts in the TME have immunomodulatory effects by extensive reciprocal signaling interactions with tumor cells and crosstalk with infiltrating leukocytes. They contribute to promoting cancer progression and metastasis and lead to resistance to therapy and disease recurrence.16,36 Sakemura et al. reported bone marrow-derived cancer-associated fibroblasts (BM-CAFs) could promote tumor growth both in vitro and in vivo.37 In addition, BM-CAFs could also inhibit anti-B cell maturation antigen CAR T cells’ proliferation and CD107a expression through the secretion of multiple suppressive cytokines. Sakemura et al. developed multiple myeloma cells and CAFs dual-targeting CAR T cell strategy in mouse models, which significantly improved the effector functions of CAR T cells.37 However, the association between CAFs and clinical outcomes of CAR T cell therapy has not been well studied. Here, we found that fibroblasts were enriched near tumor cells in patients with poor response and short remission after CAR T therapy. These results suggest that fibroblasts could be a target for enhancing efficiency of immunotherapy in lymphoma.
In recent years, many studies have reported that NK cells are not only “killers” but also regulate innate and adaptive immunity, especially in the early stage, by secreting cytokines and cell-to-cell contact to maintain immune homeostasis.38,39 The negative regulatory effects of NK cells specialized as a regulatory NK cell subset that express CD56bright play important roles in normal and pathogenic immune responses.40 It is reported that CD56bright NK cells inhibited CD4+ and CD8+ activated T cell survival by a contact-dependent mechanism during interleukin-2 receptor α (IL-2Rα)-targeted therapy (daclizumab). This immunoregulation has potential importance for the treatment of autoimmune diseases and transplant rejection and toward the modification of tumor immunity.41 In our study, IMC results of tissue sections from CAR T-treated patients suggested that higher fractions of CD56bright NK cells were associated with poor CAR T therapy response. The mechanisms regarding how the NK cells regulate the activity of CAR T cells within the lymphoma microenvironment need further investigation. The NK regulator cells would be a target for enhancing CAR T cell activity.
The deep immunoprofiling strategies of IMC allow the quantification of a remarkable variety of T cell subsets and the range of activation states. Here, the expression of multiple inhibitory receptors, including PD-1, CTLA-4, TIM3, EOMES, and CD103, was evaluated. We found that checkpoint TIM3 expression on CD8+ T cells was markedly increased in patients with poor response, whereas its expression in CD4+ T cells was associated with quick relapse. No other inhibitory receptors had this expression pattern. Our results show that the TIM3 pathway has nonredundant effects that synergize with PD-1 signaling to dampen antitumor responses, as previously implicated.42 The TIM gene family has 3 genes in humans (TIM1, TIM3, and TIM4), and they encode proteins in the Ig superfamily. Knowledge about the intracellular signaling cascade activated by TIM3 during the induction of exhaustion and senescence is incomplete. Because high expression of TIM3 is a prominent event in replicative senescence, TIM3 has been targeted in some cellular immunotherapy studies. It was reported that the blockade of PD-1 in combination with other immune checkpoint receptors, including TIM3 and LAG-3, has strong synergistic effects and boosts the effector functions of CAR T cells.43,44 In another study, antibody-based blocking of galectin-9, a putative TIM3 ligand, reduced the exhaustion of CAR T cells and significantly increased their cytotoxicity against previously resistant tumor cells.
In the present study, CD8+ Tem, CD8+ Te, and CD4+ Tem cells expressed higher levels of Ki67 in patients with poor outcomes after CAR T therapy. Ki67 is a proliferation marker, but the numbers of these Ki67+ cells were comparable to or even lower than those of Ki67− T cells. Recent studies reported that the high-Ki67 subpopulation displayed a higher expression of burnout markers such as PD-1, LAG-3, TIM3, and FAS, which was consistent with our results29 (Figure 4).
IMC increases the number of detected proteins on the same section compared to traditional IHC. However, there are still some limitations in IMC. To apply the IMC assay, target proteins need to be determined before detection, which are usually previously reported proteins or those of interest to the investigators. Thus, IMC could not be applied unbiasedly. Spatial transcriptomics, which resolves section samples at the genome-wide transcription level, can make up for this bias shortcoming of IMC. However, due to the instability of RNA, the spatial transcriptome is more demanding for specimens.45 Future studies combining IMC and spatial transcriptomics, which correlates specific protein markers with gene expression patterns to elucidate the lymphoma microenvironment, are worth conducting.
In conclusion, we used IMC to simultaneously quantify 31 biomarkers, resulting in 20 high-dimensional pathological images of tumor tissue from 13 patients with r/r DLBCL who had received CAR T cell therapy. Our work comprehensively and systematically dissects the relationship between the cell composition, state, and spatial arrangement of the DLBCL microenvironment and the outcomes of CAR T cell therapy. CAFs, NK regulator cells, and inhibitory receptor TIM3 on T cells are suggested as targets for remolding the lymphoma microenvironment to enhance CAR T cell efficiency.
Materials and methods
Patients and samples
Twenty tissue samples were obtained from 13 patients who were diagnosed with diffuse large B cell lymphoma receiving CAR19/22 T cell “cocktail” therapy at Tongji Hospital, Huazhong University of Science & Technology, Wuhan, China, from July 2018 to November 2021. The efficacy of CAR T therapy was evaluated monthly for 6 months and then every 3 months according to the National Comprehensive Cancer Network guidelines and Lugano Treatment Response Criteria.46 All of the patients were followed up until transplantation, death, loss to follow-up, or the cutoff date for data collection (August 30, 2022). Twenty biopsy tissues were taken from different sites: 9 from lymph nodes, 2 from the brain, 2 from the skin and soft tissue, 2 from the mammary glands, 1 from the stomach, 1 from the testes, 1 from the adrenal glands, 1 from the mediastinal diaphragm and 1 from the base of the tongue. All of the samples were verified by pathological examinations. We performed H&E staining on every tissue sample, and the resulting stained samples were examined with an optical microscope (Nikon Eclipse Ci) by a pathology expert to select the ROIs. We chose at least 3 ROIs for each tissue to be scanned by IMC. Our study was conducted after approval by the institutional review board, and informed consent was obtained from individuals in strict accordance with the principles stipulated in the Declaration of Helsinki.
IMC panel design
An antibody panel was designed to target the DLBCL TME and T/NK cell state. The markers distinguishing the DLBCL TME consist mainly of lymphoma cells, multiple immune cells, and stromal cells, and the markers of T/NK cell status mainly consist of functional and depletion markers (Table 2).
Table 2.
Clinical characteristics of patients
| DLBCL (n = 13) | |
|---|---|
| Age | |
| Years, median (range) | 50 (25–61) |
| Sex | |
| Female | 5 (38.5) |
| Tumor burden | |
| LDH baseline | 275.5 (162–741) |
| Large tumor (>10 cm) | 4 (30.8) |
| TP53 mutation | 3 (23.1) |
| Tumor stage | |
| I–II | 0 (0.0) |
| II–IV | 13 (100.0) |
| “Double” and “triple” hit | |
| Yes | 3 (23.1) |
| No | 7 (53.8) |
| Undetermined | 3 (23.1) |
| Extranodal invasion | |
| Lymph node | 9 (45.0) |
| Skin | 2 (10.0) |
| Testis | 1 (5.0) |
| CNS | 2 (10.0) |
| Lung, stomach, adrenal glands, tongue, etc. | 6 (30.0) |
| Prior HSCT | |
| Autologous | 2(15.4) |
| Allogeneic | 1 (7.7) |
| Prior treatment | |
| First line | 3 (23.1) |
| Second line | 7 (53.8) |
| ≥Third line | 3 (23.1) |
| Refractory or relapsed | |
| Refractory | 3 (23.1) |
| First relapse | 7 (53.8) |
| ≥Second relapse | 3 (23.1) |
| CAR T cell dose, ×106 cells/kg, median (range) | |
| CAR19 T cells | 3.66 (11.6–4.08) |
| CAR22 T cells | 4.00 (2.00–4.86) |
| CRS grade | |
| 0–2 | 13 (100.0) |
| 3–5 | 0 (0.0) |
| Outcomes | |
| Response | 7 (53.8) |
| No response | 6 (46.2) |
| Follow-up time | |
| Days, median (range) | 725 (56–1677) |
CRS, cytokine release syndrome; LDH, lactate dehydrogenase.
Antibodies and metal conjugation
Before metal conjugation, antibody specificity was assessed by IHC. Antibodies were conjugated to metals using the MaxPar X8 Multimetal Labeling Kit (Fluidigm) according to the manufacturer’s protocol. Carrier-free IgG antibodies (concentrations between 0.5 and 1 mg/mL) were conjugated to purified lanthanide metals (Fluidigm) (Table S1). After conjugation, the stock solution of each antibody was diluted to a concentration of 0.5 mg/mL in antibody stabilizer supplemented with 0.05% sodium azide (Table S1.). Antibodies were stored at 4°C and remained stable for at least 6 months. To exclude the possibility that the labeling process substantially affected the performance of the antibodies, they were tested by IMC.
ROI selection
Twenty formalin-fixed paraffin-embedded (FFPE) tissue sections were selected for H&E staining to select the ROI. They were imaged with a slide scanner (3DHISTECH CaseViewer, Pannoramic SCAN) at 20× magnification. ROIs were manually selected based on the morphology of the lymphoma cells. Three ROIs were selected per slice, each 1 mm2 (Figure S2B).
IMC section staining
Twenty FFPE tissue samples were stained with our full antibody panel (Table 2). The FFPE tissue samples were heated at 62°C for 1 h. They were dewaxed by incubating the sections in xylene at 68°C for 10 min twice. The sections were then rehydrated for 5 min each in 100%, 90%, and 70% ethanol at room temperature (RT), then washed 3 times with double-distilled H2O (ddH2O) for 2 min each time. Heat-mediated antigen retrieval was performed for 30 min at 96°C in sodium citrate solution. After cooling naturally to RT, the sections were washed twice with ddH2O for 5 min and then twice with PBS containing 0.5% Tween 20 and 1% bovine serum albumin (PBS-Tris buffer [TB]) for 5 min. The section was then blocked with 3% MACS BSA stock solution for 45 min at RT. After washing 3 times in PBS-TB, the sections were incubated overnight at 4°C with an antibody cocktail. Four additional PBS-TB washes were performed for 8 min each. To label cell nuclei, the sections were incubated with an intercalator-Ir (201192B, Fluidigm) solution in PBS-TB (1.25 μM) for 30 min at RT, followed by washing twice with ddH2O. They were dried at RT for 20 min.
IMC image acquisition
Data acquisition was performed on a Helios time-of-flight mass cytometer coupled to a Hyperion Imaging System (Fluidigm). Before laser ablation, optical images of slides were acquired using Hyperion software, and the areas to ablate were selected as described above. Laser ablation was performed at a resolution of ∼1 μm and a frequency of 200 Hz, and the ablation of 1 area took 2 h. The data were exported as MCD format files and were visualized in the Fluidigm MCD viewer.
IMC analysis
After acquiring the IMC data (MCD and text file format) from the Hyperion Imaging System, Fluidigm MCD viewer (version 1.0.560.2) was used to visualize the marker expression of each ROI on the tissue sections. The raw MCD format files were converted to stacked and multichannel TIFF (tagged image file format) files. Hot pixels were removed and areas were randomly cropped into 500 × 500 pixels by CellProfiler.47 The ilastik machine learning algorithm was trained on manual annotations to distinguish between nuclei, cytoplasm, and background regions.48 This step of supervised learning generated probability maps, which were exported for each sample and batch applied to the complete images. These probability maps were then returned to CellProfiler to perform the masks. Nuclei were identified as primary objects with a diameter between 5 and 25 pixels.49 Finally, we extracted single-cell features from these images using HistoCAT version 1.7.6 software.50 For single-cell processing, we used Harmony version 0.1.051 to eliminate batch effects. Rphenograph version 0.99.1 was used for clustering (https://github.com/JinmiaoChenLab/Rphenograph). A heatmap was generated to demonstrate the median Z score (0–1) marker expression of cells in each cluster with ComplexHeatmap version 2.10.0. For dimensionality reduction, we used visualization by t-SNE to determine the phenotypic diversity of cell populations. Cytomapper version 1.6.0 was applied to support the handling and visualization of multiple multichannel images and segmentation masks. Spatial analysis and neighborhood analysis were performed by imcRtools version 1.1.7.
Statistical analysis
For expression differentiation analysis, the expression matrix was formed with log10 (counts+1). When analyzing intergroup differences, the median expression value of each sample was subtracted from the expression level of the sample. Differences were assessed in R version 4.1.3 using the 2-tailed Student’s t test, with p values <0.05 considered significant. Statistical analysis was performed by using IBM SPSS Statistics software (version 19). Adobe Illustrator 2020 and GraphPad Prism 8 were used for figure editing. The Holm-Bonferroni method was used to counteract the problem of multiple comparisons. All of the adjusted p values are provided in Table S2.
Data and code availability
The data used or analyzed during the present study are available on request from the corresponding author, upon reasonable request.
Acknowledgments
This work was supported in part by the National Natural Science Foundation of China (no. 82270238 to L.C.); the National High Technology Research and Development Program of China (No. 2021YFA1101504 to Y.Z.); and the National Natural Science Foundation of China (nos. 82070213 and 82370196 to Y.X.). This study was approved by the medical ethics committee of Tongji Hospital, Tongji Medical College, Huazhong University of Science and Technology (TJ-IRB202303138).
Author contributions
J.J., J.M., L.L., and L.J. designed and performed the experiments, curated the data, and applied the formal analysis. Y.F., W.L., X.X., X.L., D.K., M.Z., and X.D. assisted in the experimental work. M.Z. implemented the computer code and supporting algorithms. L.C., Y.Z., Y.X., and J.J. visualized the data and interpreted the outcomes. L.C. conceptualized the study, supervised the experiments, and wrote the manuscript. L.C., Y.Z., and Y.X. obtained the funding. We appreciate Mengtao Zhan from Nanjing Aoyin Biotechnology for implementing the computer code and supporting algorithms.
Declaration of interests
The authors declare no competing interests.
Footnotes
Supplemental information can be found online at https://doi.org/10.1016/j.ymthe.2024.03.023.
Contributor Information
Yicheng Zhang, Email: yczhang@tjh.tjmu.edu.cn.
Yi Xiao, Email: yixiao@tjh.tjmu.edu.cn.
Liting Chen, Email: ltchen@tjh.tjmu.edu.cn.
Supplemental information
References
- 1.Sadelain M., Brentjens R., Rivière I. The basic principles of chimeric antigen receptor design. Cancer Discov. 2013;3:388–398. doi: 10.1158/2159-8290.CD-12-0548. [DOI] [PMC free article] [PubMed] [Google Scholar]
- 2.June C.H., O'Connor R.S., Kawalekar O.U., Ghassemi S., Milone M.C. CAR T cell immunotherapy for human cancer. Science. 2018;359:1361–1365. doi: 10.1126/science.aar6711. [DOI] [PubMed] [Google Scholar]
- 3.Neelapu S.S., Locke F.L., Bartlett N.L., Lekakis L.J., Miklos D.B., Jacobson C.A., Braunschweig I., Oluwole O.O., Siddiqi T., Lin Y., et al. Axicabtagene Ciloleucel CAR T-Cell Therapy in Refractory Large B-Cell Lymphoma. N. Engl. J. Med. 2017;377:2531–2544. doi: 10.1056/NEJMoa1707447. [DOI] [PMC free article] [PubMed] [Google Scholar]
- 4.Maude S.L., Laetsch T.W., Buechner J., Rives S., Boyer M., Bittencourt H., Bader P., Verneris M.R., Stefanski H.E., Myers G.D., et al. Tisagenlecleucel in Children and Young Adults with B-Cell Lymphoblastic Leukemia. N. Engl. J. Med. 2018;378:439–448. doi: 10.1056/NEJMoa1709866. [DOI] [PMC free article] [PubMed] [Google Scholar]
- 5.Frey N.V. Approval of brexucabtagene autoleucel for adults with relapsed and refractory acute lymphocytic leukemia. Blood. 2022;140:11–15. doi: 10.1182/blood.2021014892. [DOI] [PubMed] [Google Scholar]
- 6.Abramson J.S., Palomba M.L., Gordon L.I., Lunning M.A., Wang M., Arnason J., Mehta A., Purev E., Maloney D.G., Andreadis C., et al. Lisocabtagene maraleucel for patients with relapsed or refractory large B-cell lymphomas (TRANSCEND NHL 001): a multicentre seamless design study. Lancet. 2020;396:839–852. doi: 10.1016/S0140-6736(20)31366-0. [DOI] [PubMed] [Google Scholar]
- 7.Hegde P.S., Chen D.S. Top 10 Challenges in Cancer Immunotherapy. Immunity. 2020;52:17–35. doi: 10.1016/j.immuni.2019.12.011. [DOI] [PubMed] [Google Scholar]
- 8.Majzner R.G., Mackall C.L. Tumor Antigen Escape from CAR T-cell Therapy. Cancer Discov. 2018;8:1219–1226. doi: 10.1158/2159-8290.CD-18-0442. [DOI] [PubMed] [Google Scholar]
- 9.Xu X., Sun Q., Liang X., Chen Z., Zhang X., Zhou X., Li M., Tu H., Liu Y., Tu S., Li Y. Mechanisms of Relapse After CD19 CAR T-Cell Therapy for Acute Lymphoblastic Leukemia and Its Prevention and Treatment Strategies. Front. Immunol. 2019;10:2664. doi: 10.3389/fimmu.2019.02664. [DOI] [PMC free article] [PubMed] [Google Scholar]
- 10.Cheng J., Zhao L., Zhang Y., Qin Y., Guan Y., Zhang T., Liu C., Zhou J. Understanding the Mechanisms of Resistance to CAR T-Cell Therapy in Malignancies. Front. Oncol. 2019;9:1237. doi: 10.3389/fonc.2019.01237. [DOI] [PMC free article] [PubMed] [Google Scholar]
- 11.Srivastava S., Riddell S.R. Chimeric Antigen Receptor T Cell Therapy: Challenges to Bench-to-Bedside Efficacy. J. Immunol. 2018;200:459–468. doi: 10.4049/jimmunol.1701155. [DOI] [PMC free article] [PubMed] [Google Scholar]
- 12.Sterner R.C., Sterner R.M. CAR-T cell therapy: current limitations and potential strategies. Blood Cancer J. 2021;11:69. doi: 10.1038/s41408-021-00459-7. [DOI] [PMC free article] [PubMed] [Google Scholar]
- 13.Yan Z.X., Li L., Wang W., OuYang B.S., Cheng S., Wang L., Wu W., Xu P.P., Muftuoglu M., Hao M., et al. Clinical Efficacy and Tumor Microenvironment Influence in a Dose-Escalation Study of Anti-CD19 Chimeric Antigen Receptor T Cells in Refractory B-Cell Non-Hodgkin's Lymphoma. Clin. Cancer Res. 2019;25:6995–7003. doi: 10.1158/1078-0432.CCR-19-0101. [DOI] [PubMed] [Google Scholar]
- 14.Junttila M.R., de Sauvage F.J. Influence of tumour micro-environment heterogeneity on therapeutic response. Nature. 2013;501:346–354. doi: 10.1038/nature12626. [DOI] [PubMed] [Google Scholar]
- 15.Scholler N., Perbost R., Locke F.L., Jain M.D., Turcan S., Danan C., Chang E.C., Neelapu S.S., Miklos D.B., Jacobson C.A., et al. Tumor immune contexture is a determinant of anti-CD19 CAR T cell efficacy in large B cell lymphoma. Nat. Med. 2022;28:1872–1882. doi: 10.1038/s41591-022-01916-x. [DOI] [PMC free article] [PubMed] [Google Scholar]
- 16.Gajewski T.F., Schreiber H., Fu Y.X. Innate and adaptive immune cells in the tumor microenvironment. Nat. Immunol. 2013;14:1014–1022. doi: 10.1038/ni.2703. [DOI] [PMC free article] [PubMed] [Google Scholar]
- 17.Tang H., Qiao J., Fu Y.X. Immunotherapy and tumor microenvironment. Cancer Lett. 2016;370:85–90. doi: 10.1016/j.canlet.2015.10.009. [DOI] [PMC free article] [PubMed] [Google Scholar]
- 18.Li S., Young K.H., Medeiros L.J. Diffuse large B-cell lymphoma. Pathology. 2018;50:74–87. doi: 10.1016/j.pathol.2017.09.006. [DOI] [PubMed] [Google Scholar]
- 19.Goldfinger M., Cooper D.L. Refractory DLBCL: Challenges and Treatment. Clin. Lymphoma Myeloma Leuk. 2022;22:140–148. doi: 10.1016/j.clml.2021.09.011. [DOI] [PubMed] [Google Scholar]
- 20.Spiegel J.Y., Dahiya S., Jain M.D., Tamaresis J., Nastoupil L.J., Jacobs M.T., Ghobadi A., Lin Y., Lunning M., Lekakis L., et al. Outcomes of patients with large B-cell lymphoma progressing after axicabtagene ciloleucel therapy. Blood. 2021;137:1832–1835. doi: 10.1182/blood.2020006245. [DOI] [PMC free article] [PubMed] [Google Scholar]
- 21.Schuster S.J., Bishop M.R., Tam C.S., Waller E.K., Borchmann P., McGuirk J.P., Jäger U., Jaglowski S., Andreadis C., Westin J.R., et al. Tisagenlecleucel in Adult Relapsed or Refractory Diffuse Large B-Cell Lymphoma. N. Engl. J. Med. 2019;380:45–56. doi: 10.1056/NEJMoa1804980. [DOI] [PubMed] [Google Scholar]
- 22.Steen C.B., Luca B.A., Esfahani M.S., Azizi A., Sworder B.J., Nabet B.Y., Kurtz D.M., Liu C.L., Khameneh F., Advani R.H., et al. The landscape of tumor cell states and ecosystems in diffuse large B cell lymphoma. Cancer Cell. 2021;39:1422–1437.e10. doi: 10.1016/j.ccell.2021.08.011. [DOI] [PMC free article] [PubMed] [Google Scholar]
- 23.Scott D.W., Gascoyne R.D. The tumour microenvironment in B cell lymphomas. Nat. Rev. Cancer. 2014;14:517–534. doi: 10.1038/nrc3774. [DOI] [PubMed] [Google Scholar]
- 24.Seferbekova Z., Lomakin A., Yates L.R., Gerstung M. Spatial biology of cancer evolution. Nat. Rev. Genet. 2023;24:295–313. doi: 10.1038/s41576-022-00553-x. [DOI] [PubMed] [Google Scholar]
- 25.Giraldo N.A., Sanchez-Salas R., Peske J.D., Vano Y., Becht E., Petitprez F., Validire P., Ingels A., Cathelineau X., Fridman W.H., Sautès-Fridman C. The clinical role of the TME in solid cancer. Br. J. Cancer. 2019;120:45–53. doi: 10.1038/s41416-018-0327-z. [DOI] [PMC free article] [PubMed] [Google Scholar]
- 26.Rao A., Barkley D., França G.S., Yanai I. Exploring tissue architecture using spatial transcriptomics. Nature. 2021;596:211–220. doi: 10.1038/s41586-021-03634-9. [DOI] [PMC free article] [PubMed] [Google Scholar]
- 27.Giesen C., Wang H.A.O., Schapiro D., Zivanovic N., Jacobs A., Hattendorf B., Schüffler P.J., Grolimund D., Buhmann J.M., Brandt S., et al. Highly multiplexed imaging of tumor tissues with subcellular resolution by mass cytometry. Nat. Methods. 2014;11:417–422. doi: 10.1038/nmeth.2869. [DOI] [PubMed] [Google Scholar]
- 28.Jackson H.W., Fischer J.R., Zanotelli V.R.T., Ali H.R., Mechera R., Soysal S.D., Moch H., Muenst S., Varga Z., Weber W.P., Bodenmiller B. The single-cell pathology landscape of breast cancer. Nature. 2020;578:615–620. doi: 10.1038/s41586-019-1876-x. [DOI] [PubMed] [Google Scholar]
- 29.Sanmamed M.F., Nie X., Desai S.S., Villaroel-Espindola F., Badri T., Zhao D., Kim A.W., Ji L., Zhang T., Quinlan E., et al. A Burned-Out CD8+ T-cell Subset Expands in the Tumor Microenvironment and Curbs Cancer Immunotherapy. Cancer Discov. 2021;11:1700–1715. doi: 10.1158/2159-8290.CD-20-0962. [DOI] [PMC free article] [PubMed] [Google Scholar]
- 30.Damond N., Engler S., Zanotelli V.R.T., Schapiro D., Wasserfall C.H., Kusmartseva I., Nick H.S., Thorel F., Herrera P.L., Atkinson M.A., Bodenmiller B. A Map of Human Type 1 Diabetes Progression by Imaging Mass Cytometry. Cell Metab. 2019;29:755–768.e5. doi: 10.1016/j.cmet.2018.11.014. [DOI] [PMC free article] [PubMed] [Google Scholar]
- 31.Mitsialis V., Wall S., Liu P., Ordovas-Montanes J., Parmet T., Vukovic M., Spencer D., Field M., McCourt C., Toothaker J., et al. Single-Cell Analyses of Colon and Blood Reveal Distinct Immune Cell Signatures of Ulcerative Colitis and Crohn's Disease. Gastroenterology. 2020;159:591–608.e10. doi: 10.1053/j.gastro.2020.04.074. [DOI] [PMC free article] [PubMed] [Google Scholar]
- 32.Schürch C.M., Bhate S.S., Barlow G.L., Phillips D.J., Noti L., Zlobec I., Chu P., Black S., Demeter J., McIlwain D.R., et al. Coordinated Cellular Neighborhoods Orchestrate Antitumoral Immunity at the Colorectal Cancer Invasive Front. Cell. 2020;183:838. doi: 10.1016/j.cell.2020.10.021. [DOI] [PMC free article] [PubMed] [Google Scholar]
- 33.Chen Y., Jia K., Sun Y., Zhang C., Li Y., Zhang L., Chen Z., Zhang J., Hu Y., Yuan J., et al. Predicting response to immunotherapy in gastric cancer via multi-dimensional analyses of the tumour immune microenvironment. Nat. Commun. 2022;13:4851. doi: 10.1038/s41467-022-32570-z. [DOI] [PMC free article] [PubMed] [Google Scholar]
- 34.Rodriguez-Garcia A., Lynn R.C., Poussin M., Eiva M.A., Shaw L.C., O'Connor R.S., Minutolo N.G., Casado-Medrano V., Lopez G., Matsuyama T., Powell D.J., Jr. CAR-T cell-mediated depletion of immunosuppressive tumor-associated macrophages promotes endogenous antitumor immunity and augments adoptive immunotherapy. Nat. Commun. 2021;12:877. doi: 10.1038/s41467-021-20893-2. [DOI] [PMC free article] [PubMed] [Google Scholar]
- 35.Gunderson A.J., Yamazaki T., McCarty K., Fox N., Phillips M., Alice A., Blair T., Whiteford M., O'Brien D., Ahmad R., et al. TGFβ suppresses CD8+ T cell expression of CXCR3 and tumor trafficking. Nat. Commun. 2020;11:1749. doi: 10.1038/s41467-020-15404-8. [DOI] [PMC free article] [PubMed] [Google Scholar]
- 36.Enblad G., Karlsson H., Gammelgård G., Wenthe J., Lövgren T., Amini R.M., Wikstrom K.I., Essand M., Savoldo B., Hallböök H., et al. A Phase I/IIa Trial Using CD19-Targeted Third-Generation CAR T Cells for Lymphoma and Leukemia. Clin. Cancer Res. 2018;24:6185–6194. doi: 10.1158/1078-0432.CCR-18-0426. [DOI] [PubMed] [Google Scholar]
- 37.Sakemura R., Hefazi M., Siegler E.L., Cox M.J., Larson D.P., Hansen M.J., Manriquez Roman C., Schick K.J., Can I., Tapper E.E., et al. Targeting cancer-associated fibroblasts in the bone marrow prevents resistance to CART-cell therapy in multiple myeloma. Blood. 2022;139:3708–3721. doi: 10.1182/blood.2021012811. [DOI] [PubMed] [Google Scholar]
- 38.Collins P.L., Cella M., Porter S.I., Li S., Gurewitz G.L., Hong H.S., Johnson R.P., Oltz E.M., Colonna M. Gene Regulatory Programs Conferring Phenotypic Identities to Human NK Cells. Cell. 2019;176:348–360.e12. doi: 10.1016/j.cell.2018.11.045. [DOI] [PMC free article] [PubMed] [Google Scholar]
- 39.Dubois S., Feigenbaum L., Waldmann T.A., Müller J.R. NK cells prevent T cell lymphoma development in T cell receptor-transgenic mice. Cell. Immunol. 2020;352 doi: 10.1016/j.cellimm.2020.104081. [DOI] [PMC free article] [PubMed] [Google Scholar]
- 40.Zwirner N.W., Domaica C.I., Fuertes M.B. Regulatory functions of NK cells during infections and cancer. J. Leukoc. Biol. 2021;109:185–194. doi: 10.1002/JLB.3MR0820-685R. [DOI] [PubMed] [Google Scholar]
- 41.Bielekova B., Catalfamo M., Reichert-Scrivner S., Packer A., Cerna M., Waldmann T.A., McFarland H., Henkart P.A., Martin R. Regulatory CD56(bright) natural killer cells mediate immunomodulatory effects of IL-2Ralpha-targeted therapy (daclizumab) in multiple sclerosis. Proc. Natl. Acad. Sci. USA. 2006;103:5941–5946. doi: 10.1073/pnas.0601335103. [DOI] [PMC free article] [PubMed] [Google Scholar]
- 42.Zeidan A.M., Komrokji R.S., Brunner A.M. TIM-3 pathway dysregulation and targeting in cancer. Expert Rev. Anticancer Ther. 2021;21:523–534. doi: 10.1080/14737140.2021.1865814. [DOI] [PubMed] [Google Scholar]
- 43.Takata A., Nakashima M., Saitsu H., Mizuguchi T., Mitsuhashi S., Takahashi Y., Okamoto N., Osaka H., Nakamura K., Tohyama J., et al. Comprehensive analysis of coding variants highlights genetic complexity in developmental and epileptic encephalopathy. Nat. Commun. 2019;10:2506. doi: 10.1038/s41467-019-10482-9. [DOI] [PMC free article] [PubMed] [Google Scholar]
- 44.Anderson A.C., Joller N., Kuchroo V.K. Lag-3, Tim-3, and TIGIT: Co-inhibitory Receptors with Specialized Functions in Immune Regulation. Immunity. 2016;44:989–1004. doi: 10.1016/j.immuni.2016.05.001. [DOI] [PMC free article] [PubMed] [Google Scholar]
- 45.Longo S.K., Guo M.G., Ji A.L., Khavari P.A. Integrating single-cell and spatial transcriptomics to elucidate intercellular tissue dynamics. Nat. Rev. Genet. 2021;22:627–644. doi: 10.1038/s41576-021-00370-8. [DOI] [PMC free article] [PubMed] [Google Scholar]
- 46.Cheson B.D., Fisher R.I., Barrington S.F., Cavalli F., Schwartz L.H., Zucca E., Lister T.A., et al. Alliance, Australasian Leukaemia and Lymphoma Group, Eastern Cooperative Oncology Group, European Mantle Cell Lymphoma Consortium Recommendations for initial evaluation, staging, and response assessment of Hodgkin and non-Hodgkin lymphoma: the Lugano classification. J. Clin. Oncol. 2014;32:3059–3068. doi: 10.1200/JCO.2013.54.8800. [DOI] [PMC free article] [PubMed] [Google Scholar]
- 47.Carpenter A.E., Jones T.R., Lamprecht M.R., Clarke C., Kang I.H., Friman O., Guertin D.A., Chang J.H., Lindquist R.A., Moffat J., et al. CellProfiler: image analysis software for identifying and quantifying cell phenotypes. Genome Biol. 2006;7 doi: 10.1186/gb-2006-7-10-r100. [DOI] [PMC free article] [PubMed] [Google Scholar]
- 48.Berg S., Kutra D., Kroeger T., Straehle C.N., Kausler B.X., Haubold C., Schiegg M., Ales J., Beier T., Rudy M., et al. ilastik: Interactive machine learning for (bio)image analysis. Nat. Methods. 2019;16:1226–1232. doi: 10.1038/s41592-019-0582-9. [DOI] [PubMed] [Google Scholar]
- 49.Damond N., Engler S., Zanotelli V.R.T., Schapiro D., Wasserfall C.H., Kusmartseva I., Nick H.S., Thorel F., Herrera P.L., Atkinson M.A., Bodenmiller B. A map of human type 1 diabetes progression by imaging mass cytometry. Cell Metab. 2019;29:755–768.e5. doi: 10.1016/j.cmet.2018.11.014. [DOI] [PMC free article] [PubMed] [Google Scholar]
- 50.Schapiro D., Jackson H.W., Raghuraman S., Fischer J.R., Zanotelli V.R.T., Schulz D., Giesen C., Catena R., Varga Z., Bodenmiller B. histoCAT: analysis of cell phenotypes and interactions in multiplex image cytometry data. Nat. Methods. 2017;14:873–876. doi: 10.1038/nmeth.4391. [DOI] [PMC free article] [PubMed] [Google Scholar]
- 51.Korsunsky I., Millard N., Fan J., Slowikowski K., Zhang F., Wei K., Baglaenko Y., Brenner M., Loh P.R., Raychaudhuri S. Fast, sensitive and accurate integration of single-cell data with Harmony. Nat. Methods. 2019;16:1289–1296. doi: 10.1038/s41592-019-0619-0. [DOI] [PMC free article] [PubMed] [Google Scholar]
Associated Data
This section collects any data citations, data availability statements, or supplementary materials included in this article.
Supplementary Materials
Data Availability Statement
The data used or analyzed during the present study are available on request from the corresponding author, upon reasonable request.