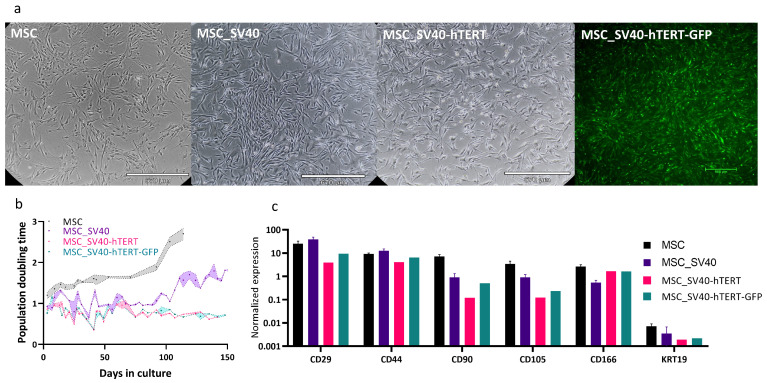
Figure 7.
Characterization of immortalized MSC lines. (a) Morphology of primary MSCs (left), and MSCs immortalized by SV40 or SV40+hTERT show similar morphologies (light and fluorescent microscopy, scale bar 670 or 500 µm, respectively). (b) Population doubling time of the cell line over time. (c) The relative expression levels of positive (CD29-CD166) and negative (KRT19) stem cell markers were measured by RT-qPCR and normalized to the PSMB2 control gene. For MSC and , data are the mean ± SEM; n = 3 for , and n = 1 for .

