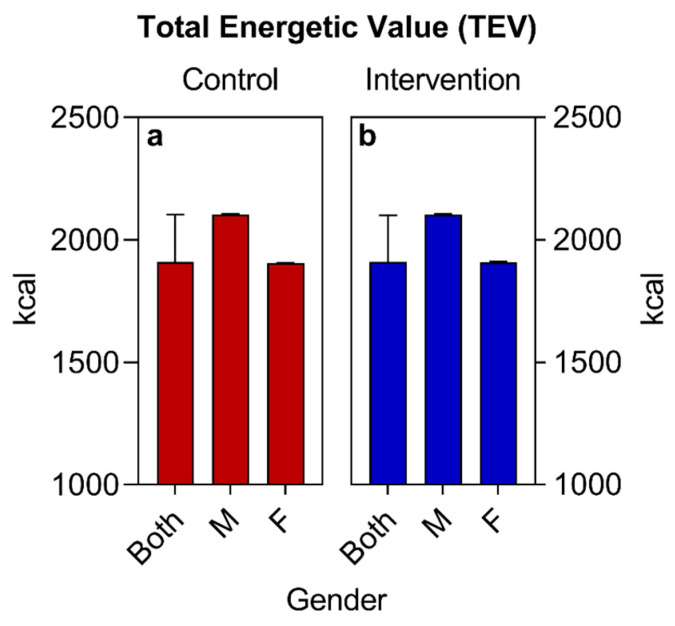
Figure 7.
Total energetic values (TEVs) of study participants. Summarization of the TEVs for participants in the control (a) and intervention (b) groups. Data are presented as median ± interquartile range. There is no significant difference between the TEV values for both sexes presented by the control and intervention groups (Mann–Whitney test; p > 0.05).

